While the Chinese Wuhan virus (aka, the Fauci Flu) has plagued the world, another Chinese “export” is also suffering what is known as contagion: China’s real estate sector.
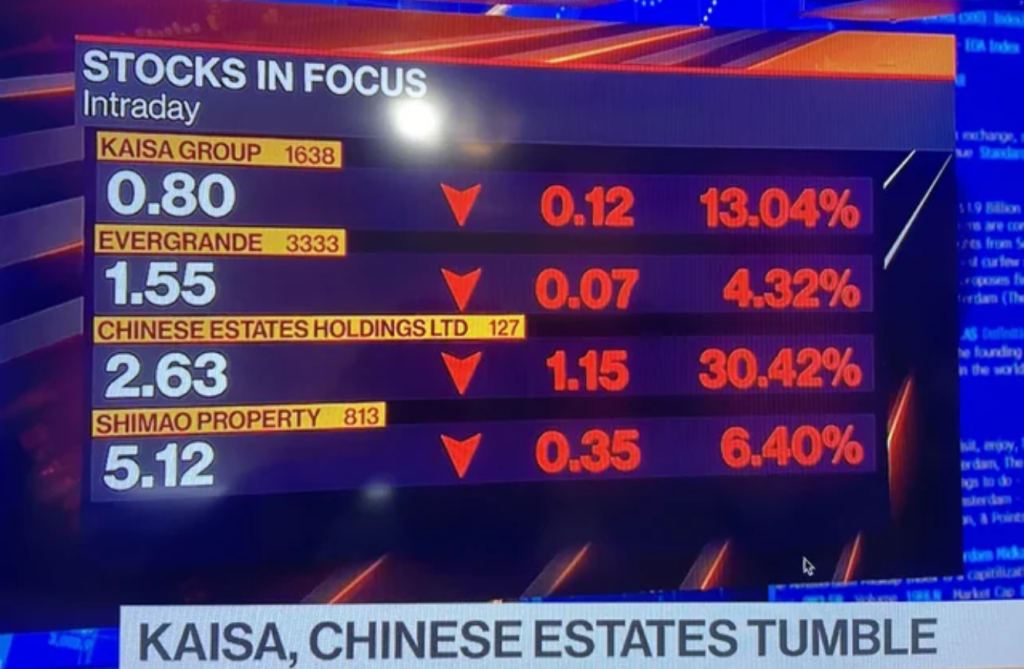
Real estate companies Evergrande, Kaisa, Shimao and Chinese Estates are falling like a rock today.
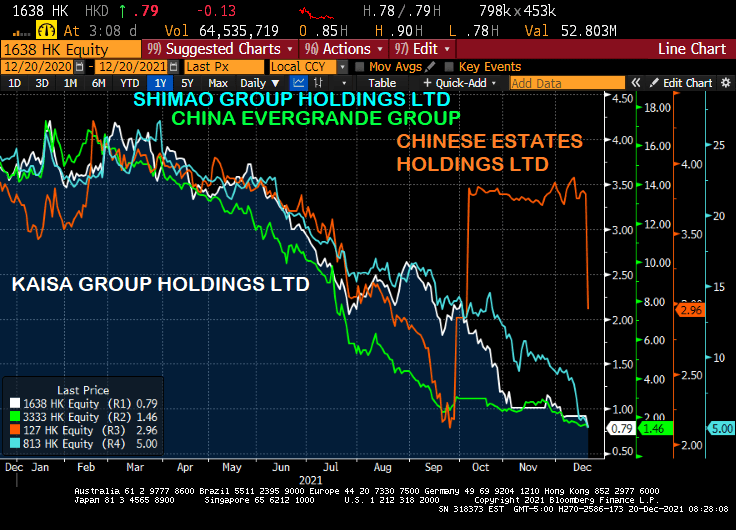
But it has been a steady decline since Q1 2021 except for Chinese Estates. But they have resumed their death dive.
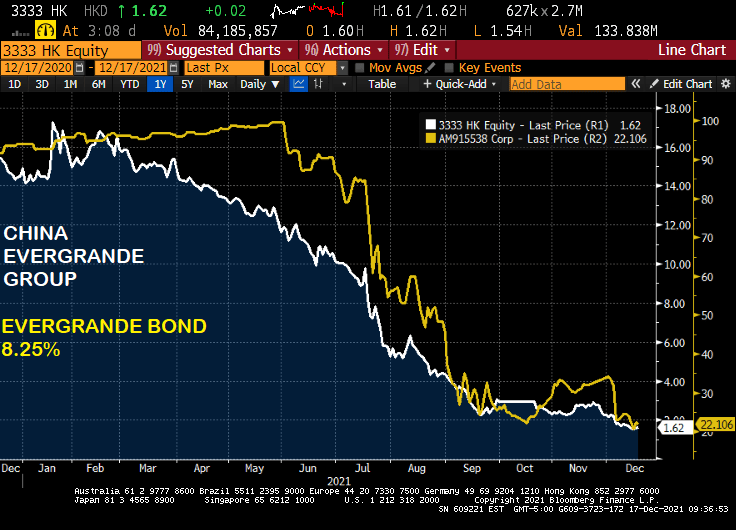
On the debt side, Evergrande is down to 18.856 while Kaisa has lost less (but still quite a bit) and Shimao’s bond look almost like a good investment, relative to Kaisa and Evergrande. But they are all sucking wind. Maybe they all have the Fauci Flu?
Let’s see if this latest Chinese “export” washes ashore in the USA.
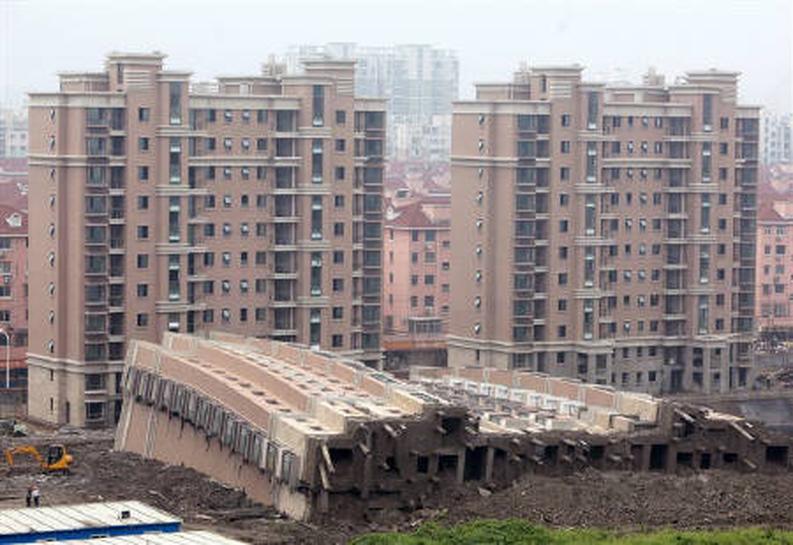
It was bound to happen given the growth rate of Chinese real estate construction.
(Bloomberg) — China Evergrande Group was labeled a defaulter by S&P Global Ratings, the second credit-risk assessor to do so.
S&P Global cut Evergrande to “selective default” over its failure to make coupon payments by the end of a grace period earlier this month, a move that may trigger cross defaults on the developer’s $19.2 billion of dollar debt. S&P Global also withdrew its ratings on the group at Evergrande’s request.
Fitch Ratings was the first to declare the property developer in default on Dec. 9. Long considered by many investors as too big to fail, Evergrande has become the largest casualty of Chinese President Xi Jinping’s campaign to tame the country’s overindebted conglomerates and overheated property market. Concern has since spread to higher-rated firms like Shimao Group Holdings Ltd. as liquidity stress intensifies.
A cautionary tale of government pushing real estate construction.
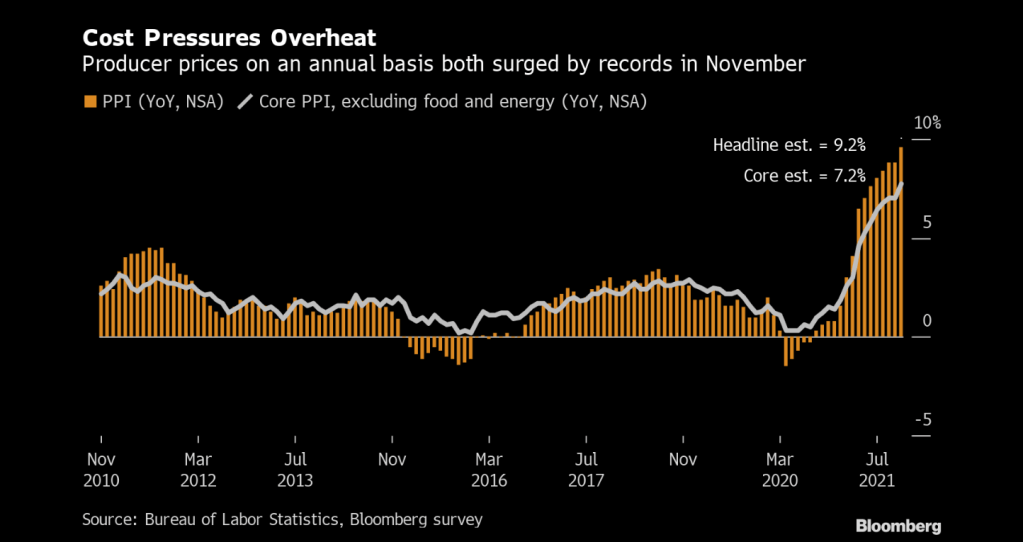
Prices paid to U.S. producers posted a record annual increase of almost 10% in November, a surge that will sustain a pipeline of inflationary pressures well into 2022.
The producer price index for final demand increased 9.6% from a year earlier and 0.8% from the prior month, Labor Department data showed Tuesday. Both advances topped economists’ forecasts.
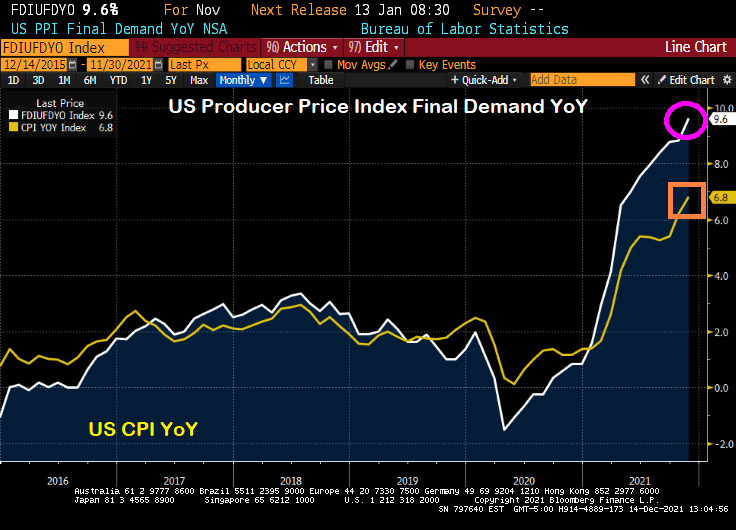
Even more interesting (or frightening) is that PPI Final Demand YoY is soaring faster than CPI YoY. If CPI catches up to PPI, then we have serious trouble.
With inflation seemingly growing out of control, Powell and Biden should sing “76 Trillion Dollars” which will be the US national debt after Biden and Congress get done with their spending splurge.
“The Congressional Budget Office and the staff of the Joint Committee on Taxation project that a version of the bill modified as you have specified would increase the deficit by $3.0 trillion over the 2022–2031 period.”
The Penn-Wharton Budget Model estimates that — if Congress follows White House policy to make most provisions permanent — then Build Back Better will reduce the long-term GDP by 2.8 percent, reduce wages by 1.5 percent, and reduce work hours by 1.3 percent. The only thing it will expand is government debt, by 25 percent.
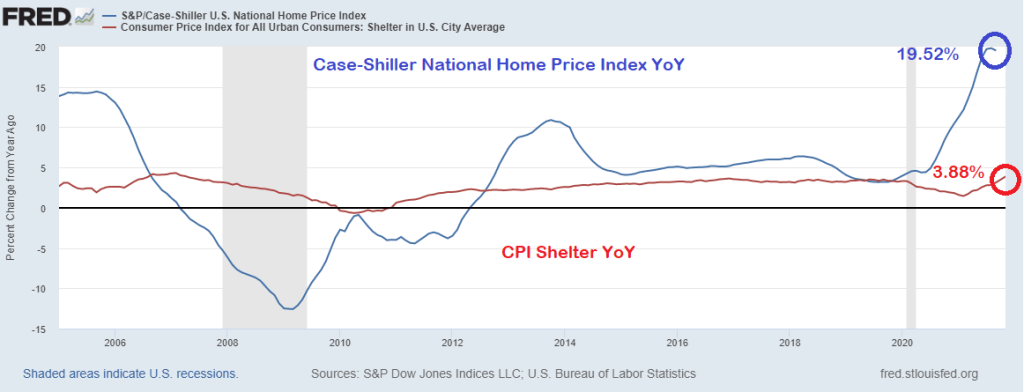
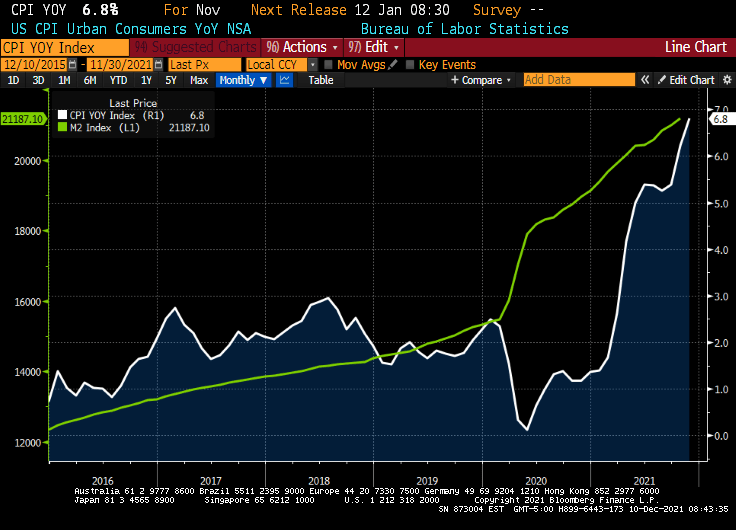
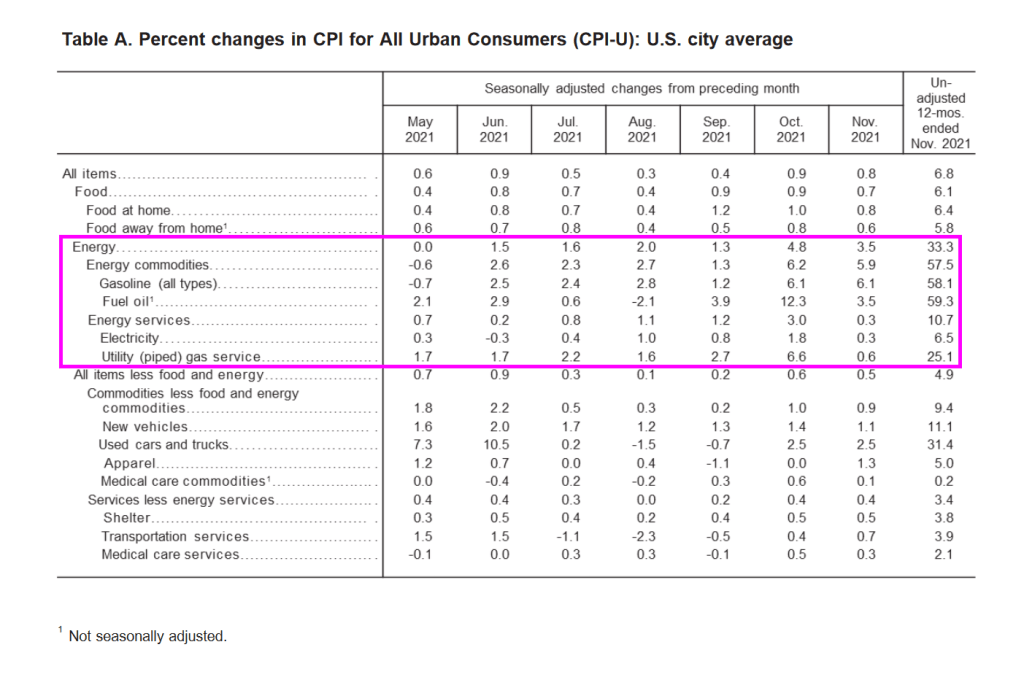
But that 6.9% YoY is very misleading because of the strange way the Bureau of Labor Statistics measures the largest asset in most households’ expenditures: housing.
The BLS measures inflation in housing using the Shelter measurement. Which was only 3.88% YoY. The problem is that the Case-Shiller National Home Price Index was 19.52% in its last reading. That is quite a discrepancy.
So, if we substitute the Case-Shiller National home price index for the CPI Shelter, we get an inflation rate of greater than 11%.
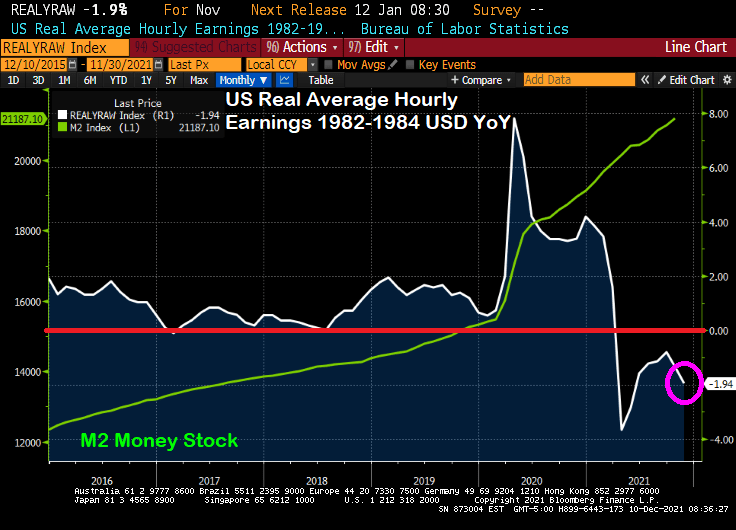
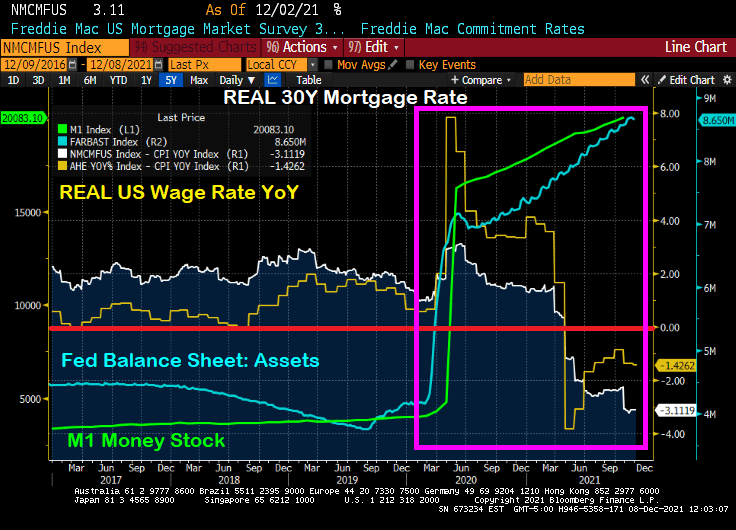
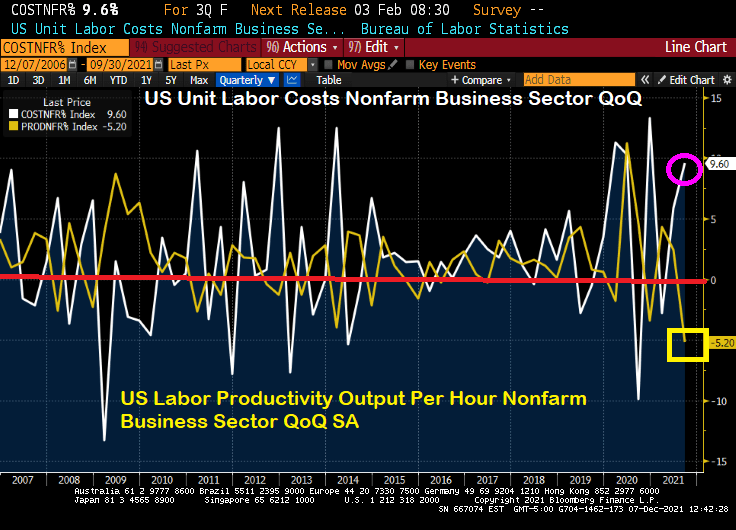
If this what the Biden Administration had in mind? Soaring labor costs at the same time that labor productivity is falling to its lowest level since 1960?
Powell and the Gang’s monetary approach doesn’t seem to be working for the labor market …
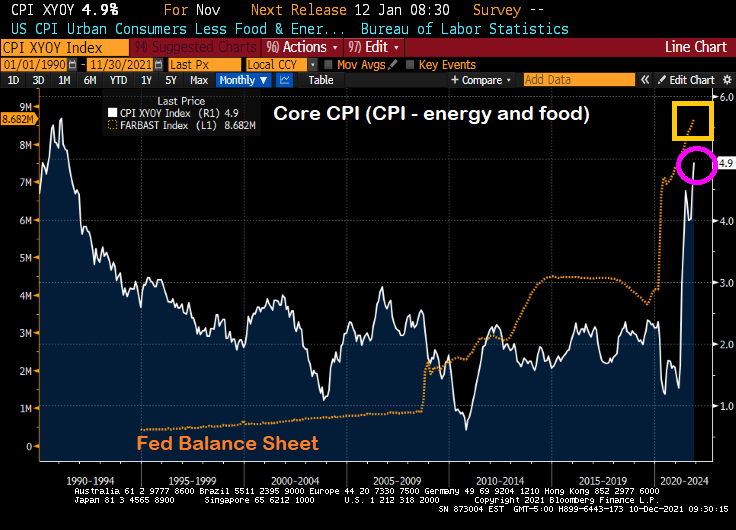
As we are all painfully aware, The Federal Reserve went on a 2nd money printing spree to allegedly stave-off the economic impacts of the COVID outbreak in March 2020. The first money printing spree took place in late 2008 as The Fed tried to stave-off the economic impacts of the housing bubble burst of 2008 and the ensuing financial crisis.
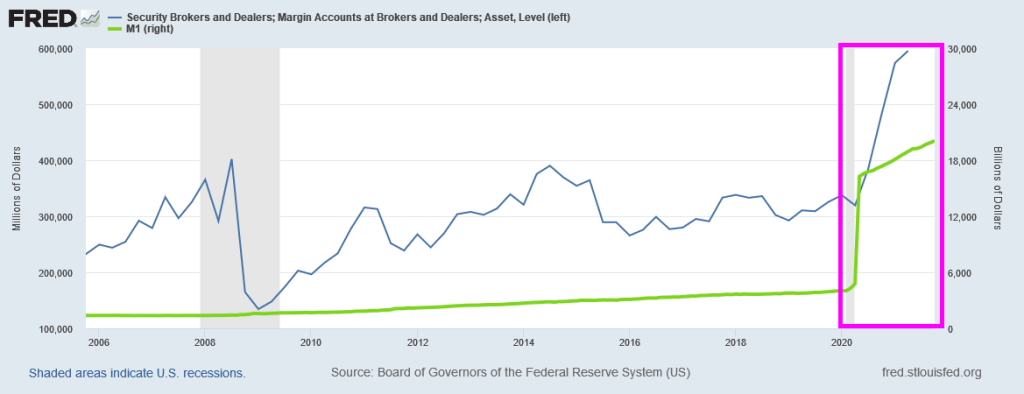
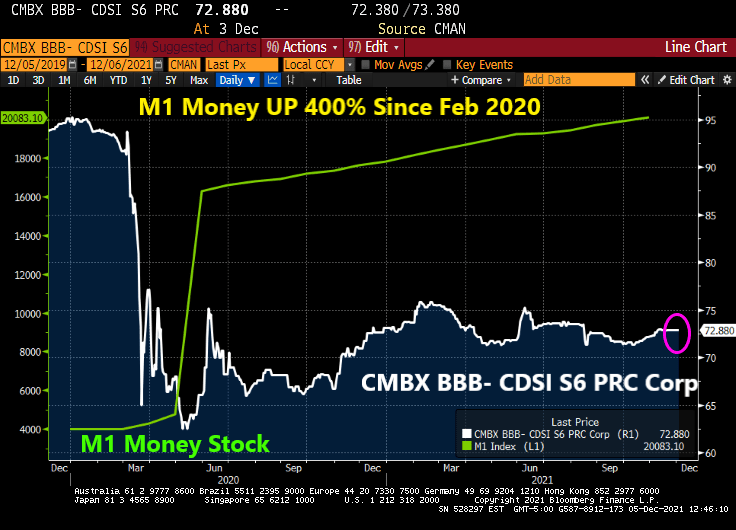
But for now, we have this horrifying chart showing the exploding margin accounts at security brokers and dealers (not, not the Walter White-type dealers, but Wall Street dealers). Notice the 400% surge in M1 Money stock after COVID struck.
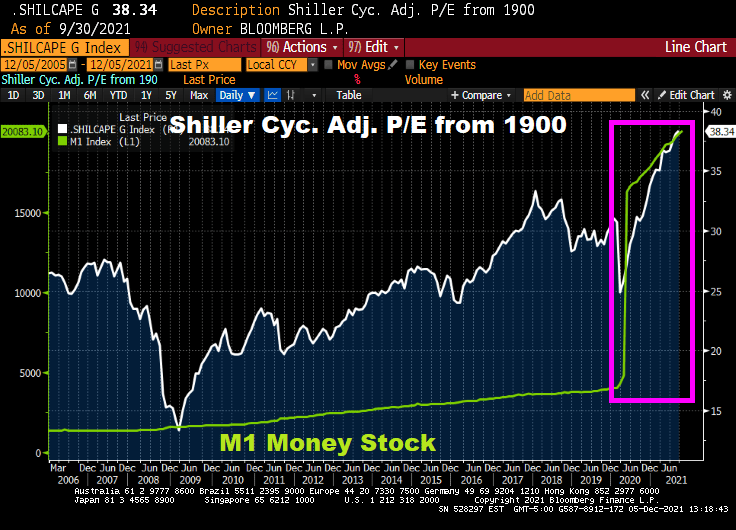
Of course, the soaring stock market is feeding the margin loop, encouraged by The Fed. Check out the Shiller Cyclically Adjusted Price Earnings (CAPE) ratio after The Fed’s M1 printing storm.
What can’t money printing fix? How about CMBS prices (or CMBX BBB- S6 prices … down 30.5% since just before COVID struck.
Let’s see if The Fed sucks the 400% growth back to zero.
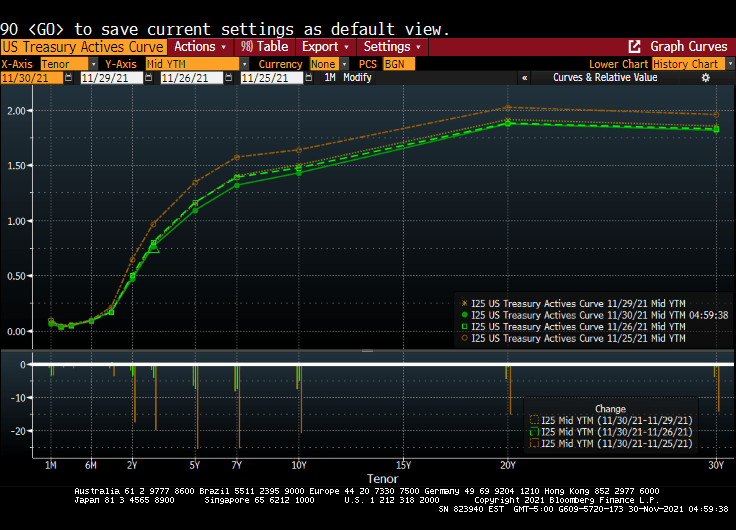
The latest scare hitting financial markets is the Omicron Variant (or Oh! Macron! Variant in France). While it caused an initial decline in global equity markets {Dow fell 900 points on early reports on Omicron), the Treasury market has been relatively unscathed.
For example, the US Treasury Actives curve dropped last Friday (the orange line represents the Wednesday before Thanksgiving), while the remaining three lines represent last Friday, Monday and Tuesdays (today). In other words, the US Treasury Actives curve has been quiet so far this week after Friday’s flattening.
The US Dollar Swaps curve shows the same dynamics. The dark blue line is last Wednesday, while the remaining lines are last Friday, this Monday and today. Not a lot happening after the initial Omicron fear factor was priced in.
Federal Reserve Chairman Jerome Powell believes that the omicron variant of Covid-19 and a recent uptick in coronavirus cases pose a threat to the U.S. economy and muddle an already-uncertain inflation outlook.
“The recent rise in COVID-19 cases and the emergence of the Omicron variant pose downside risks to employment and economic activity and increased uncertainty for inflation,” Powell said in remarks he plans to deliver to Senate lawmakers on Tuesday. “Greater concerns about the virus could reduce people’s willingness to work in person, which would slow progress in the labor market and intensify supply-chain disruptions.”
Do I detect FEAR in Powell’s voice? The odds of rate increases for next year just fell to one rate increase at the September 2022 meeting.
On the equity side, it seems to be all about whether The Fed will withdraw its support. Back in early 2018, then Fed Chair Janet Yellen and the FOMC started to shrink the Fed balance sheet (green line). This resulted in the “Smart Money Index” declining. The S&P 500 index received a jolt with the Fed stimulus around the COVID outbreak and have taken off like a jackrabbit. Despite the Smart Money Flow index being lower than in 2017.
So, is Omicron the “planet killer” or just another mild flu-like outbreak? The data is pointing towards the latter, but FEAR may cause it to be a bigger deal than is warranted.


You must be logged in to post a comment.