
Today’s GDP report from the BEA reminds me of the Peggy Lee song “Is That All There Is?” Between the massive Fed monetary stimulus since late 2008 (and particularly since Covid in 2020) and all the Federal spending (Covid relief, Inflation reduction, Omnipork spending bill, etc.), US real GDP rose by only 2.9% in Q4 from Q3.
But signs of slowing underlying demand mounted as the steepest interest-rate hikes in decades threaten growth this year.
Gross domestic product increased at a 2.9% annualized rate in final three months of 2022 after a 3.2% gain in the third quarter, the Commerce Department’s initial estimate showed Thursday.
Personal consumption, the biggest part of the economy, climbed at a below-forecast 2.1% pace (forecast was for 2.9%). Again,
The report also showed some signs of stress for American consumers whose wages have failed to keep up with inflation and continued to encourage them to draw down savings accumulated from government pandemic-relief programs. The burden of elevated prices and higher borrowing costs is mounting, pointing to a tenuous outlook for the economy.

A key gauge of underlying demand that strips out the trade and inventories components — inflation-adjusted final sales to domestic purchasers — rose an annualized 0.8% in the fourth quarter after a 1.5% gain.
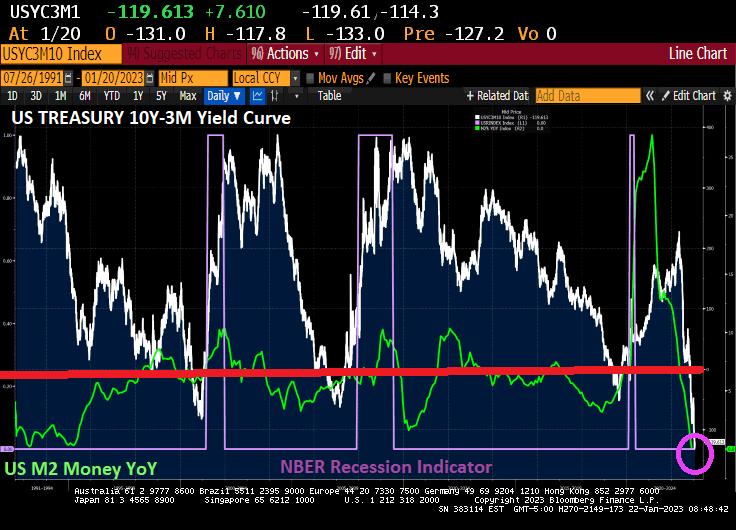
Core PCE growth grew at 3.9%, but is slowing already as M2 Money growth dies.
Stock-index futures and Treasury yields remained higher and the dollar was little changed after the GDP report and better-than-expected weekly jobless claims. Applications for unemployment insurance dropped to 186,000 last week, the lowest since April.
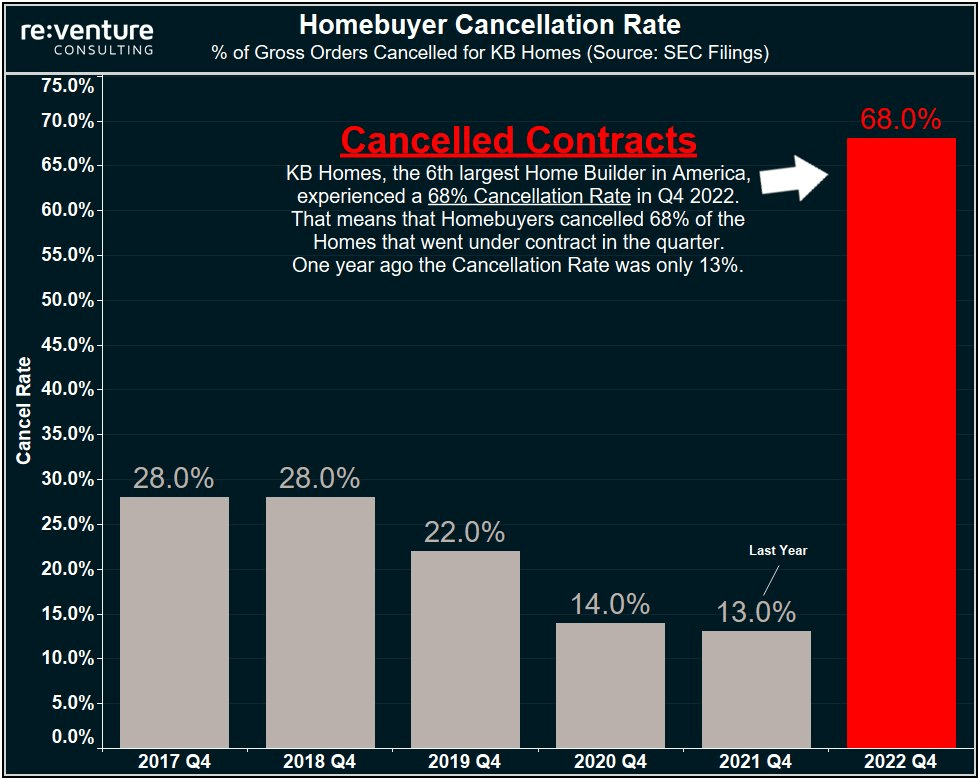
Recent data show cracks are developing more broadly. Retail and motor vehicle sales data showed households are starting to retrench, the housing market continues to weaken and some businesses are reconsidering capital spending plans.
As the Federal Reserve continues to hike interest rates to ensure inflation is extinguished, housing and manufacturing have deteriorated quickly while industries including banking and technology are carrying out mass layoffs.
The GDP report showed the personal consumption expenditures price index, a key inflation metric for the Fed, rose at an annualized 3.2% rate in the fourth quarter, down from a 4.3% pace in the prior three months. The core index that excludes food and energy climbed at a 3.9% rate compared with 4.7% paces in the prior two quarters. Monthly data for December will be released Friday.
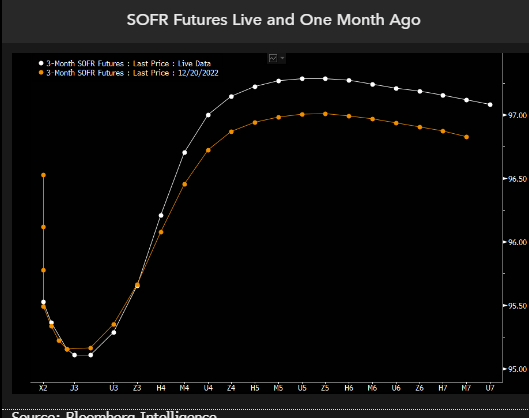
The moderation in price pressures is consistent with forecasts that the Fed will further scale back its tightening campaign next week, when it’s expected to raise rates by 25 basis points. Policymakers boosted the benchmark rate by 50 points in December after 75 basis-point hikes at their previous four meetings.
The world’s largest economy expanded 2.1% last year. In 2021, when demand snapped back from pandemic-related shutdowns, the economy grew 5.9% — the best performance since 1984.
The GDP data showed services spending increased at 2.6% annualized rate in the October-December period, the slowest since last year’s first quarter. Outlays on goods rose at a 1.1% pace, the first advance since 2021.
Business investment slowed sharply after a third-quarter surge. Spending on equipment declined an annualized 3.7%, the most since the second quarter of 2020. Outlays for structures rose at a 0.4% pace.
Let’s hope the BEA isn’t padding the numbers like the BLS was caught doing in the first half of 2022.
Lastly, US Real GDP growth YoY FELL to only 0.95925% as M2 Money growth disappears.


You must be logged in to post a comment.