The Empire Strikes Out! No, not Klaus Schwab and the World Economic Forum, but the New York State Manufacturing index. For January, the index fell to -32.9.
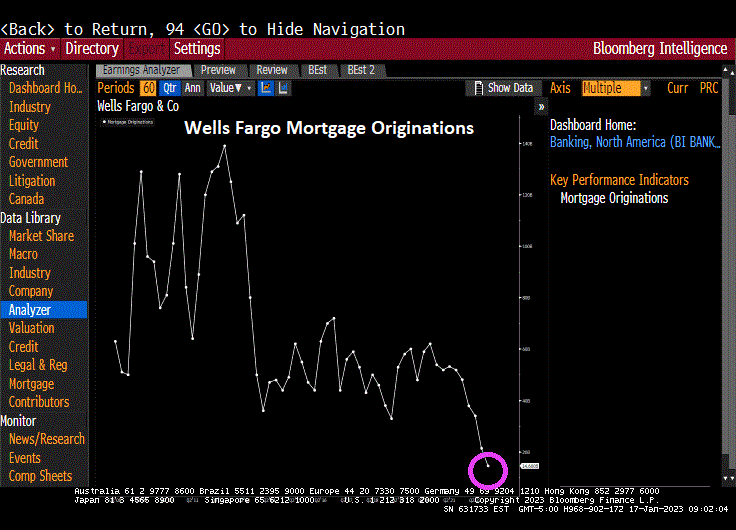
Then we have Wells Fargo and their crashing mortgage originiations.
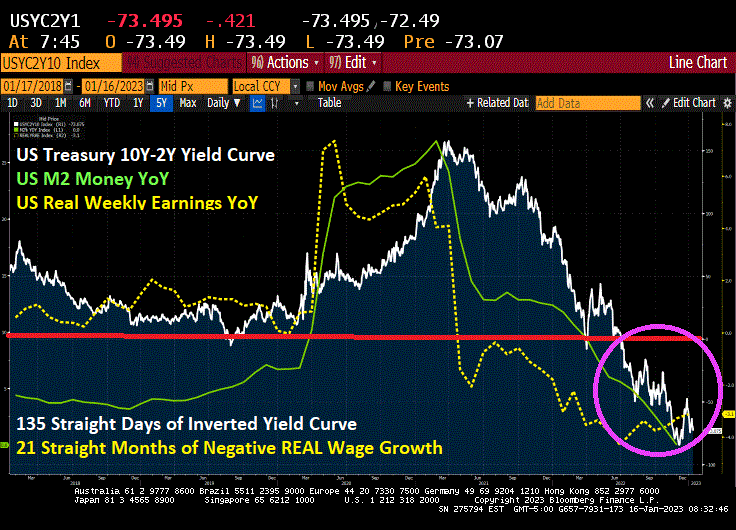
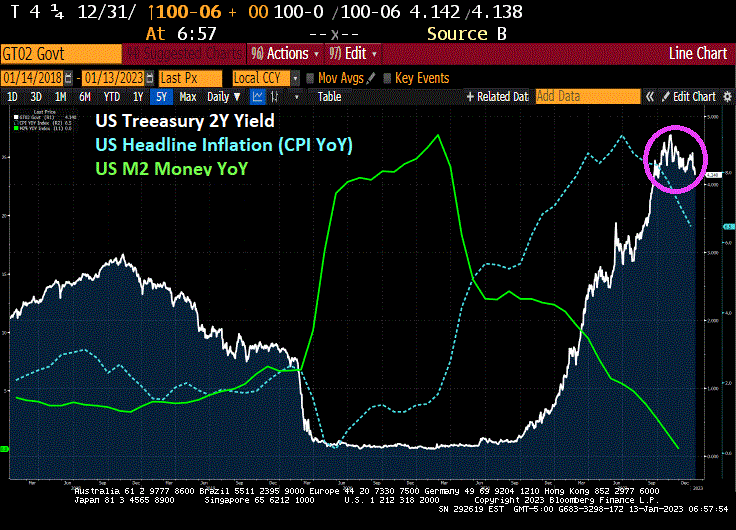
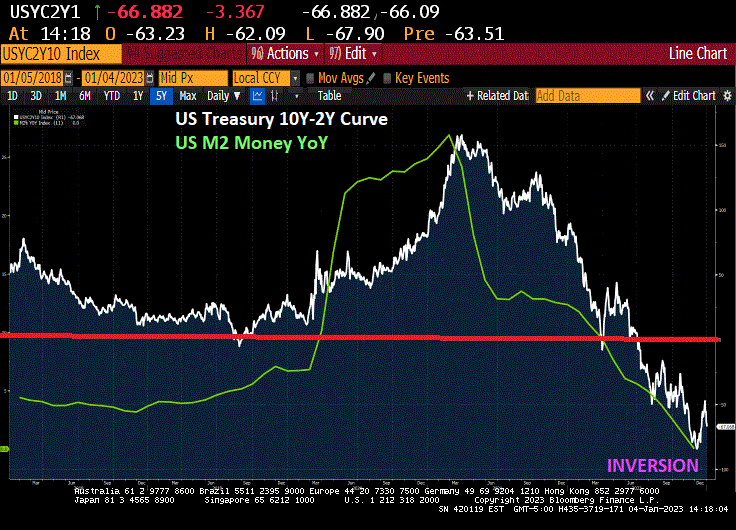
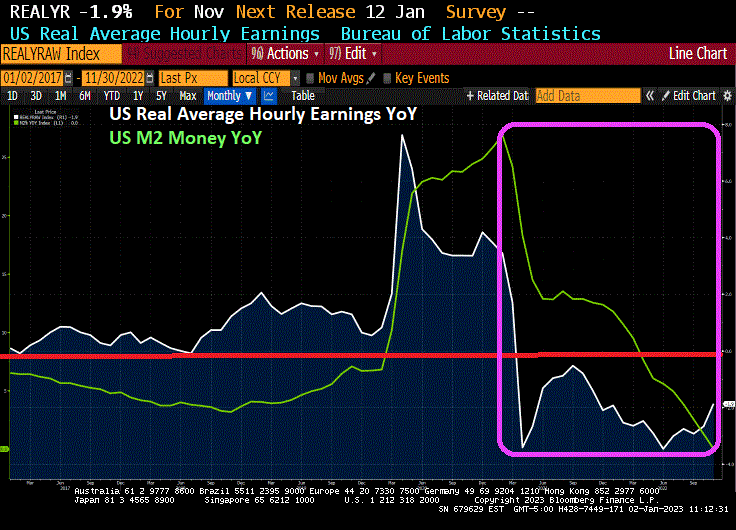
We got trouble in Potomac City! No, I’m not talking about the numerous Top Secret documents that Biden carelessly left in his garage in Delaware and the UPenn Biden Center. And they found more over the weekend. I’m talking about the US Treasury 10Y-2Y yield curve being inverted for 135 straight days. And thanks to inflation, REAL wage growth has been negative for 21 straight months.
All this is happening while M2 Money growth (green line) stalls to 0% YoY.
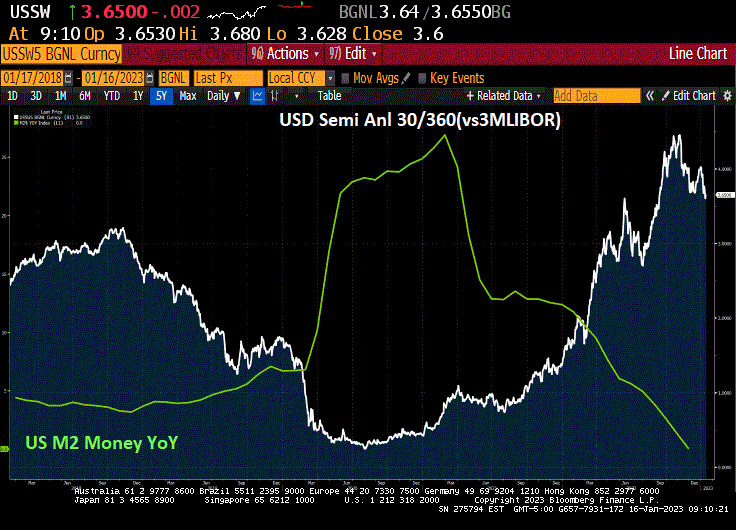
Swaps 5Y are rising as The Fed withdraws monetary stimulus.
Its that time again when Congress does its Kabuki Theater drama about raising the US debt limit. Of course, everyone in Congress and the Biden Administration want to spend trillions of dollars so they will hike the debt limit.
With the US government facing the danger of a payments default later this year, Congress has a variety of paths to avert economic disaster and boost the debt ceiling.
All of them would likely involve going right up to the market-rattling brink, according to current and former lawmakers and aides.
The timeline kicks off within weeks, when Treasury Secretary Janet Yellen is expected to advise that the government will deploy extraordinary accounting measures to avoid running out of cash. Those steps are forecast to be exhausted after July.
Republicans now in control of the House are demanding deep spending cuts as the price for an increase in the ceiling, while President Joe Biden and congressional Democrats reject such an outcome.
Nothing has been the same since the financial crisis of 2008 and the ascension of all-time big spender Nancy Pelosi as House Speaker. Budget deficits have never been the same. The last budget surplus was under House Speaker Newt Gingrich. But since the financial crisis of 2008, Federal spending seems to have increased its trajectory.
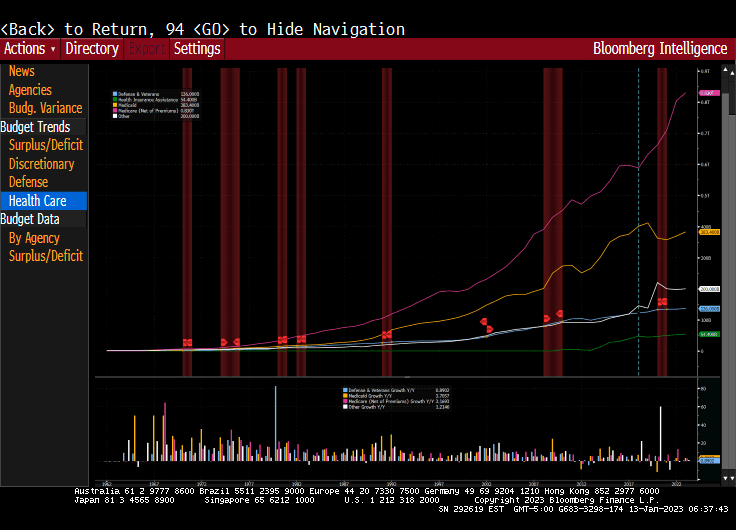
Note that mandatory spending (Medicare, Social Security, etc) is growing like a wild fire while discretionary spending is seemingly flat. So, it mandatory spending that Congress will pretend to cut.
Yes, it is Medicare for our aging population that has blown out of control.
Then we have defense spending. The Ukraine spending should come from this pot, but forces decisions to make between Ukraine and taking care of our Navy (to compete with the growing Chinese navy).
Of course, as The Fed fights inflation, we are seeing the COST of Federal debt soaring since Covid.
Yes, Congress NEEDS to cut back the spending, particularly on Social Security and Medicare (not to mention Ukraine spending), but it is all Kabuki theater. Queue the screams of “Republicans will take away …”.
I wish everyone in Congress were like Kentucky U.S. Senator Rand Paul, not the other spendaholic Kentucky Senator.
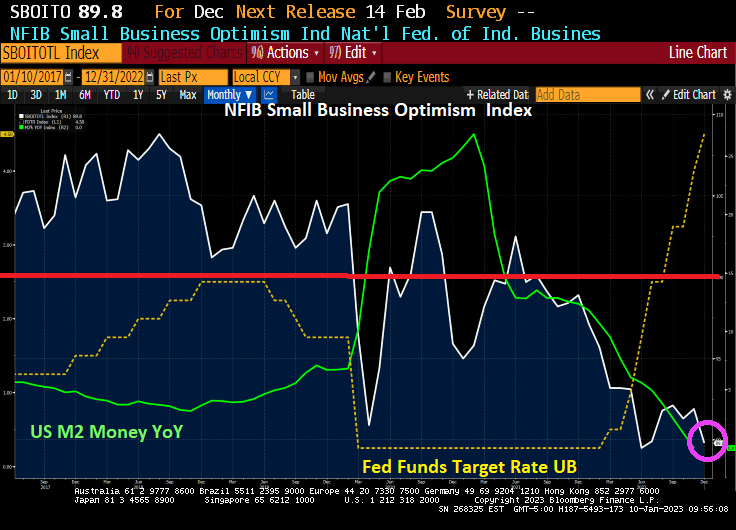
The NFIB Small Business Optimism Index is plunging and just fell below 90. The index was above 100 before the Wuhan virus outbreak in 2020, but has only been at 100 or above for only two months under Biden. And the trend is definitely looking bleak as The Federal Reserve fights inflation with M2 Money growth having collapsed to 0% YoY growth.
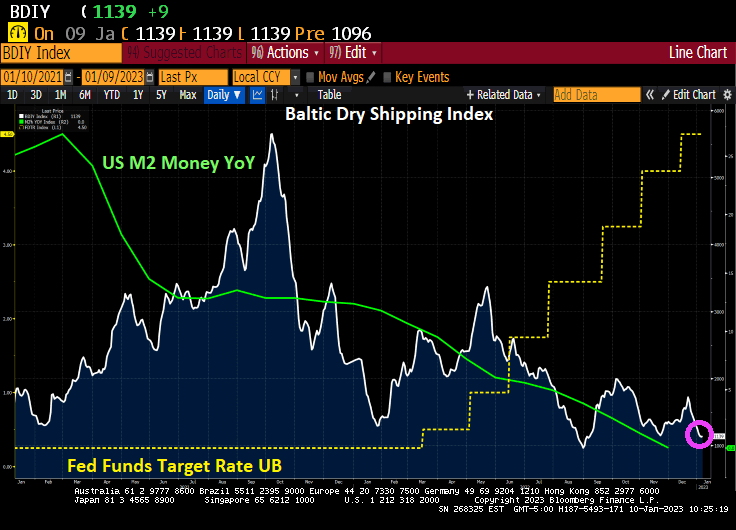
And the Baltic Dry shipping index is falling with M2 Money growth YoY.
I wonder what Fed Chair Jerome Powell is thinking?
The Federal Reserve will be the backstop of the Treasury market this year to alleviate dysfunction resulting from its increasing size and the retreat of regular buyers.
That’s the view of Credit Suisse Group AG analyst Zoltan Pozsar, who in a note to clients Friday predicted the Fed will restart asset purchases during the summer of 2023.
In Pozsar’s analysis, relative-value funds won’t buy Treasuries unless they cheapen a lot relative to overnight index swaps, and banks with sagging reserves are more likely to tap the funding markets than to buy Treasuries. FX-hedged buyers have been “priced out,” and geopolitical events have reduced large reserve managers’ appetite for US debt, he said.
Flagging demand from marginal buyers will depress demand for Treasury auctions, sparking selloffs in equities, credit and emerging markets, according to Pozsar.
“This is a ‘checkmate-like’ situation,” he wrote. “The Fed won’t be a pivot and the terminal rate may have to go higher still, neither of which augurs well for either risk assets or Treasuries.”
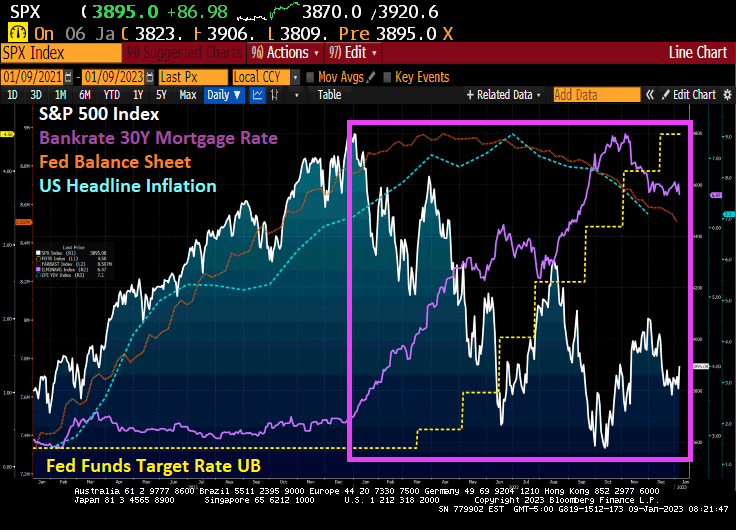
As The Fed started to raise rates (yellow line) to fight inflation (blue dashed line), the S&P 500 index started to fall. Note that The Fed’s balance sheet (purple line) is mirroring the inflation rate.
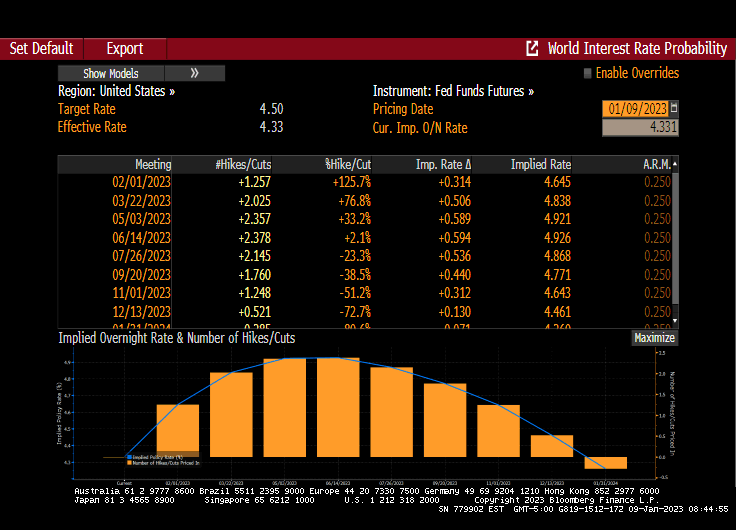
Fed Funds Futures point to Zoltan’s reversal in June 2023.
Will The Fed pivot? Zoltan says yes, the talking Fed heads say no.
US headline inflation began to soar as soon as Joe Biden became President. A combination of massive stimulus spending related to the Covid economic shutdown and his war on fossil fuels, driving up gasoline and diesel fuel prices. In other words, headline inflation rose from 1.4% Year-over-year (YoY) at the end of December 2020 to 9.1% YoY in June 2021. It has now simmered down to 7.1% YoY as The Fed continues to remove monetary stimulus.
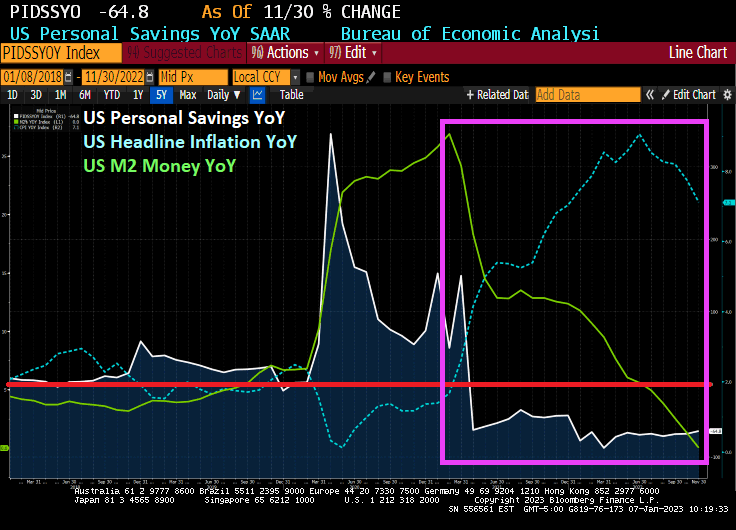
How have consumers coped with inflation caused by massive Federal spending and Biden’s anti-fossil fuel policies? In November, personal savings dropped -64.8% YoY. This marks 20 straight months of declining personal savings.
US M2 Money growth YoY is now … 0%. That is the lowest in US history.
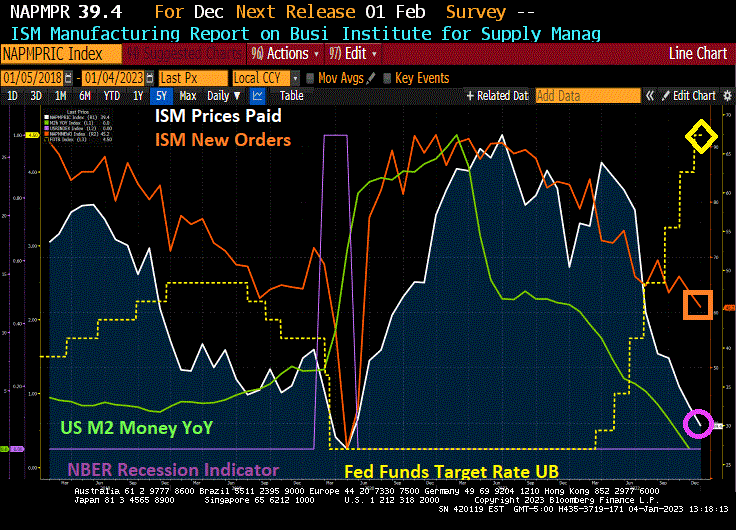
And with it, ISM Manufacturing Report for December is showing weakness. New orders (orange line) is down to 45.2 (below 50 is contraction) and the prices paid is down to 39.4 (white line). All this is happening as The Fed raises its target rate (yellow line) and removes monetary stimulus (green line).
This gives us “The Devil’s Tower” looking economic spike after massive Covid-related monetary stimulus and Federal government repeated stimulus.
Speaking of Already Gone, look at the US Treasury 10Y-2Y yield curve with slowing M2 Money growth. Yield curve inversion is more about vanishing M2 Money growth than it is a forecast of recession.
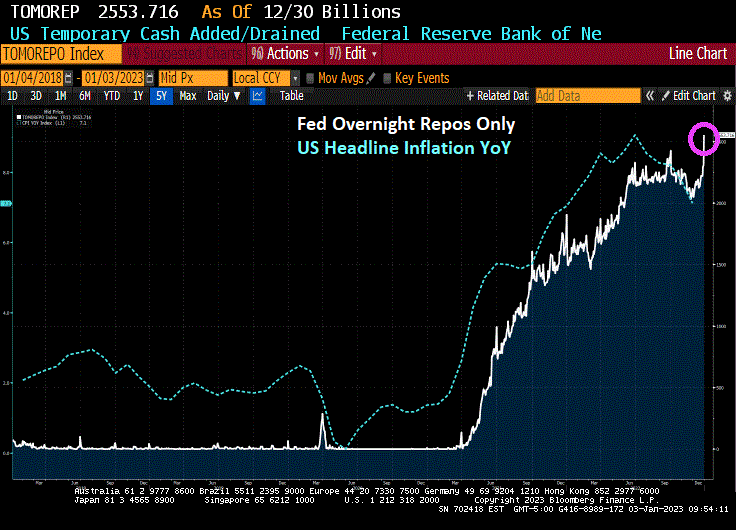
First, banks are stashing cash with the New York Fed on an “overnight basis” although it is looking pretty permanent to me. Repos (or repuchase agreements) soared to $2.55 TRILLION as of 12/30/22.
But this morning we see the US Treasury 10-year plummeting -15 basis points. As I used to tell my University of Chicago, Ohio State and George Mason finance students, any 10 basis point shift (plus or minus) is a big deal. Something is happening.
The 10-year Treasury yield plunging -15 bps is a “good thing” for the mortgage market in that US mortgage rates will likely follow suit and fall.
Today is all quiet of the financial market front since the US stock
Today is all quiet of the financial market front since the US stock and bond markets are closed. But as the new year starts, we have to ask the following question: is the US already in a recession?
A simple measure of IMPENDING recession is the US yield curve which is currently inverted. Typically, a recession occurs within months of the yield curve inverting. But if we look at real GDP growth, the Atlanta Fed GDP tracker is at 3.7%, so no recession there (two consecutive quarters of negative GDP growth is often used as a measure of recession).
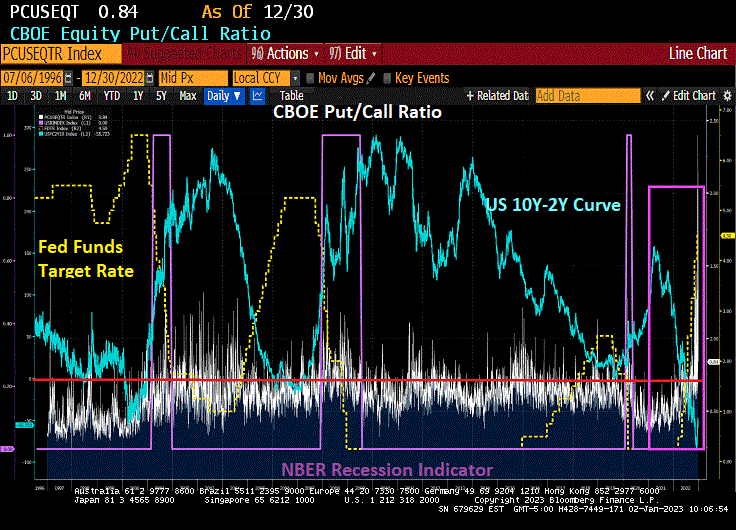
But another indicator of “all is not well” is the CBOE Put/Call Ratio. Typically, the Put/Call Ratio spikes during a recession. But on December 28, 2022, the Put/Call Ratio spiked to its highest level since 1996. Although it has calmed down to 0.84 on December 30, 2022. Suffice it to say that there is enormous uncertainty in markets.
Covid begat massive Fed monetary stimulus and an excuse for the Federal government to go on a series of spending sprees (Covid “relief”, Instrastructure, Inflation Reduction, and now the $1.7 Trillion pork-laden Omnibus bill). Now that historic big spender Nancy Pelosi (CA-D) is no longer Speaker, will her successor have such a voracious spending appetite? The US economy is still benefitting from Covid-related stimulus which also helped generate 40-year highs in inflation.
Thanks to inflation, US workers have had 20 consecutive months of negative wage growth. But as M2 Money growth slows to a halt, so will real average hourly earnings.
The traditional measures of recession (unemployment and Real GDP growth) are NOT pointing to recession, but 20 straight months of negative wage growth points to bad news for workers. Throw in an inverted yield curve and massive volatility in the CBOE Put-Call Ratio and we have a party … that I don’t want to attend.
A simple measure of IMPENDING recession is the US yield curve which is currently inverted. Typically, a recession occurs within months of the yield curve inverting. But if we look at real GDP growth, the Atlanta Fed GDP tracker is at 3.7%, so no recession there (two consecutive quarters of negative GDP growth is often used as a measure of recession).
But another indicator of “all is not well” is the CBOE Put/Call Ratio. Typically, the Put/Call Ratio spikes during a recession. But on December 28, 2022, the Put/Call Ratio spiked to its highest level since 1996. Although it has calmed down to 0.84 on December 30, 2022. Suffice it to say that there is enormous uncertainty in markets.
Covid begat massive Fed monetary stimulus and an excuse for the Federal government to go on a series of spending sprees (Covid “relief”, Instrastructure, Inflation Reduction, and now the $1.7 Trillion pork-laden Omnibus bill). Now that historic big spender Nancy Pelosi (CA-D) is no longer Speaker, will her successor have such a voracious spending appetite? The US economy is still benefitting from Covid-related stimulus which also helped generate 40-year highs in inflation.
Thanks to inflation, US workers have had 20 consecutive months of negative wage growth. But as M2 Money growth slows to a halt, so will real average hourly earnings.
The traditional measures of recession (unemployment and Real GDP growth) are NOT pointing to recession, but 20 straight months of negative wage growth points to bad news for workers. Throw in an inverted yield curve and massive volatility in the CBOE Put-Call Ratio and we have a party … that I don’t want to attend.
2022 is one of the record books and not in a Tiger Woods way. Call it a year of pain.
First, the US enacted policies that drove up energy prices (goin’ green) that reverberated through the entire economy in the form of higher prices. Second, The Federal Reserve, in attempt to combat runaway inflation, started removing the excessive monetary stimulus that had been around since Fed Chair Bernanke initiated QE, the seemingly unlimited purchase of Treasury and Agency MBS securities. Janet Yellen continued the massive asset purchases and zero interest rate policies or ZIRP. Now that inflation has struck the American middle class hard, we are seeing Fed Chair Powell doing what Bernanke and Yellen wouldn’t do — remove the monetary punchbowl.
Using Robert Shiller’s on line data, US stocks and bonds have had an awful year, the worst combined year since 1871.
US equity returns have been demolished under the NEW dual mandate (goin’ green = rising prices = Fed tightening).
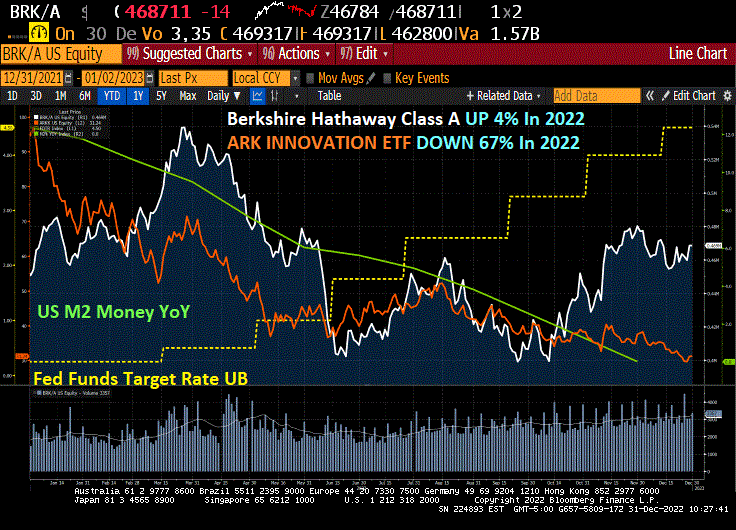
Let’s see how two of the most famous investment gurus did in 2022, Warren Buffet and Cathie Wood. Buffet’s Bershire Hathaway Class A equity was UP 4% in 2022, while Cathie Wood’s ARK Innovation ETF collapsed by -67% in 2022.
Here is the clinker. The US economy (as well as the global economy) seem dependent on “cheap money” from Central Banks like The Federal Reserve. So the question is … will The Fed pivot? Fed talking heads are saying no, but Fed Funds investors are saying yes to a pivot after June 2023.
Ulysses S Grant was the President the last time the combined stock and bond market was this bad.


You must be logged in to post a comment.