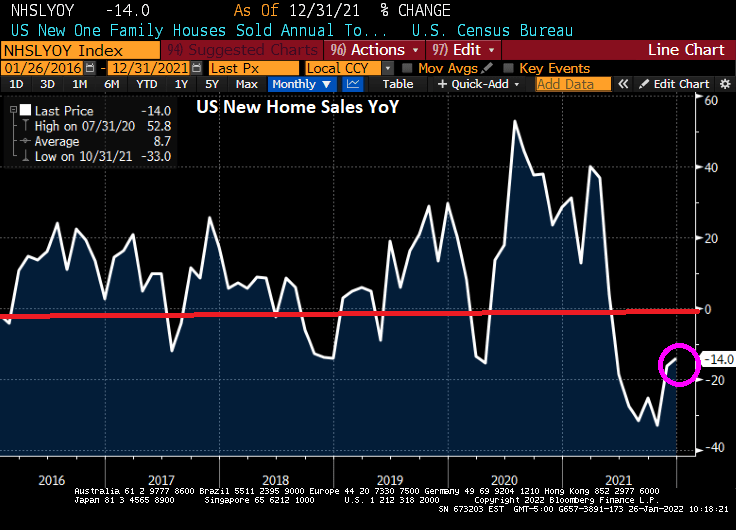
US new home sales spiked in December by 11.9% from November, but were down 14% year-over-year.
But the median price of new home sales (YoY) declined to 3.4%.
The Midwest saw a surge in new home sales (+56%).
The MBA’s mortgage applications index shows declining purchase applications (-1.83%) and declining refinancing applications (-12.60%) as mortgage rates increased from 3.64% to 3.72% for the week of 01/21.
Now, mortgage purchase applications rose for the week of 01/21 if we used non-seasonally adjusted data.
Is this the bubble burst many were expecting once The Federal Reserve starting raising rates?
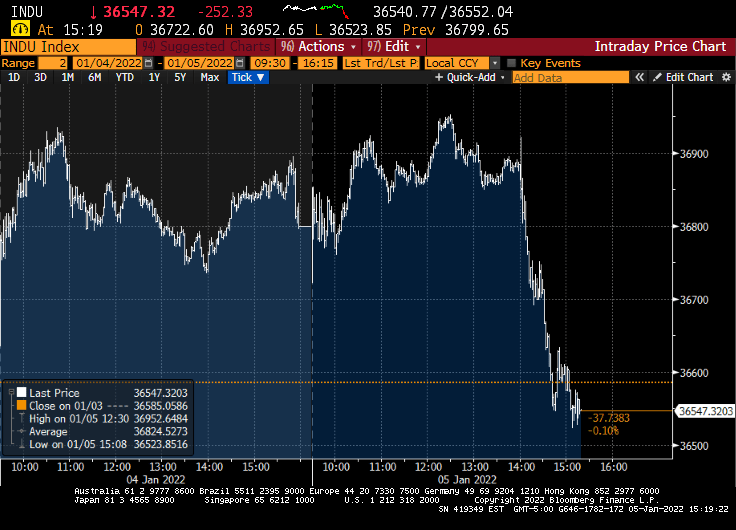
Well, if today’s market opening is an indication, the answer is yes. The NASDAQ Composite Index is down 1.36% and West Texas Intermediate Crude Oil futures prices are down 2%.
The S&P 500 index is down over 10% since January 3rd.
Drawdown is taking place.
But if you think the US equities are deflating, look at European equities. The Euro Stoxx 50 index is down 4.04%.
If you look at the following chart, you can see multifamily (5+ unit) starts remain elevated (pink box) which is not surprising given that home prices at growing at 19.1% YoY nationally (orange circle) and REAL hourly earnings have declined (yellow triangle) thanks to reemergence of inflation after 40 years.
Then we have the humming dragon, rising mortgage rates, that will reduce housing affordability even further.
Start with the UMich Buying Conditions for Houses. It “rose” to 83. Unfortunately, 100 is the baseline and any number below 100 is bad. The reason? The massive increase in US home prices since 2020.
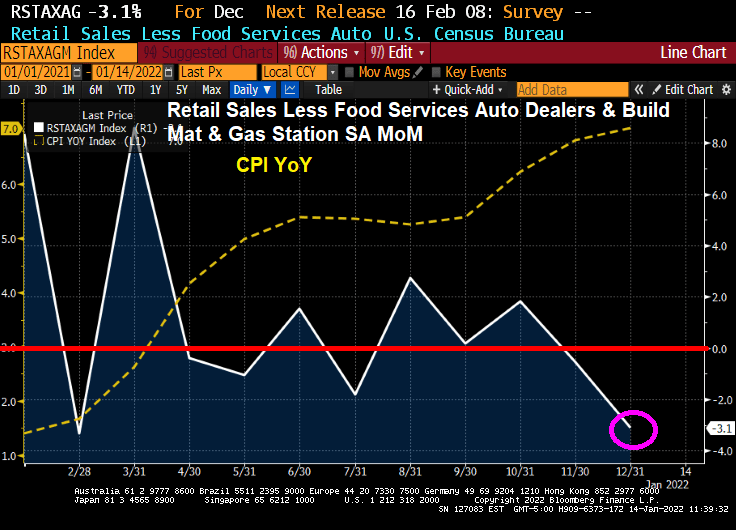
But retail sales are hurting thanks to higher prices. Retail sales less food services and auto are DOWN 3.1% MoM.
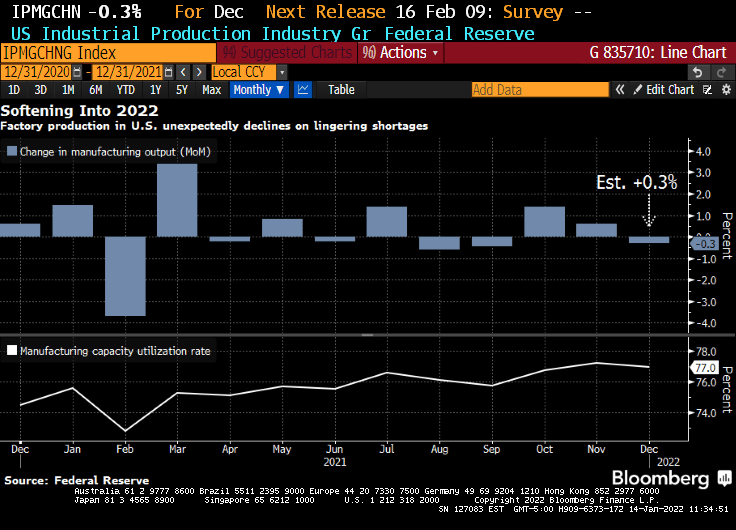
Meanwhile, US industrial production fell to -0.3%.
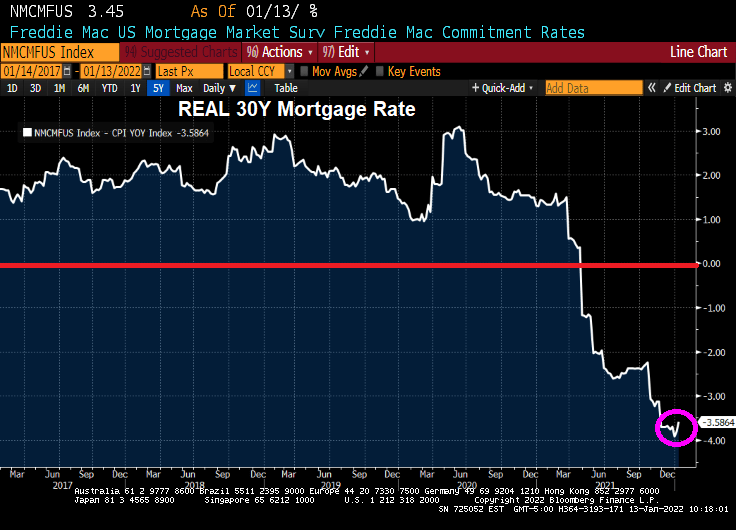
Mortgage rates in the U.S. rose for a third straight week, reaching the highest point in almost two years.
The average for a 30-year loan was 3.45%, up from 3.22% last week and the highest since March 2020, Freddie Mac said in a statement Thursday.
Rates tracked a jump in yields for 10-year Treasuries, which climbed to levels not seen since early 2020, before the pandemic roiled financial markets. Signs point to borrowing costs rising further as the job market improves and the Federal Reserve steps up its efforts to tame inflation.
That would increase the burden on homebuyers who are already stretching to afford a purchase. Rates for 30-year mortgages tumbled to a record low of 2.65% a little more than a year ago.
Cheap loans have helped fuel a housing rally that’s still running hot even as home prices soar out of reach for many Americans.
But wait! The REAL 30-year mortgage rate (nominal 30-year rate – CPI YoY) is -3.59%.
Lael Brainard, Biden’s nominee to be Vice Chairman of The Federal Reserve, has been one of the “inflation is transitory” crowd. US Senator Toomey is questioning Brainard in today’s hearing. From Toomey’s opening statement:
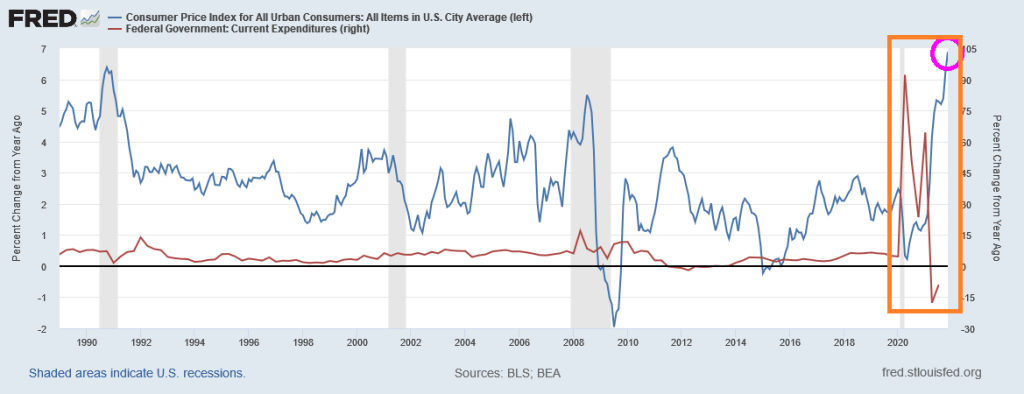
Last year, Governor Brainard repeatedly insisted that inflation was transitory. We have now had nine consecutive months where inflation has been more than two times the Fed’s 2% target. That makes it pretty clear that inflation is not transitory. Yesterday’s CPI release of 7.0%—the highest in 40 years—confirms that.
Inflation is a tax that is eroding Americans’ paychecks every day. Even though wages are growing, inflation is growing faster and causing workers to fall further and further behind.
At least the REAL mortgage rate is negative!
I hope Senator Toomey shows Brainard this chart of “transitory” negative wage growth.
Negative wage growth and negative REAL mortgage rates. What a total mess!
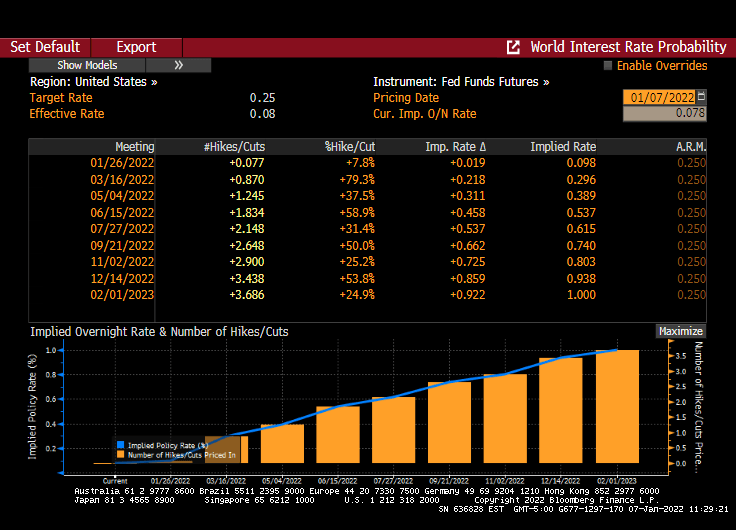
It looks like markets are buying into the prospect of The Federal Reserve raising rates three times (Bob) in 2022. And ceasing COVID monetary stimulus.
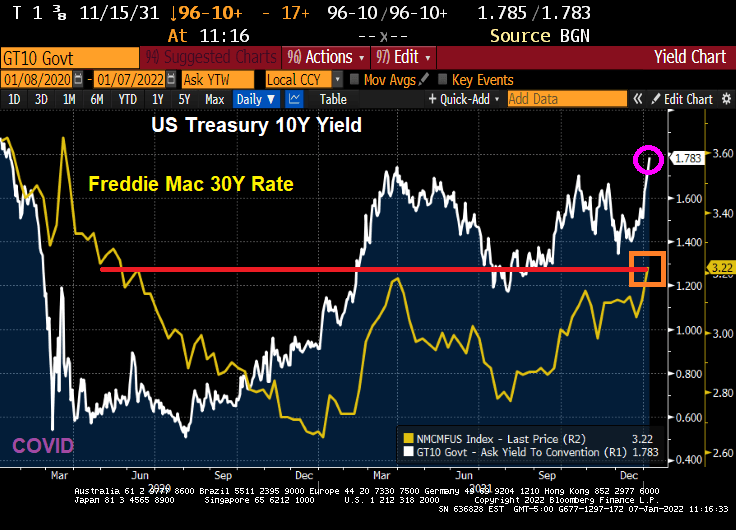
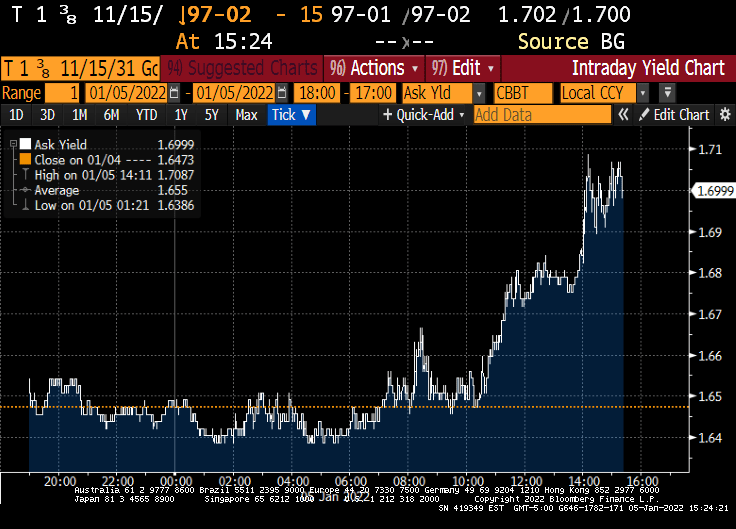
Today, the 10-year Treasury yield rose to PRE-COVID levels of 1.783%. And the Freddie Mac 30-year mortgage commitment rate rose to 3.22%, the highest since May 2020.
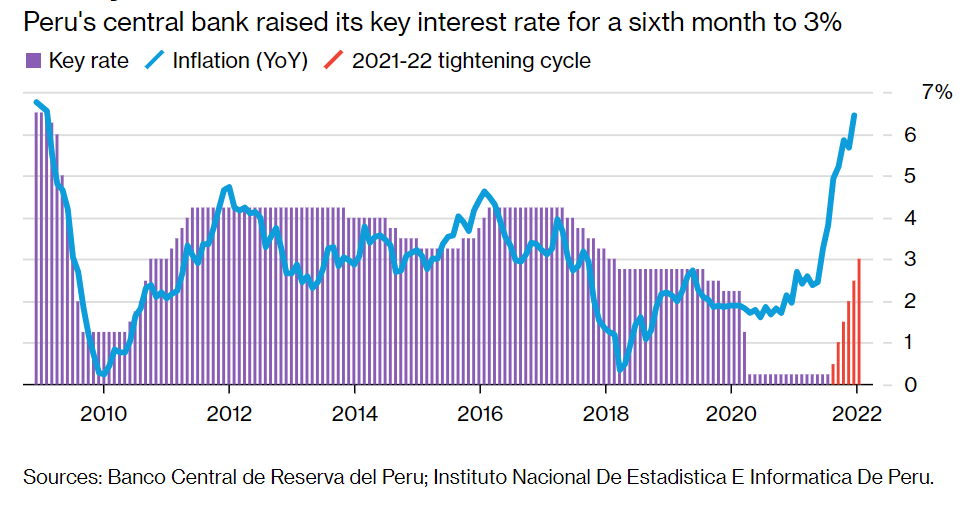
Today’s rising wage rates (although negative in terms of REAL wage rates) will likely put a Peruvian fire under The Fed’s behind. As of this morning, Fed Funds Futures are still pointing to three rate increases in 2022 (May, July and December).
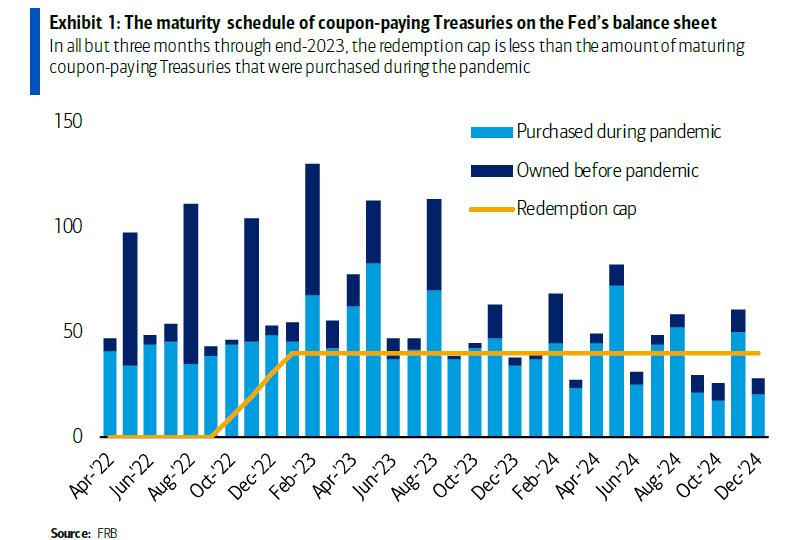
And The Fed is supposed to be winding down the COVID monetary stimulus.
Why a Peruvian fire? Even Peru’s central bank is raising its key interest rate to 3% after soaring inflation.
Let’s see if Powell and The Gang follow through … or reveal themselves to be Peruvian Chickens.
“Some participants also noted that it could be appropriate to begin to reduce the size of the Federal Reserve’s balance sheet relatively soon after beginning to raise the federal funds rate,” the minutes said.
The S&P 500 stock index extended declines following the release and was on track for its biggest loss in more than a month. Treasuries also extended losses and the dollar pared its decline.
At the conclusion of the December meeting, the FOMC announced it would wind down the Fed’s bond-buying program at a faster pace than first outlined at the previous meeting in early November, citing rising risks from inflation. The new schedule puts the central bank on track to conclude purchases in March.
And with the minutes released, the Down dumped.
And the 10-year Treasury yield jumped 5.3 bps on the release.
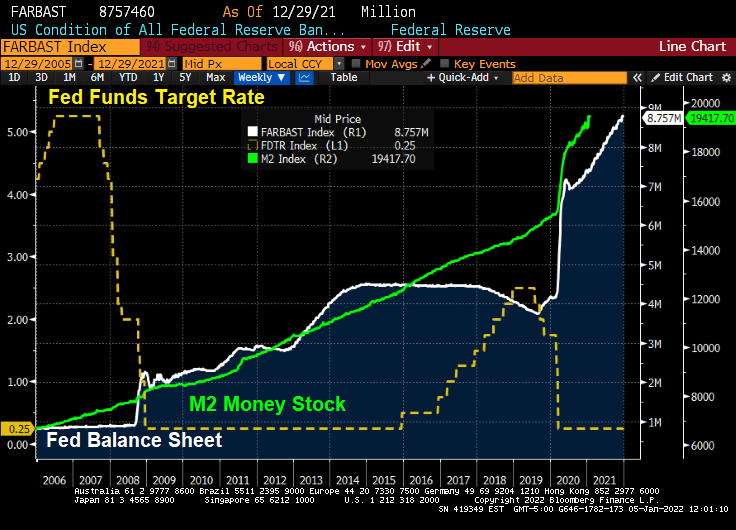
When we look at the Buffett Indicator, we can see how The Federal Reserve’s loose monetary policies (or follycies) are driving up stocks to unsustainable levels that may not survive without The Fed’s “Do Ho Big Bubble Policies.”
How about the Shiller CAPE (Cyclically-adjusted Price/Earnings) ratio? While not up to dot.com levels yet, the Shiller CAPE ratio is climbing with the assistance of The Fed and their insane money printing.
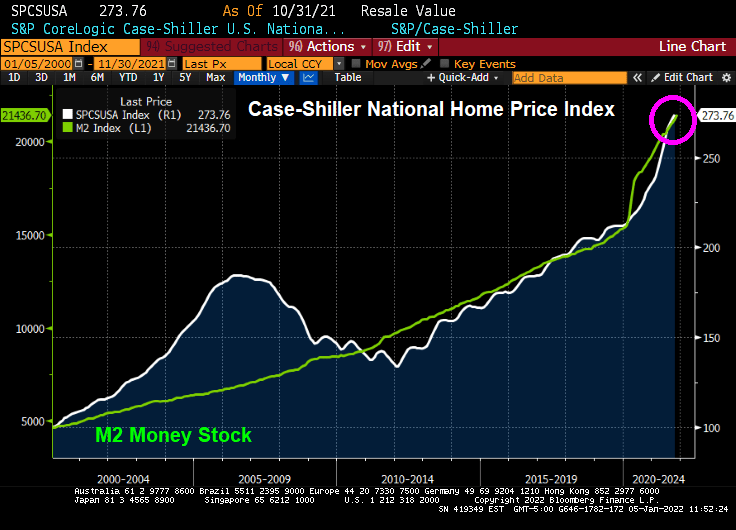
How about house prices? The Case-Shiller National home price index is far above the level last scene during the housing bubble of 2005-2007. Again, with a little help from The Federal Reserve.
I can’t wait to see how the equity market and housing market reacts IF The Fed actually follows through with reducing monetary stimulus. Probably not just adding more stimulus, just reinvesting the Treasury and MBS proceeds (aka, not shrinking the balance sheet).
Happy New Year! And Treasuries are off to fast start with investors bailing on Treasuries and buying stocks. AND the expectation that The Fed will raise rates 3 times this year.
The 10-year Treasury Note yield rose above 1.60% this morning.
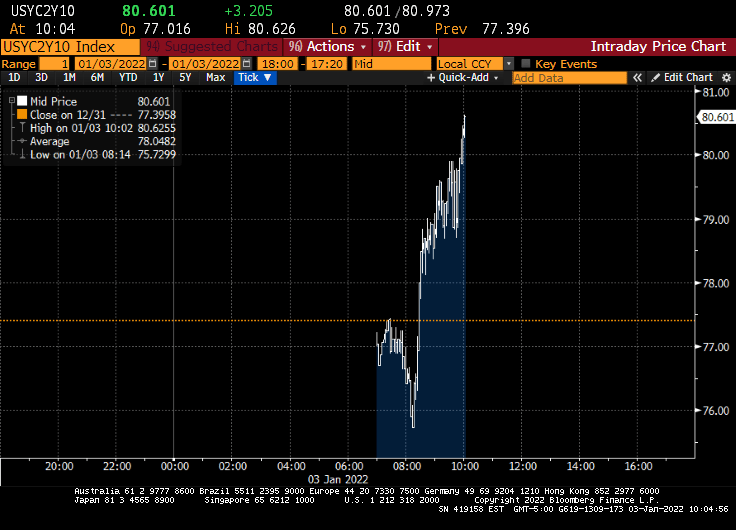
And the US Treasury 10Y-2Y curve rose to 80.601 basis points.
Fed Funds Futures data is showing 3 rates hikes in 2022. May, September and December.
The Fed Dots project is definitely showing an upward trend in the Fed Funds Target rate with FOMC member forecasting the median target rate to be above 2% by 2024.
Of course, Fed reverse repo activity grew to an all-time high (but it is expected to pare-back).
How about mortgage rates? I expect mortgages rates to rise over 2022 as the 10-year Treasury Note rises.
Cautionary note: The Fed is likely to protect economic growth and ignore inflation. So I expect FOMC will continue to reinvest prepayments into Treasury and MBS, pro-rata to the current portfolio.
A good quote from The Hill story: “Under Biden, the American economy has recovered from its Trump-era lows with remarkable speed.” As Leslie Knope said “That seems like an unfair phrasing.”
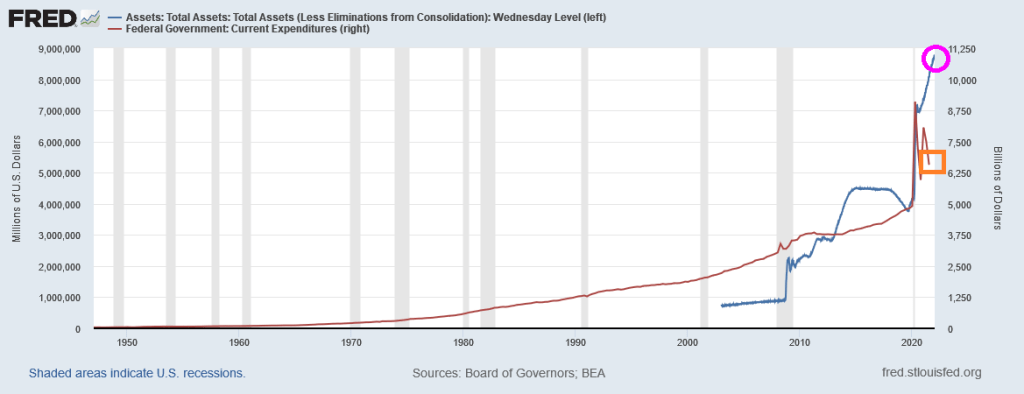
Hmm. Well, here is a chart that best explains the “Biden Miracle.” It shows the growth in Federal expenditures from the previous year during the banking crisis and then the COVID crisis. During the banking crisis, the increase in Federal expenditures (red) was normal. It was the increase in The Fed’s balance sheet (blue) that was staggering. But for the mini-recession related to COVID (only two months so you can barely see it on the chart below), it was the growth in Federal expenditures (red) combined with another round of staggering Federal Reserve stimulus (blue).
A different view of Federal “Stimulypto” is show below. Since COVID and the election of Joe Biden as President, Fed monetary stimulus is at an all-time high and Federal expenditures, while they have slowed, are still above the pre-COVID spending levels.
Please note that the massive surge in Federal expenditures and Fed monetary stimulus began under Trump, but were only continued under Biden. That is why no one notices … it was Trump.
And if we look at the 10Y-2Y Treasury curve slope, the US is slippin’ into darkness since the slope typically rises after a recession, then falls. And we are in the falling (or slippin’) stage.
So, President Biden is benefiting from Trump’s and The Fed’s Stimulypto. I don’t expect partisan outlets like The Hill or crooner Barbra Streisand to look at the data.
With Build Back (Inflation) Better not passing in the US Senate, I fully expect The Federal Reserve to continue “low riding” interest rates. Inflation will probably cool as well as Federal expenditure growth slows.
So, Streisand’s statement should have said “Joe Biden’s economic record in his first year is the best in 40 years. The media largely ignores this … because the unsustainable Federal stimulus began under Trump, not Biden.”
Another thing The Hill and Barbra Streisand left out was declining REAL average hourly earnings growth (that is, average hourly earnings YoY – inflation).
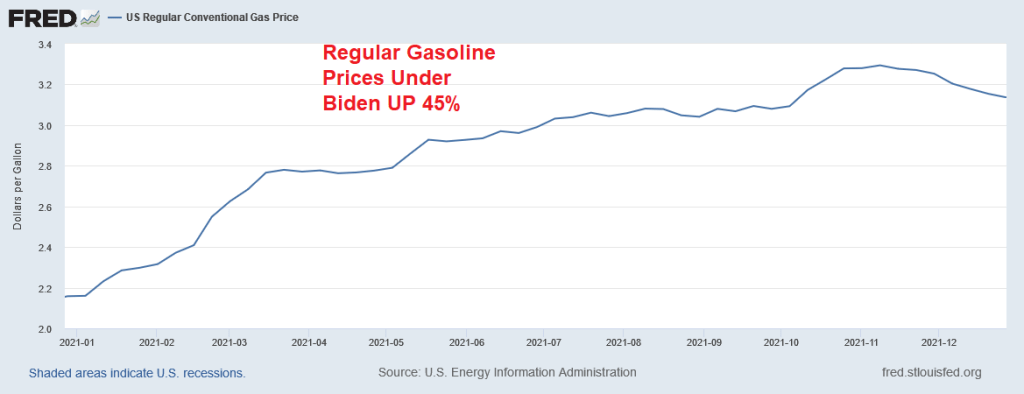
Biden’s real contribution? Anti-fossil fuels actions have driven up energy prices. Regular gasoline prices, for example, are up 45% under Biden.
If The Fed actually follows through and removes COVID stimulus and Congress doesn’t keep the incredible rate Federal spending growing, I sincerely doubt that GDP will continue at this hot pace.


You must be logged in to post a comment.