Wasting Away In Biden/Pelosiville! US Treasury 10Y-2Y Yield Curve INVERTS As Real Average Hourly Earnings Decline -2.678% YoY (30Y Mortgage Rate Rises To 4.90%)

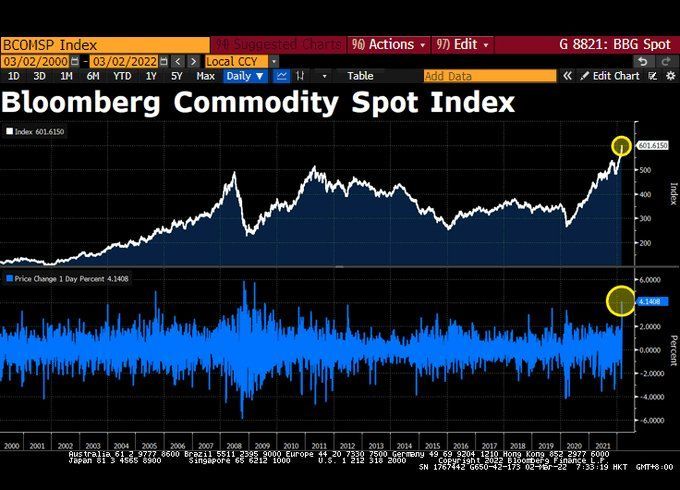
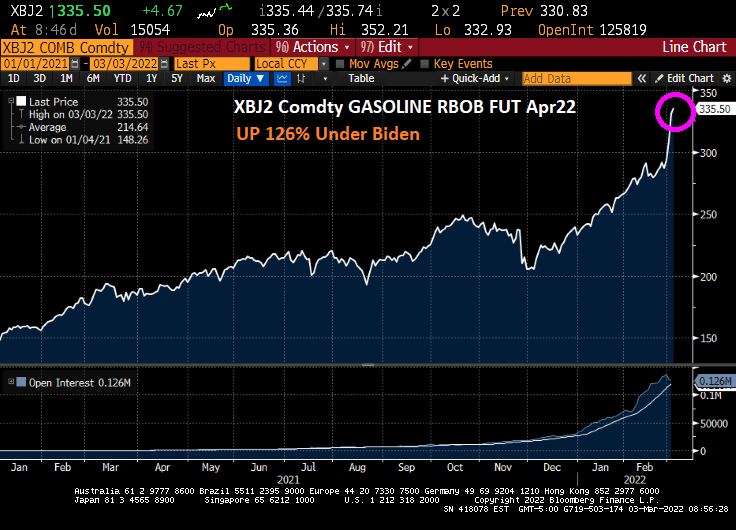
Wasting away again in Biden/Pelosiville, looking for my lost inexpensive gasoline and food. Some people say that Putin is to blame, but we know its Biden/Pelosi’s fault.

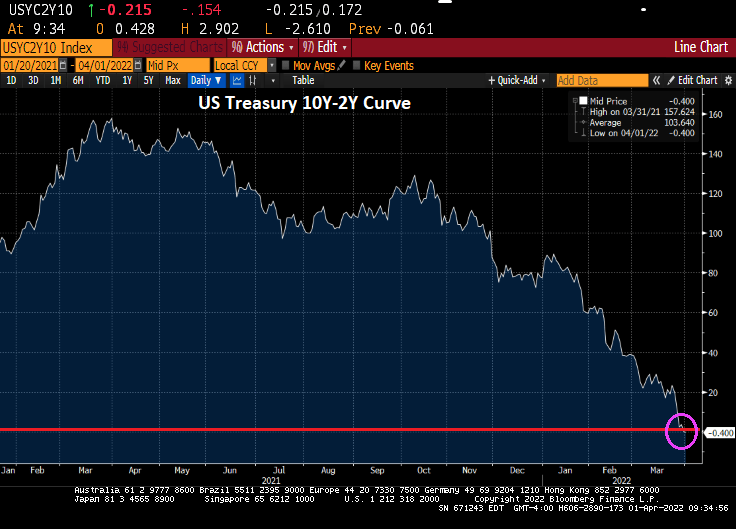
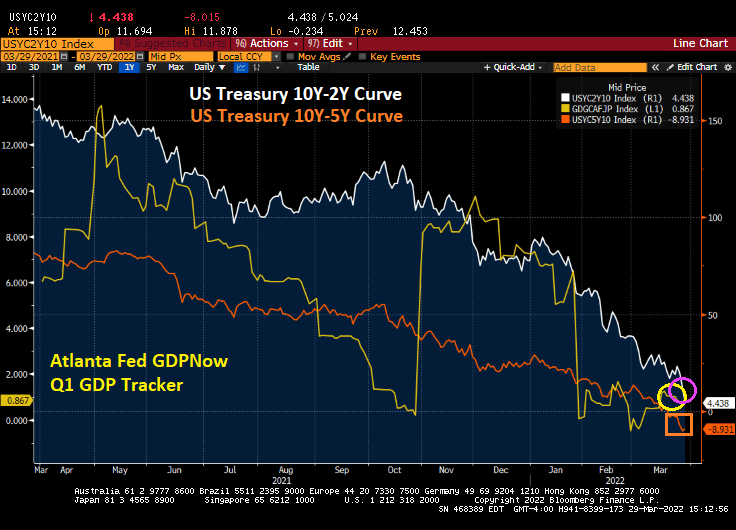
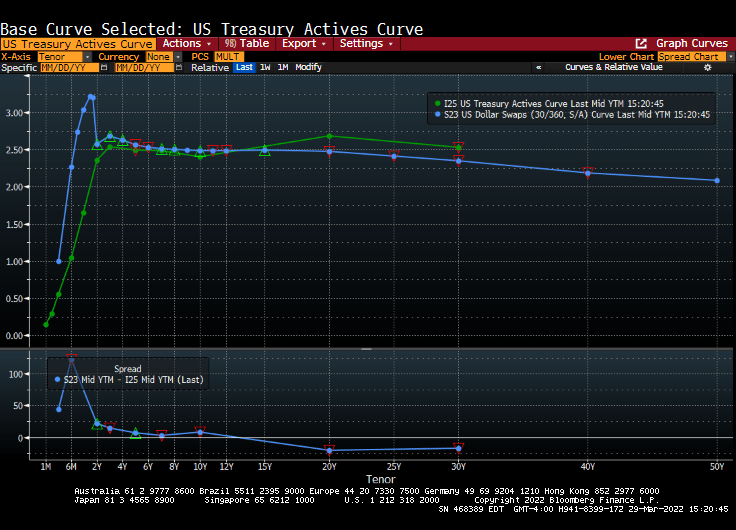
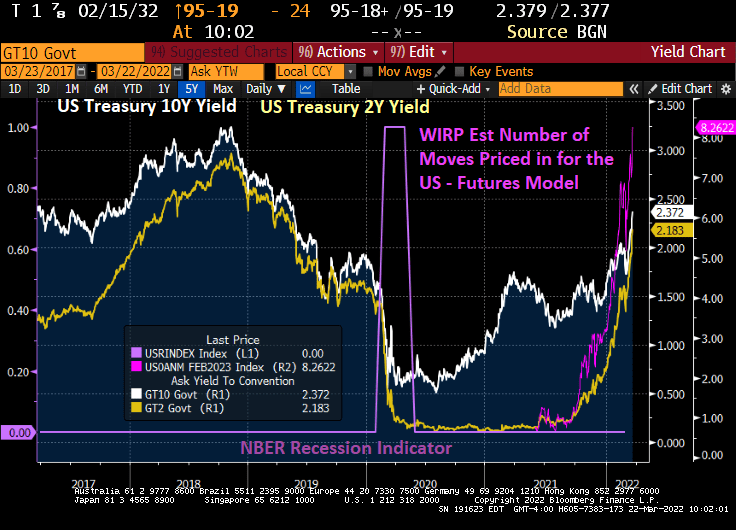
The US Treasury 10Y-2Y yield curve just inverted, generally a precursor to a recession. Called it, nothing but net!

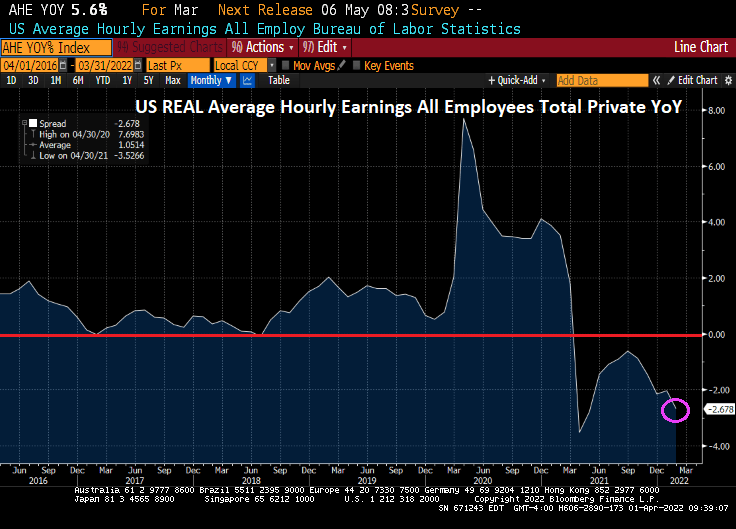
Meanwhile, today’s jobs report shows that Bidenflation is crushing America’s wage growth. While average hourly earnings grew to 5.6% YoY, we are still seeing inflation growing at 7.9% YoY meaning that inflation is reeling hurting the middle class and lower-income households.

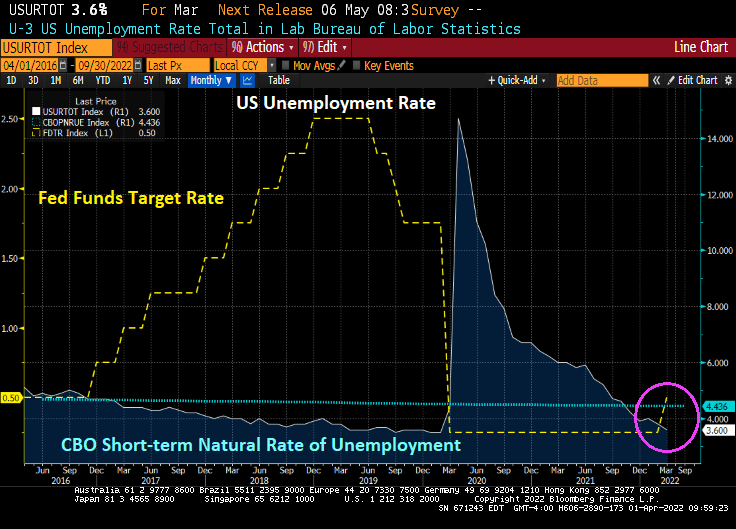
The good news is that the U-3 unemployment rate fell to 3.6%, almost back to the Trump-era unemployment rate of 3.5% prior to the Covid outbreak. And the unemployment rate remains below the CBO’s short-term natural rate of unemployment indicating that the labor market is OVERHEATED.

Today’s jobs report was pretty good, as we would expect from a recovery caused by governments shutting down economies, then reopening them. 431k jobs were added, but less than last month’s jobs added of 678k and less than the forecast 490k.

The number of people NOT in the labor force fell slightly, but it still around 100 million. The number of people holding multiple jobs to overcome Bidenflation rose to 7.5 million.

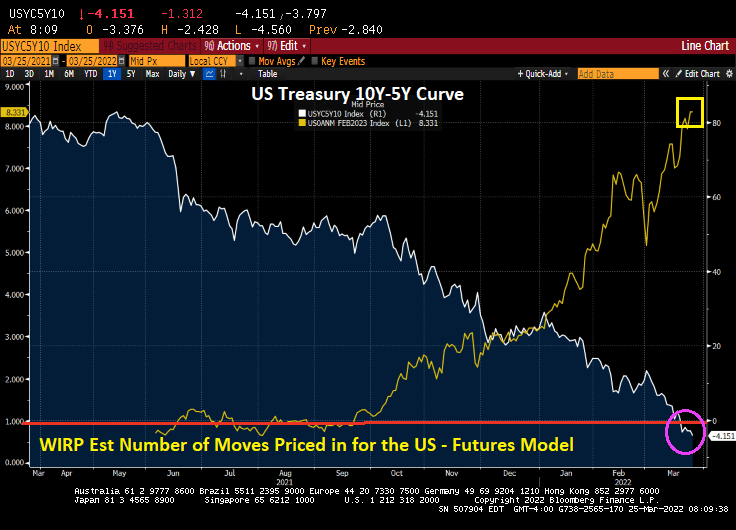
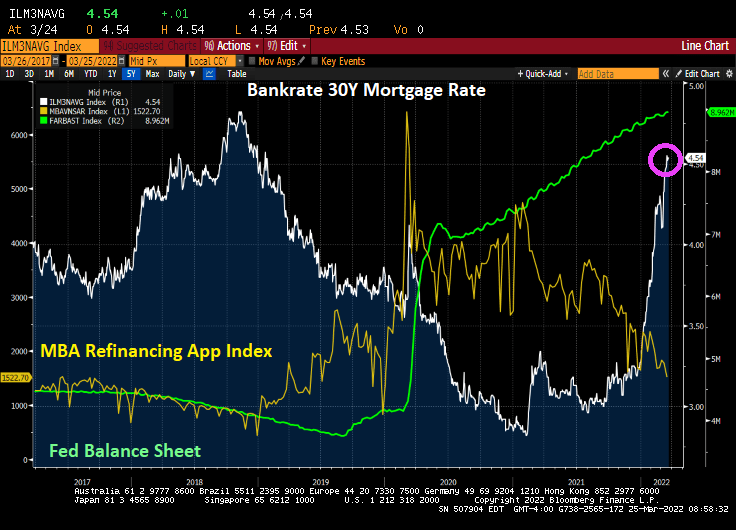
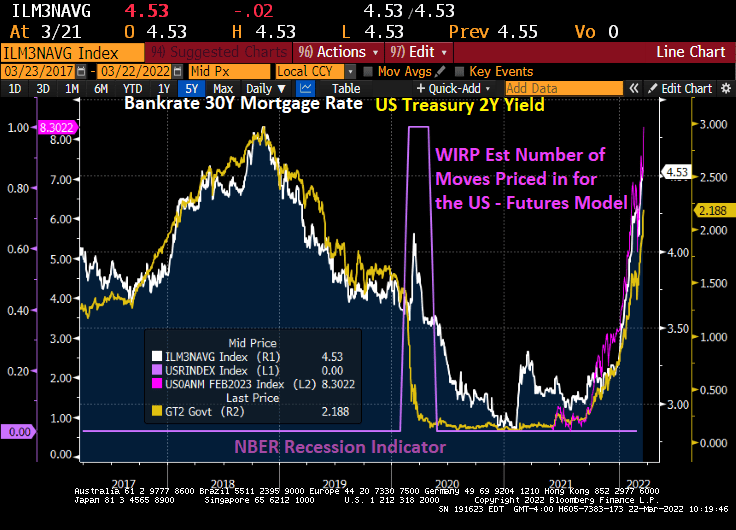
On the mortgage front, Bankrate’s 30-year mortgage rate rose to 4.90% as the 2-year Treasury rate (yellow) rises and the number of expected Fed rate hikes over the coming year is 9.26%.

The Powellenburg Omen! Will Powell Pop The Asset Bubble Created By The Fed’s Repeated Policy Errors? (Blackrock Rises, NVR Homes Gets Crushed)

As of today, Jerome “Nero” Powell and The Gang at The Federal Reserve have not trimmed the Fed’s balance sheet and have only raised their target rate once under President Biden.

Here is the Hindenburg Omen, named for the catastrophic explosion on May 6, 1937 at Lakehurst Naval Air Station in New Jersey. The Hindenburg Omen was flashing red before the stock market correction of late 2007-2009. But, the Hindenburg Omen has flashed red repeatedly since the financial crisis, yet the S&P 500 index has kept rising. The reason? Repeated policy errors by The Fed leaving monetary stimulus in place for too long leading to a bubble forming in the stock market.

The Shiller CAPE (Cyclically-adjust price-earnings) ratio is at the second highest level since the 1800s. The highest point was the infamous Dot.com bubble and bust in 2000/2001.

Since The Fed continues to say “We have a plan!” to slow/shrink The Fed’s balance sheet and raise their target rate … it has not done anything yet (other than a 25 basis point bump at the March meeting).

I am not advocating technical analysis for stocks, but the Bollinger Band analysis for the S&P500 index is showing the S&P 500 index near the top band indicating that a decline in likely.

Today, the US equity market in essentially flat given the massive uncertainty about the Russia/Ukraine situation and whether the US economy is slipping into darkness. But this morning, Federal government blessed companies (healthcare, solar energy and Blackrock) are doing quite well, while homebuider NVR is taking it on the chin thanks to hints that The Fed will raising rates.

Now, NVR (Northern Virginia Homes, Ryan Homes) had explosive earnings growth in their February 1, 2022 report.

But the market is pricing in the crushing Fed rate hikes that are expected.

So, will Foul Powell pull a Volcker and raise rates and crush the economy (and stocks)? Or will Foul Powell And The Fed gang let inflation burn out of control, but preserve the massive asset bubbles?

Derek Zoolander? Inflation Roaring, Fed’s Harker Worries About Inflation … In Private Golf Club Membership Fees (As Q1 Real GDP Sinks To Less Than 1%)

Inflation is roaring along caused by government spending and energy policies, hurting the American middle class and lower-income groups.

Now we see the US Treasury 10Y-2Y flattening towards zero and the10Y-5Y curve slipping deeper into inversion as Q1 GDP growth slows to 0.867.

The US yield and dollar swap curves remain steeply upward sloping, but with the dollar swap curve around 120 basis points high than the Treasury yield at the 6-month tenor.

Various Federal Reserve talking heads are sounding like Derek Zoolander.

“With inflation at a four-decade high, Fed Chair Jerome Powell has set the central bank on course for a series of interest-rate increases this year. He has stressed the toll that price increases are taking on lower-income Americans.” (No duh, Jay!)

“We understand that high inflation imposes significant hardship, especially on those least able to meet the higher costs of essentials like food, housing, and transportation,” Powell said after the Fed’s interest-rate decision this month (of only a 25 basis point increase).

Philadelphia Fed’s Patrick Harker, in a speech Tuesday, said “One of our contacts, for instance, mentioned whopping membership fee increases at his golf club, suggesting this summer may be a good time to play at your local muni instead,” said Harker, a former University of Delaware president and dean of the Wharton School of the University of Pennsylvania.

Perhaps Harker wins the Derek Zoolander award for his remarks on how the rich are impacted by inflation too.

Fire! Case-Shiller National Home Price Growth Accelerates To 19.17% YoY In Spite Of Mortgage Rate Increases (Phoenix, Miami And Tampa Biggest Gainers)

As The Federal Reserves twiddles it thumbs, US housing continues to burn … hot!

The Case-Shiller National home price index (HPI) grew at a 19.17% YoY rate in January despite mortgage rate increases.

Where? Phoenix, Tampa and Miami lead the way with Dallas, San Diego and Las Vegas close behind.

And Fed Chair Jerome “Nero” Powell continues to let housing prices burn red-hot!

By the time I get to Phoenix … home prices will completely unaffordable.

Weekend Update! US 10Y Breakeven Inflation Rate Hits Record High As WTI Oil And Lithium Surge (Toronto Home Goes From $613k Over Asking Price)

Unfortunately, the US Breakeven 10Y inflation rate hit another all-time high as West Texas Intermediate Crude Oil (Cushing Spot) soars.

But note that the WTI Crude spot rate is still lower than it previous peak in June 2008. What is notable in the above chart is that M2 Money growth YoY has slowed after Covid “Stimulypto”. But M2 is still growing at an 11% YoY clip, much faster growth than pre-Covid rates. So, Federal stimulypto is still in place, helping to drive inflation to the moon.

Example of how crazy this is getting? A house in Toronto Canada (our cousins to the north) just went to $613,000 OVER ASKING PRICE! While some may dismiss this as “Well, that is Canada” it does show how inflation is ravaging home affordability in North America.

As The Biden Administration and Congress pushes Green Energy and demonizes fossil fuels, we are seeing Green Energy commodities such as Lithium (for batteries) soar even faster than oil prices.

Gold may be set to party like its 1999!

And just an update on The US Dollar, Crypto Currencies and Gold. This is just a sample of alternatives to the US Dollar for transactions. Freedom of choice is a great thing!

What a wonderful time to be a politician! As Winston Churchill once uttered, “Never let a crisis go to waste.” To quote Dwight Schrute from The Office, “It is part of the green initiative. And by green, I mean money.”

Trouble In Potomac City! US Treasury 10Y-5Y Curve Goes Further Into Inversion As Mortgage Rates Keeps Rising

We’ve got Trouble in Potomac City!

The US Treasury 10Y-5Y curve is going deeper into inversion.

The short end of the Treasury curve is rising, as expected, but declining at the 5 year tenor and beyond.

The aggregate Treasury Index is plunging as Fed Funds Futures signal 8.341 rate hikes over the next year.

Mortgage rates? Climbing as mortgage refinancing applications fall (as expected).

Is The Federal Reserve actually run by The Office’s Michael Scott?

Fed Expected To Raise Rate 8+ Times Over Next 12 Months Leading To Surge In 2-year Treasury Yield And Mortgage Rates (Powell’s Money Gun To Slow Rate Of Fire)

This is the chart from hell as The Fed is expected to take interest rates higher.

At least mortgage rates are down slightly today.

With 8+ rate hikes forecast over the next twelve months. Meaning that Powell’s Fed money gun is going to slow.

Do I Detect A Trend? US Treasury 10Y-5Y Slope Hits Zero (Inversion Imminent) As USD OIS Curve Steepens (Nickel UP 66.25%)

Today’s hawky-dove announcement by The Fed (raises rates by only 25 basis points, but hints that many rate hikes are around the corner.

The US Treasury 10Y-5Y curve has slumped to zero as inflation climbs and the number of rate hikes hits 7. Do I detect a trend?

And then there is the USD Overnight Indexed Swap (OIS) curve. Steep much?

And electric battery metal, nickel, is surging … again. Up 66.25%.

When they made Narcos, Pablo Escobar should have said “Nickel or Lead” instead of “Silver or Lead.”

Weekend Update II: Russian Bonds, Stocks, Ruble And Oil Exports Crash (But Russian 5Y CDS Drops To 554)

Russia is still engaged in its invasion of Ukraine. And the US continues to import crude oil from Russia. In fact, US crude oil imports from Russia soared under Biden only to decline again in December 2021.

On the sovereign bond and currency front, the 5.25% coupon Russian international sovereign bond has crashed to 22.494. And the Ruble/USD cross has crashed as well.

Sberbank Bank 5 1/8% corporate bond has crashed to 25.

The Russian blue-chip stock market (OTOB Russian Traded Index CRTX) has crashed by over 50% since the invasion of Ukraine.

Fortunately, I like Cheerios for breakfast made from oats, since wheat futures are soaring.

Russia’s Credit Default Swap (CDS) 5Y has dropped to a still-elevated 554.

The US really needs to ban Russian crude oil imports, since Biden’s failed in game theory by cutting US energy exploration on Federal lands and offshore drilling.

War is hell, as Vlad “The Ukrainian Impaler” Putin has demonstrated.

Inversion: Russia’s Sovereign Yield Curve Inverts As Technical Default Occurs (Russia’s Foreign Bond Sinks To 21.75) Biden Releases 1 1/2 Days Of Strategic Oil Reserves To Lower Prices

The US still has a steeply upward-sloping yield curve, but Russia has the exact opposite: a steeply downward-sloping or inverted yield curve.

Here is a comparison of the US Treasury Actives curve (steeply-upward sloping) compared to Russia’s sovereign curve (steeply-downward sloping).

Russia’s technical default on international bonds has led to its 5.25% coupon international bond (denominated in Euros) to plunge from 131.6 in September 2022 to only 21.75 this morning.

Commodity prices? Commodity prices saw the biggest one-day gain in 13 years on Tuesday.

Between Biden’s anti-fossil fuel executive orders and the Russian invasion of Ukraine, gasoline futures are up 126% since the start of January 2021.

Biden is tapping the US strategic oil reserves releasing 30 million barrels. Unfortunately, this amounts to only 1 1/2 days of US oil consumption. Instead of “Release the Kraken!”, Biden is releasing a Petit Basset Griffon Vendéen. Woof.

This reminds me of “Does your dog bite?”