Silver Cup? Silver, Money, Debt, And The Decline Of The US Dollar

We got silver?

Tavi Costa at Crescat Capital (founded by my former MBA student at University of Chicago Kevin Smith) produced this excellent chart of silver prices showing the cup and handle of silver prices.

The rise in silver prices corresponds with a deterioration of the US bond market. Look at Treasury futures courtesy of Bravos Research.

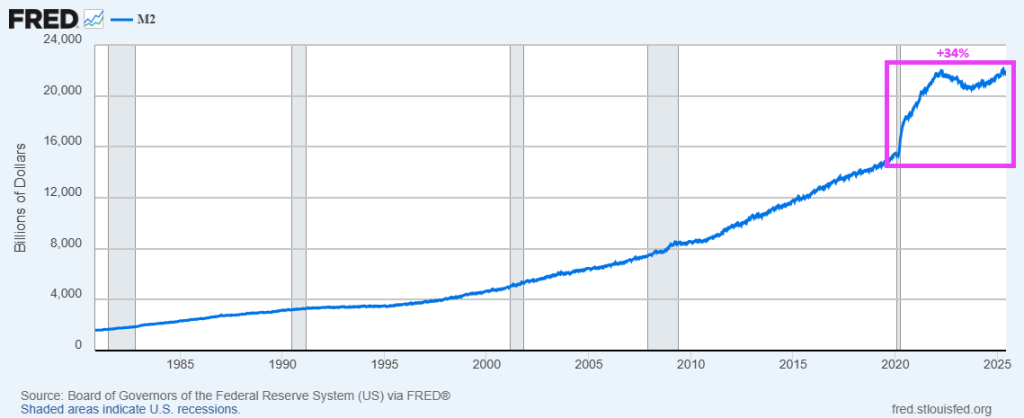
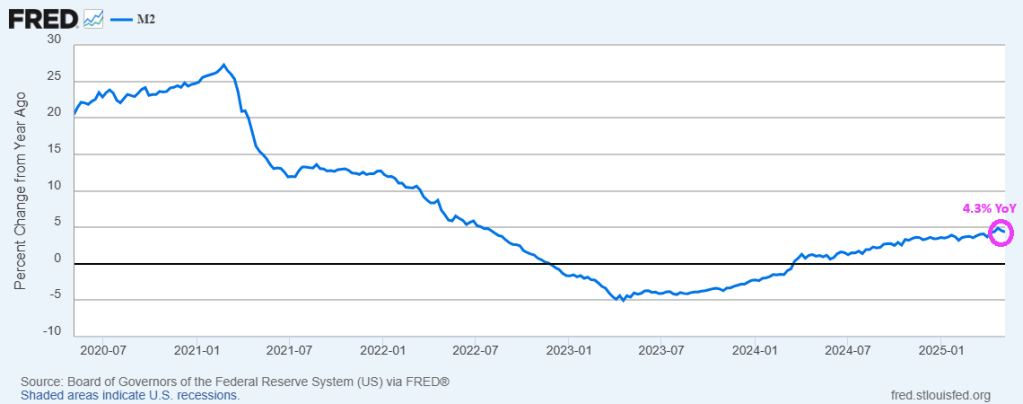
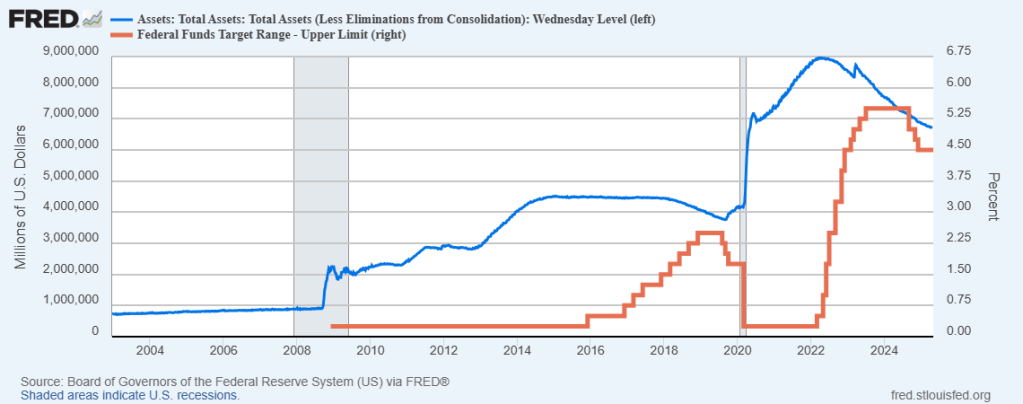
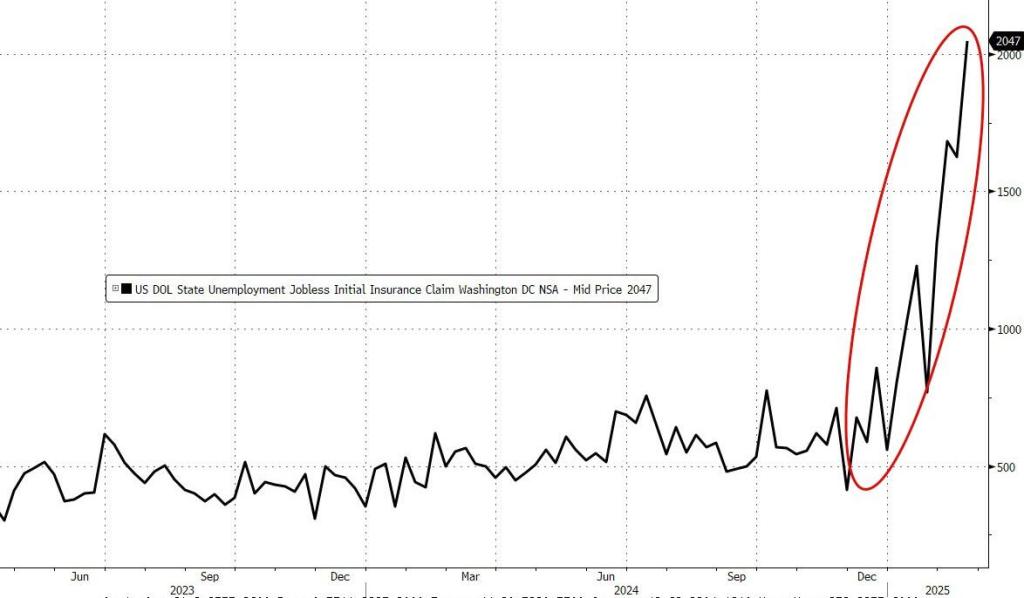
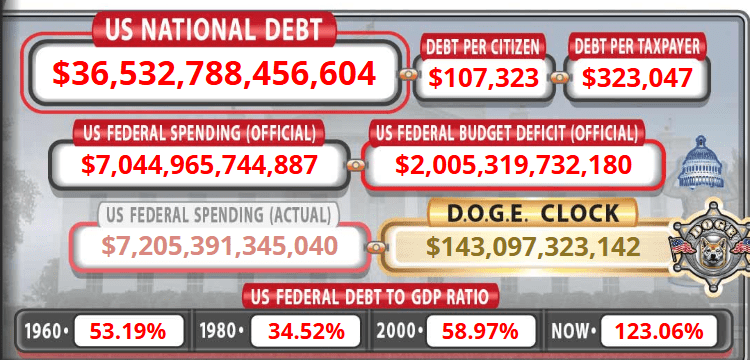
Of course, Washington DC’s insane spending has led to insane money printing by The Feral Reserve.

Everyone in Washington DC deserves a “Silver Cup of Failure” for uncontrolled government waste and spending and mismanagement by The Feral Reserve.

Gov’t Gone Wild! Purchasing Power Of US Dollar Declined 97% Since 1915, US Debt Up 317% Since Jan 2009 (M2 Money Up 210% Since Jan 2009)

It’s Gov’t Gone Wild! That includes The House, Senate, President and Federal Reserve.

The purchasing power of the US Dollar was $1004.4 on 1915-03-01. By 2025-05-01, the purchasing power fell to $31.1, a loss of 97%. Public debt since the last year of GW Bush, Obama/Biden (with a brief hiatus with Trump) rose 317% since January 2009.

M2 Money printing grew 210% since January 2009.

The music??

Bits And Pieces? US Household Net Worth Fell By -0.93% In Q1 2025 As Bitcoin Falls Below 100k

The housing markets is in bits and pieces following The Fed’s fickle management of interest rates and Biden’s disastrous spending policies. U.S. household net worth fell by 0.93% in 1Q2025 … largest decline since 3Q2022, but not necessarily comparable to that quarter in terms of magnitude.

Bitcoin just broke below $100k.

What will The Fed? As I have said over and over again, The Fed needs to cut rates.

Those Were The Days? Atlanta Fed GDP Q2 Now At 3.8% (Fed Rate Cut Looks Unlikely)

The dismal days of Biden/Harris/Yellen are gone. Although Chuck Schumer, Nancy Pelosi, Hakeem Jeffries and my in-laws are all singing “Those Were The Days.” Of immense government corruption and waste.

The GDPNow model estimate for real GDP growth (seasonally adjusted annual rate) in the second quarter of 2025 is 3.8 percent on June 5, down from 4.6 percent on June 2. After recent releases from the US Census Bureau, the US Bureau of Economic Analysis, and the Institute for Supply Management, the nowcasts of second-quarter real personal consumption expenditures growth and real gross private domestic investment growth decreased from 4.0 percent and 0.5 percent, respectively, to 2.6 percent and -2.2 percent, while the nowcast of the contribution of net exports to annualized second-quarter real GDP growth increased from 1.36 percentage points to 2.01 percentage points.

Here is the breakdown.

The Fed still needs to lower rates by 100 basis points, but that looks unlikely.

Core PCE Fell In April To Lowest Since April 2021, +2.5% YoY (Fed M2 Money Printing UP 4.3% YoY)

The Fed’s favorite inflation indicator – Core PCE – fell once again in April to its lowest since April 2021 at +2.5% YoY.

And The Fed keeps on printing money!

Supercore inflation is down to -0.023 MoM.

The Fed is thinking that they can help.

US Wealth Gap (Top 1% Versus Bottom 50%) Remains Daunting (Trump Urges Fed Chair Powell To Cut Rates)

Republicans are trying to lock in Trump’s tax cuts and Democrats are resisting. We now know that DOGE is trying to end the wasteful spending in DC. But I would really like to see tax rates on the middle class fall.

The wealth gap between the top 1% of taxpayers and the bottom 50% of taxpayers is enormous. And has gotten worse since 1990.

Meanwhile. to fight off the temporary effects of the tariff war, Trump is urging Fed Chair Powell to cut rates.

Powell will likely NOT cut rates. But what does “Lunatic Liz” Warren say about rate cuts??

Fear! Tariff Fears Are Spooking Markets (China Is Acting Childish)

Markets are ranked by fear about tariffs. Particularly since China is acting like a child.

Bond vs equity fear

Bond volatility has shot up higher, but remains “muted” compared to the VIX move.

Source: Refinitiv

FX vs equity fear

FX volatility has shot up higher as well, but is pale in comparison to the VIX move.

Source: Refinitiv

Credit “crunched”

Credit protection has surged during the “chaos”. Chart shows the US and the European versions.

Source: Refinitiv

Equity vs credit protection

VIX vs CDX IG.

Source: Refinitiv

Europe as well

V2X vs iTraxx main.

Source: Refinitiv

Correlation – the upside crash

Implied correlations showing a lot of “fear” as pretty much everything has been treated as if it were the “same” during the crash.

Source: Refinitiv

Massive

Intraday range was huge during yesterday’s session, but close to close very modest. Imagine trading short gamma….and hedging the extremes.

Source: GS

The Yuan is having a volatile day.

Fear!

DOGE Donkeys? Initial Jobless Claims SOAR In Washington DC, Over 2 Million, As “The Borg King” (Elon Musk) Takes Control (DOGE Has Saved Taxpayers Over $143 BILLION So Far)

Elon Musk, who Democrats consider to be The Borg King, and DOGE have laid-off many Federal workers. Today’s jobless claims report revealed that over 2 million Federal workers filed for unemployment benefits.

DOGE has saved taxpayers over $143 BILLION thus far.

How Democrats view Elon Musk.