Bond Market Set to Test Powell Push to Delink Hikes From Taper (As FANG+ Stocks SOAR With Fed Asset Purchases And ADP Added Only 374k Jobs In August)

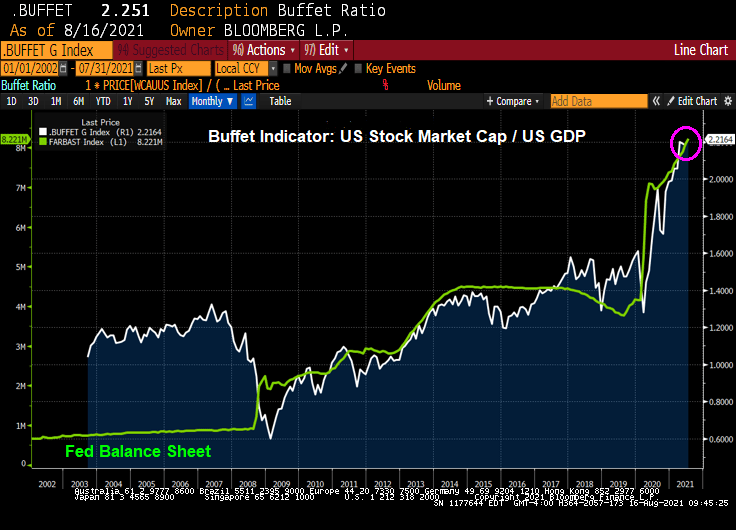
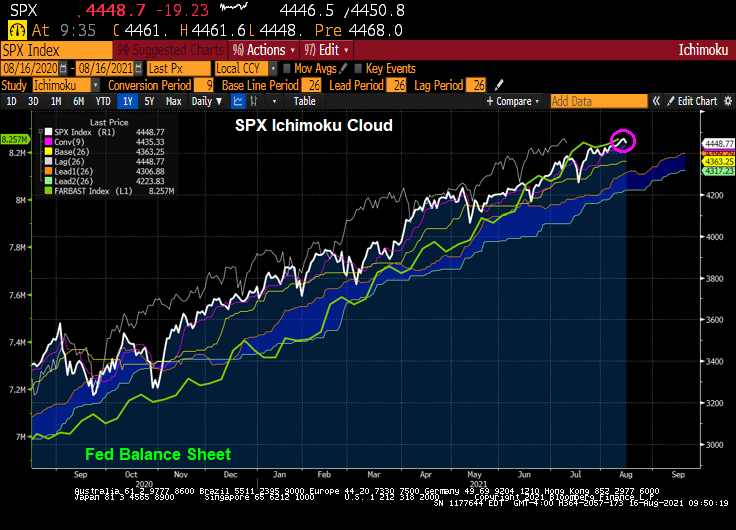
Since the original model of The Federal Reserve was to purchase Treasuries and Agency MBS in an effort to push down interest rates, it will be quite difficult to delink the two: taper the balance sheet while not raising short-term rates.

(Bloomberg) — Bond investors may not wait long to start pushing back against Federal Reserve Chair Jerome Powell’s efforts to delink the start of asset-purchase tapering from the countdown to eventual policy-rate hikes.

Since Powell last week said the central bank could begin reducing its monthly bond buying this year, traders have stuck with early 2023 as the likely timing for the Fed’s liftoff from zero interest rates, and Treasury yields have barely budged.

But that calm faces a test starting Friday. The potential for volatility comes from the fact that when Fed officials gather this month, they will release fresh projections for the fed funds rate for the next few years. And with the labor market pivotal for Fed policy now, Friday’s August jobs report is seen as laying the foundation for these forecasts — collectively known as the dot plot — especially as some Fed officials have already been pushing for an early taper.

The upshot is that a robust reading Friday could have investors pulling forward tightening bets regardless of Powell’s efforts last week in his virtual speech at the Fed’s Jackson Hole symposium. The risk is traders will prepare for a repeat of June, when a hawkish signal via the dot-plot took markets by surprise and triggered an abrupt unwinding of wagers on a steeper yield curve. 

If the employment report is “even deemed acceptable, regional presidents will be back on the tape in a flash,” sounding hawkish again, said Jim Vogel, an analyst at FHN Financial. “And you may have more officials penciling in a 2022 hike. And that would have to flatten the yield curve.”

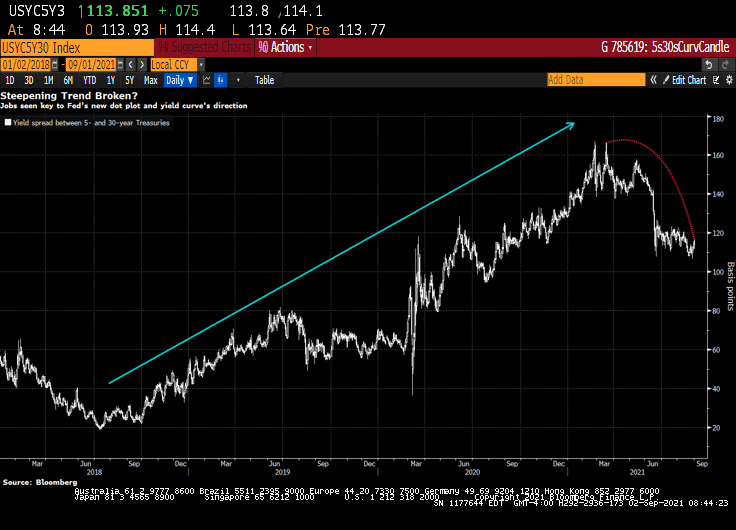
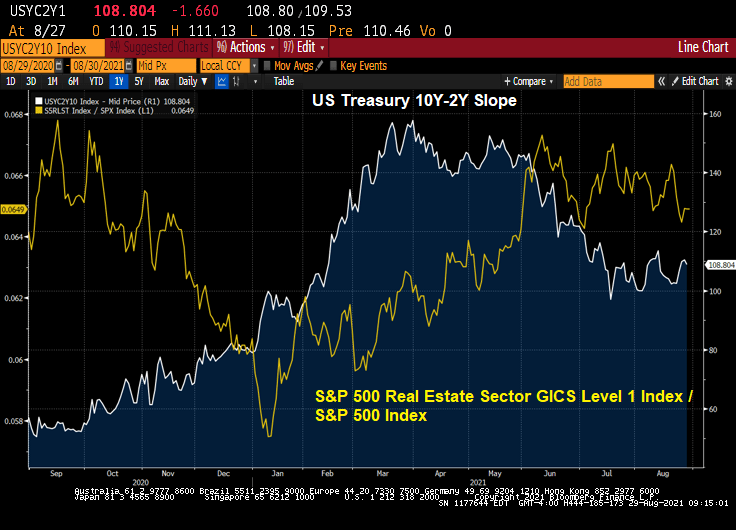
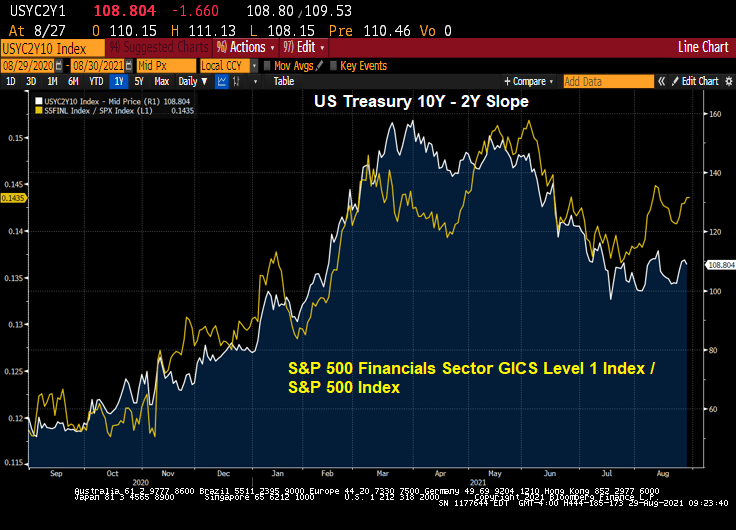
Expectations for a hawkish shift would lift 5-year Treasury yields in particular, shrinking the gap with 30-year rates, Vogel said. That spread was around 114 basis points Wednesday, down from about 140 just before the Fed met in mid-June. 

Dots Math

Officials’ June quarterly forecasts not only showed a median funds rate projection of two hikes in 2023 — after the March dot plot indicated no tightening until at least 2024 — but that seven participants saw at least one increase next year. This time around, it will take just three officials to raise their dots for 2022 for a full hike to be the new median for next year, assuming everyone else keeps their projections where they were.

Traders responded to the Fed’s June rate projections by driving 5-year yields up the most in almost four months. That was even as Powell said in his press conference that the dot plot should be taken with a “big grain of salt” and discussion about raising rates would be “highly premature.”

Powell last week said “the timing and pace of the coming reduction in asset purchases will not be intended to carry a direct signal regarding the timing of interest rate liftoff, for which we have articulated a different and substantially more stringent test.”

But the leadup to the Fed decision on Sept. 22 may culminate in a dot-plot unveiling that yet again presents a communication challenge for policy makers, as has been seen several times since the Fed introduced the projections in 2012.

“There’s information in the dots, and generally it’s good information,” said Shahid Ladha, head of Group-of-10 rates strategy for the Americas at BNP Paribas SA. It makes sense for the Fed, regarding tapering and rate hikes, “to try to separate them, but I don’t think they’ll be ultimately successful in separating them.”

Trouble Ahead

Even some Fed officials are wary of being able to disentangle the tapering from rate hikes, minutes from the July Fed meeting showed.

Kevin Flanagan, head of fixed-income strategy at WisdomTree Investments Inc., which runs exchange-traded funds with assets of $75 billion, sees trouble for the Fed. 

His view is that the labor market will keep gaining ground in its rebound from the pandemic, and that the median September dot may show a hike in 2022. That bodes for higher yields, a flatter curve and makes floating-rate notes appealing, he said.

The median of economists’ projection is for a gain of 725,000 jobs in August, a slowdown from June and July but well above the average for 2021. Of course, with millions still out of work relative to pre-pandemic levels, the Fed may prove to take longer to lift rates than traders expect, especially given the central bank’s “broad and inclusive” maximum-employment goal. But the market may be about to challenge that approach.

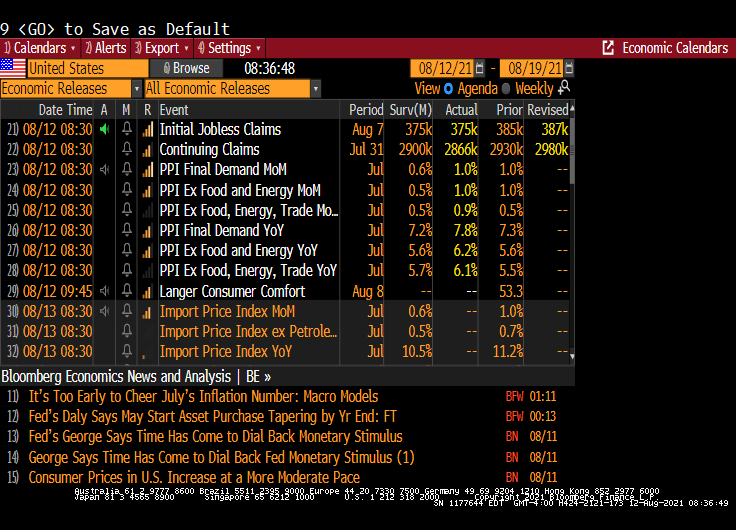
Note: Yesterday’s ADP jobs gain was forecast to be 625k jobs added in August, but only 374k jobs were actually added.

Fed Faces ‘Ugly Fight’ Over Jobs Goal in Next Big Policy Debate

“We are going to be all of a sudden talking about rate hikes potentially next year, and that is where the focus of the bond market is going to go,” Flanagan said. “The dot plot will be the Fed’s initial message for its forward guidance on rates. And then it will begin to come from Fedspeak — which is when the rubber will really meet the road.” 

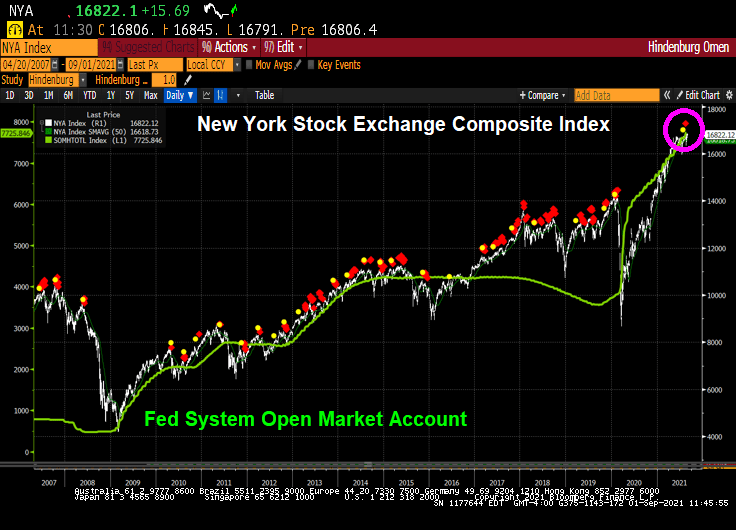
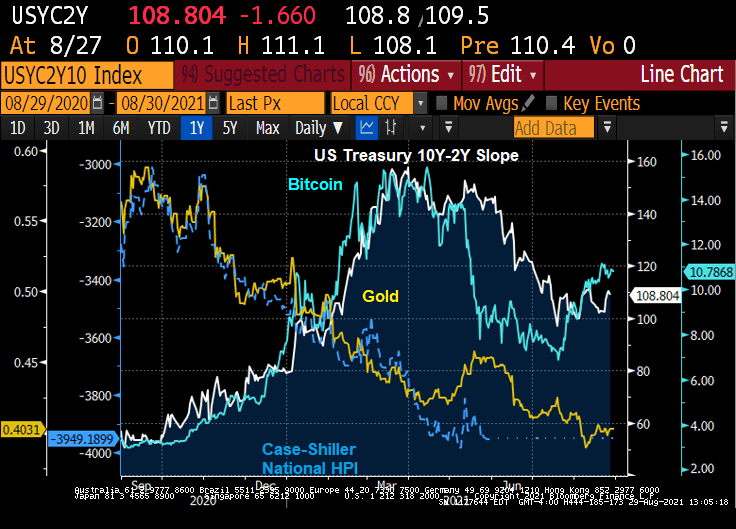
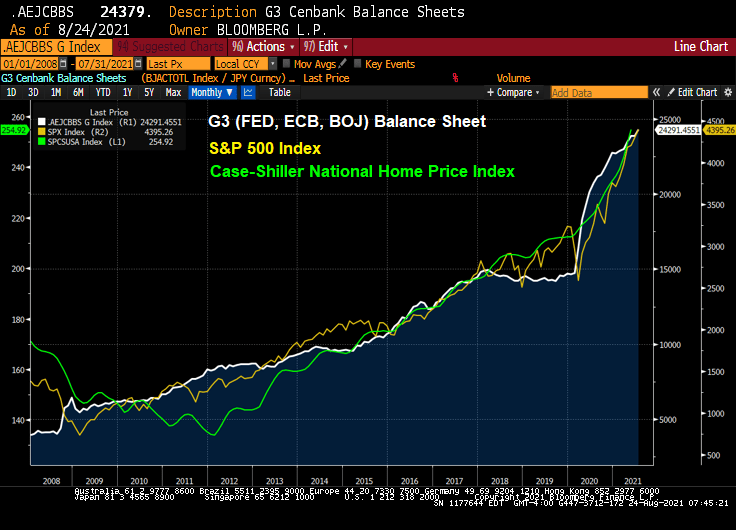
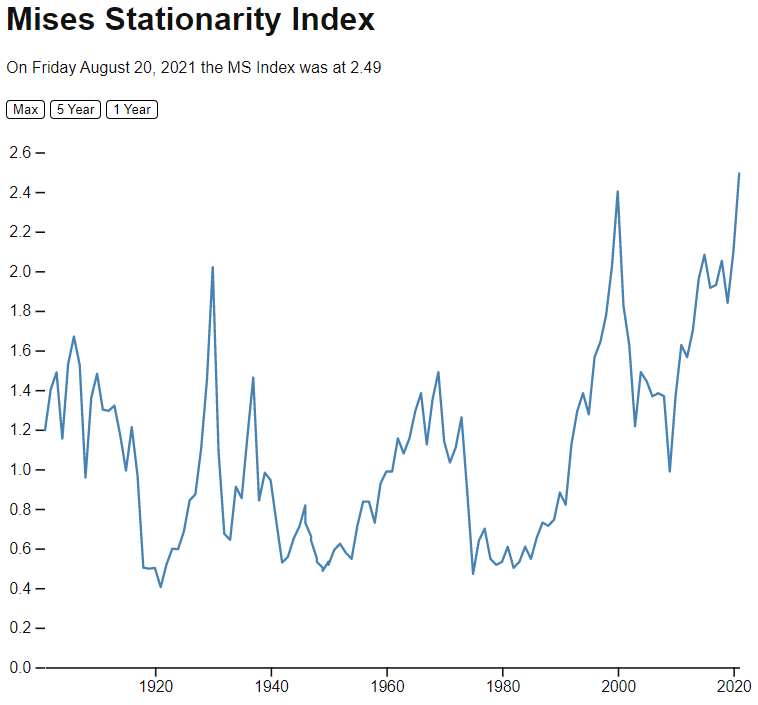
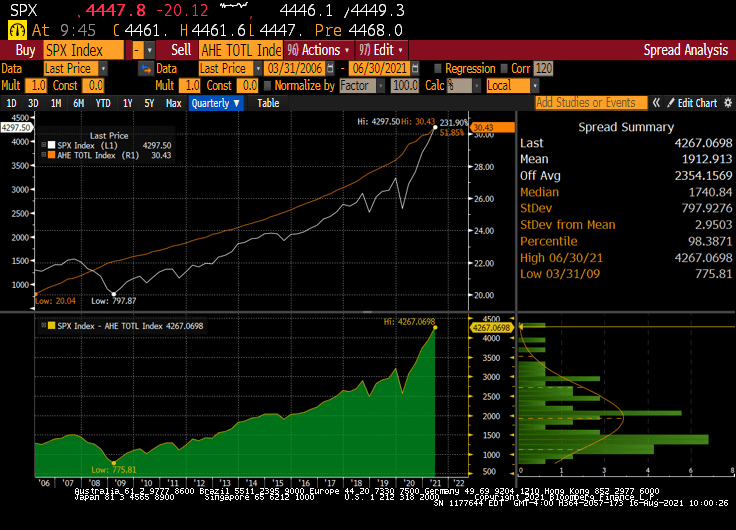
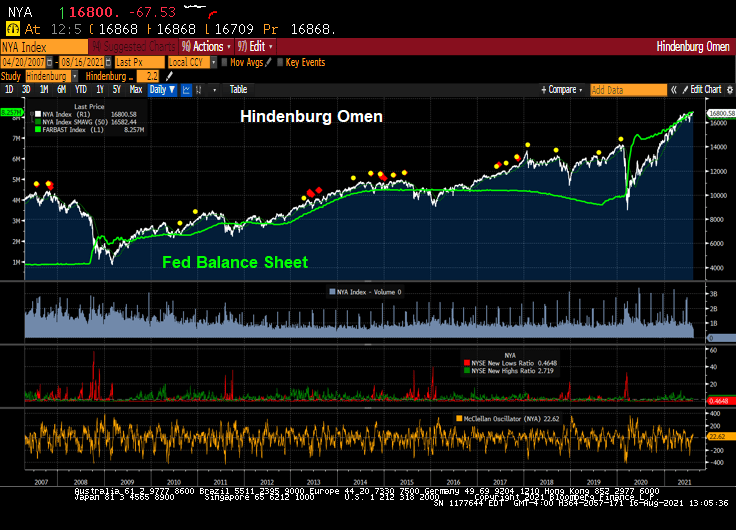
And with the stock market, particularly technology stocks, rising with Fed asset purchases, I wonder if The Fed forecasts that assets prices will keep going if they withdraw the punch bowl?

Let’s see if Powell and The Gang can forecast the stock market if they taper the balance sheet and raise rates.

The Powellenburg Omen Is Flashing … Again (ECB Balance Sheet Is 79.62% Of European Union GDP)

Well, the US stock market is raging along with Federal Reserve monetary stimulus, Federal government fiscal stimulus and a roaring economy.

A note of caution: the Hindenburg Omen chart is flashing … again. It forecast the stock market crash of 2008, but growing monetary stimulus from The Federal Reserve (green line) has helped prevent another correction.

The Shiller CAPE ratio is signalling a correction just like the Hindenburg Omen.

But Fed Chair Powell and Treasury Secretary Yellen along with our free-spending Congress and Administration have nothing on Europe where the ECB’s balance sheet is a whopping 79.51% of European Union GDP! The Fed’s balance sheet is “only” 36.66% of US GDP.

Here is the SS Powellenburg cruising over Wall Street.

Fed’s Snakejuice And Winners/Losers From T-Curve Flatterning (Winners: Real Estate, Financials, Information Tech, Losers: Industrials, Retail, Metals And Mining)

At the annual Jackson Hole (aka, J-Hole) Economic Symposium, Federal Reserve Chairman Jerome Powell reiterated that the Fed is in no hurry to either taper asset purchases immediately or aggressively. Additionally he made crystal clear that even when the Fed does eventually start tapering asset purchases (likely November or December), it should not be taken as signaling interest rate hikes will follow on some preset course. Indeed, Fed Chairman Powell continues to claim that inflation is transitory. Finally, he said that part of the mandate (employment) is still far from being achieved. So, expect more SNAKE JUICE.

The shape of the yield curve has been highly influential recently in relative performance trends between various areas of the market. From last summer through May of this year, the steepening of the yield curve coincided with healthy outperformance of cyclical stocks. Since May, the flattening of the curve has coincided with more defensive (or at least high quality) leadership out of the tech and health care sectors. The logic goes, therefore, that a re-steepening of the curve should coincide with a shift back to cyclicals. Indeed, that shift may be in the early innings.

Let’s take a look at the US Treasury 10Y-2Y curve slope over the past twelve months against the Citi Economic Surprise Index for the US. You can see curve fatigue starting in April 2021 as the Citi Economic Surprise Index turns negative.

The the more cyclical and smaller skewed S&P 500 equal weight index has started to outperform the S&P 500 again, right on queue with the yield curve re-steepening.

Industrial stocks are under-performing the broader S&P 500 index as the curve flattens.

Real estate stocks? They are outperforming the broader S&P 500 index.

Mining stocks like gold mines? They are underperforming the broader S&P 500 index.

Financial stocks? Not surprisingly, The Fed’s dovish behavior is causing financial stocks to outperform the broader S&P index.

Likewise, information technology stocks are outperforming the broader S&P 500 index.

So, by Powell delaying any balance sheet slowdown and rate increases, we have clear winners (real estate, financials, information tech) and clear losers on a relative basis (industrials, retail, metals and mining).

Pure snake juice.

The Others! Due to volatility differences, I wouldn’t over-interpret this chart. But Bitcoin as a ratio of the S&P 500 index is “kicking ass!” Gold and housing as a ratio of the S&P 500 index seemingly can’t keep up with the S&P 500 index.

The Jackson Hole Omen: What Will Powell Announce At Fed Conference? (Can Overstimulated Market Survive Without ZIRP/QE?)

The financial markets are overstimulated like a cranky child after too much sugar (aka, sugar rush). So what will happen to overstimulated markets if Fed Chair Powell announces withdrawal of monetary stimulus?

The famous Hindenburg Omen is already flashing WARNING ahead of this week’s Fed meeting at Jackson Hole. Will Powell take the punch bowl away?

The Shiller CAPE ratio is at a high since the financial crisis and stock market correction in 2008 and early 2009.

I would expect Powell to walk softly since he has the opportunity to terrify financial markets. But I expect Powell will announce a small adjustment to the growth of The Fed’s balance sheet in line with The Fed’s DOTS project signalling interest rate increases in the futures.

Throw Covid, a slowing China and Europe into the mix, and Powell and the gang had better think long and hard about they are going to withdraw the record monetary stimulus from the cranky financial markets.

Meanwhile I hope that have a few beers from Bond’s Brewing Company, the best beer in Laramie, Wyoming!!

Fed’s Ability to Set Rates Floor Is Weakening on Cash Deluge (“Charming” Powell Had At Least 350 Meetings, Dinners Or Phone Calls With Members Of Congress)

Powell and The Fed’s policies have veered from their mandate requiring Chairman Powell to meet 350 times with Congress to sell The Fed’s policies.

Bloomberg) — The Federal Reserve’s floor for overnight funding markets is proving to be no match for the deluge of cash. 

Money-market securities ranging from Treasury bills to repurchase agreements continue to trade below 0.05% — the offering rate on the overnight reverse repo facility, which is supposed to act like a floor for the front end. The Fed at its June meeting had raised the rate by five basis points to help support the smooth functioning of short-term funding markets.

Still, usage of the tool climbed to a record $1.136 trillion on Monday, eclipsing the previous high of $1.116 trillion on Aug. 18. 

Demand for the so-called RRP facility has surged as a flood of dollars threatens to overwhelm funding markets. That’s in part a result of the central bank’s long-standing asset purchases and drawdowns of the Treasury’s cash account, which is pushing reserves into the system. As a result, liquidity has been swelling, especially as the Treasury cuts supply to create more borrowing room under the debt ceiling.

The pressure pushing down overnight rates toward zero is proving a major headache for money-market funds. It hampers their ability to invest profitably, and can lead to further disruptions as they begin to waive fees to avoid passing on negative rates to shareholders. A number of firms including Vanguard Group shut down prime money-market funds last year after struggling to cover operating costs in the low-interest-rate environment.

Yes, overnight rates such as the US SOFR rate, are near zero.

Powell’s Charm Offensive in Congress Positions Him to Keep Job

Perhaps that is why Federal Reserve Chair Jerome Powell is acting as a lobbyist with Congress for The Fed’s nontraditional approach to monetary policy.

(Bloomberg) Since he took the helm of the Fed in February 2018, through June of this year, he’s held at least 350 meetings, dinners or phone calls with members of Congress, according to his monthly calendars. That’s almost nine per month, and many of those included more than one lawmaker. The tally doesn’t count at least 16 appearances as chair before numerous congressional committees.

Well, the stock market has zoomed-up since Bernanke and The Fed adopted zero-interest rate (ZIRP) policies and the now famous quantitative easing (QE) policies in late 2008.

Congress member Alexandria Ocasio-Cortez asked Fed Chair Powell about the Fed helping with US unemployment. We are already at zero rates (on the short-end), and Congress should look at their policies on why labor force participation is slow to recover from the Covid epidemic.

Powell is sounding more and more like Parks and Recreation’s Tom Haverford in terms of schmoozing Congress for support.

Update: The Mises Stationarity Index is flashing “BUBBLE.”

The Mises Stationarity Index is different than the Shiller CAPE index, which is showing equities as being overpriced, but not yet in dot.com bubble zone.

Fed’s $168.2 Trillion Nightmare That Powell Ignored In Written Testimony Before Senate Banking Committee (Bank Staggering Derivative Exposure)

Yes, Fed Chair Powell gave written testimony before the US Senate Banking Committee. He left out one important bit of information: US banks have $168.2 TRILLION in derivative exposure.

It could be that Chairman Powell had other things on his mind, like reverse repos over $1 trillion and a $8.26 trillion balance sheet.

S&P 500 Bubble Views: Buffett Indicator, Shiller CAPE, Ichimoku, Bollinger, Gold To SPX, SPX Versus Average Hourly Earnings (All Roads Point To Bubble)

There are a variety of measures of an asset bubble. And each one points to an unsustainable bubble in the stock market.

Let’s start with the Buffett Indicator. The ratio of Total Market Capitalization of all US stocks (WCAUUS ) to total nominal GDP of the United States (GDP CUR$ ).

There is also the GLOBAL Buffett ratio produced by Holger Zschäpitz. Global market cap now equal to 139% of global GDP, way above Buffett’s 100% bubble threshold.

Shiller’s Cyclically-adjusted Price-earnings ratio? Still climbing and resembles the Dot.com bubble of 2000.

How about gold to Average Hourly Earnings (similar to the Bichler and Nitzan “Power” measure. The spread (bottom chart) sees the S&P 500 index soaring away from average hourly earnings.

We also have the Gold to SPX ratio that is now back to pre-financial crisis levels.

How about the Ichimoku cloud, where the SPX is currently ABOVE the cloud?

SPX and Bollinger Bands? The SPX index is close to the upper band.

How about The Hindenburg Omen, a technical indicator that was designed to signal the increased probability of a stock market crash. It compares the percentage of new 52-week highs and new 52-week lows in stock prices to a predetermined reference percentage that is supposed to predict the increasing likelihood of a market crash.

So it looks like a have a bubble in the stock market.

Fed Chair Jerome Powell sees the ghost of the Dot.com bubble.

Inflation Alert! US Producer Prices Come In Hotter Than Expected (+7.8% YoY), Annualized Run Rate Is 12%!

Well, economists were expecting a 7.2% YoY print of the Producer Price Index – Final Demand. But July’s print came in hot … at +7.8% YoY. Compare that with the Core Consumer Price Index YoY of +4.3%.

The month-over-month PPI Final Demand is showing a run rate of 12%! (1% in July x 12 months).

Alarm! Gold And Cryptos Rise As Covid Spreads (Again)

The Covid Delta Variant seems to be picking up steam, we are seeing “flight to safety” assets other than Treasuries rising.

Gold and Silver experienced some serious corrections last week, perhaps because things were looking up. Then we saw Anthony Fauci scaring everyone about Covid … again. So, there is enormous uncertainty about how this will play out. In other words, ALARM!

Bitcoin and Ethereum have been climbing since Gold and Silver corrected last week. But both are up this week, particularly Gold.

The US Dollar is down slightly since the same time last year and M2 Money Stock growth has slowed.

Here is a chart showing another fear factor: the rise of the Covid Delta Variant. Deaths are only 1.7% of confirmed cases (if we believe the actual cause of death).