Now you know why Trump is so eager to cut wasteful spending! The real mystery is why Democrats and RINOs are so determined to continue wasteful spending and not cut taxes.
Trump inherited a fiscal disaster from Biden and Congress. Not to mention The Federal Reserve. Credit default swaps (CDS) for the USA are near Greece (and China) levels.
Since Covid struck in 2020, US debt is up a staggering 56%!
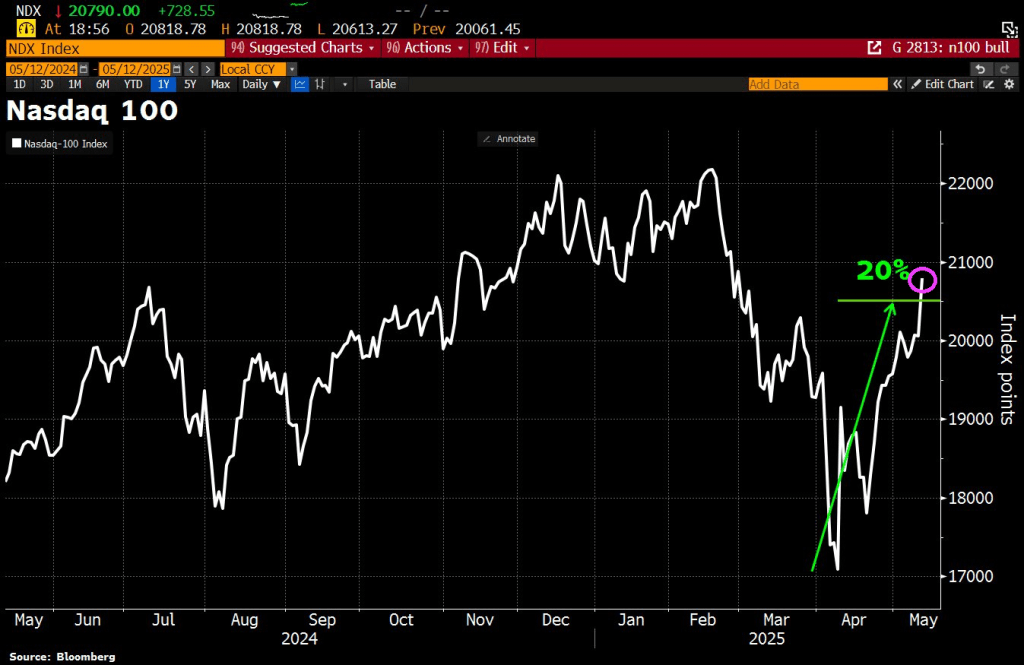
Well, U.S. and China reached an agreement to lower tariffs in a 90-day cool-off period. Despite China claiming they would NEVER agree to tariffs! The result? The NASDAQ 100 rose to its highest level since mid-February.
The Fed can help, but won’t. We are still struggling to recover from Biden’s cockeyed management of the economy,
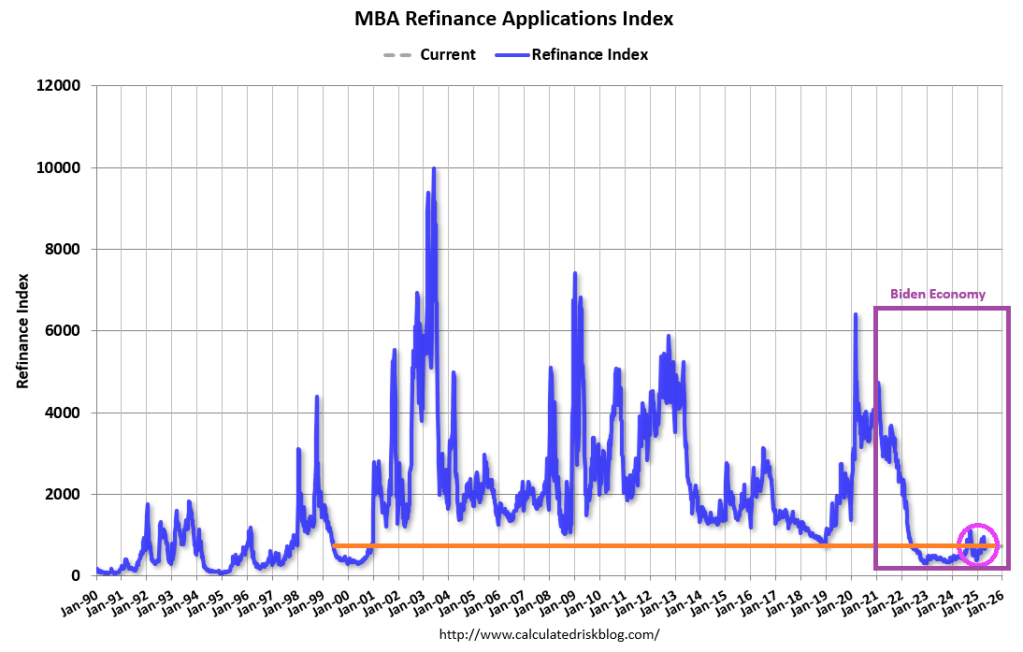
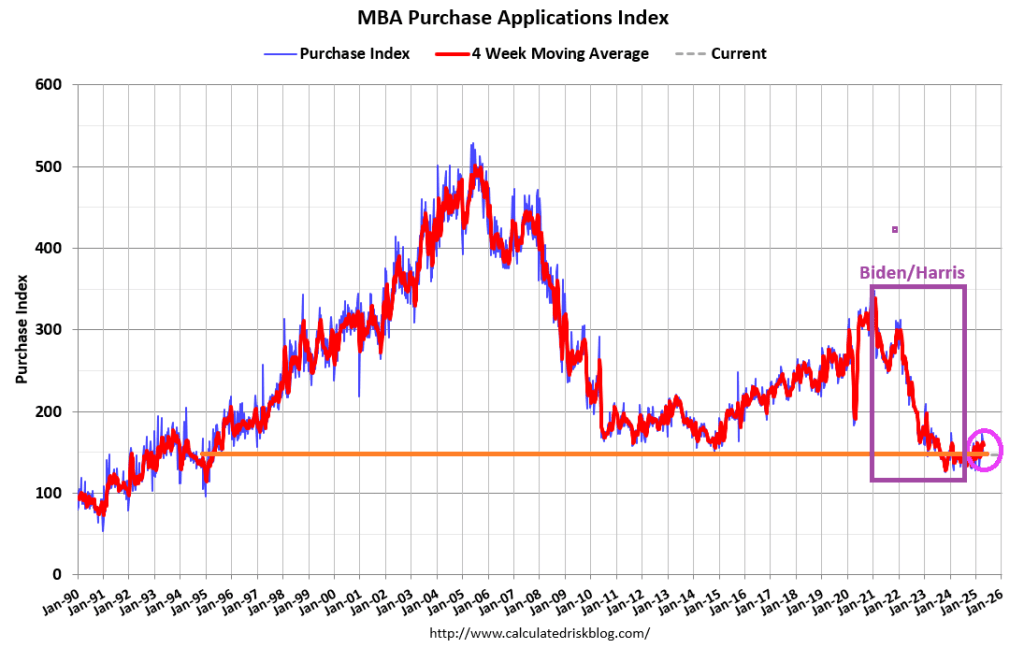
Mortgage applications increased 11.0 percent from one week earlier, according to data from the Mortgage Bankers Association’s (MBA) Weekly Mortgage Applications Survey for the week ending May 2, 2025.
The Market Composite Index, a measure of mortgage loan application volume, increased 11.0 percent on a seasonally adjusted basis from one week earlier. On an unadjusted basis, the Index increased 12 percent compared with the previous week. The seasonally adjusted Purchase Index increased 11 percent from one week earlier. The unadjusted Purchase Index increased 12 percent compared with the previous week and was 13 percent higher than the same week one year ago.
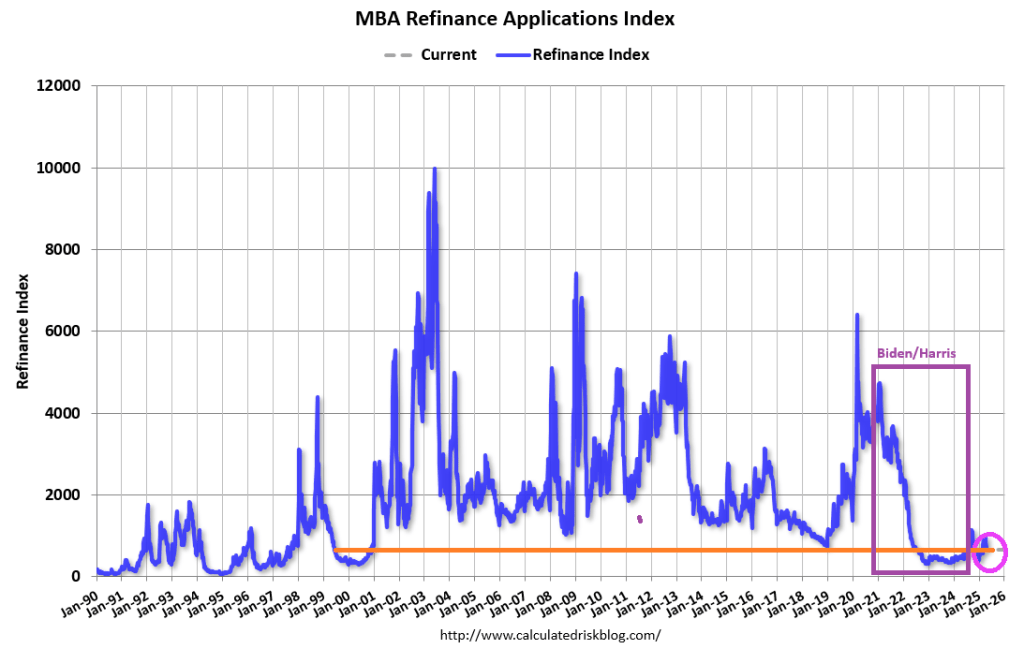
The Refinance Index increased 11 percent from the previous week and was 51 percent higher than the same week one year ago.
The economic news last week included a negative reading for first-quarter GDP growth and further signs of contraction in the manufacturing sector, mixed with a solid employment report for April. The net impact on mortgage rates was mostly downward but just back to levels from early April. The 30-year fixed rate declined to 6.84 percent.
But there will be no rate cuts today from The Fed.
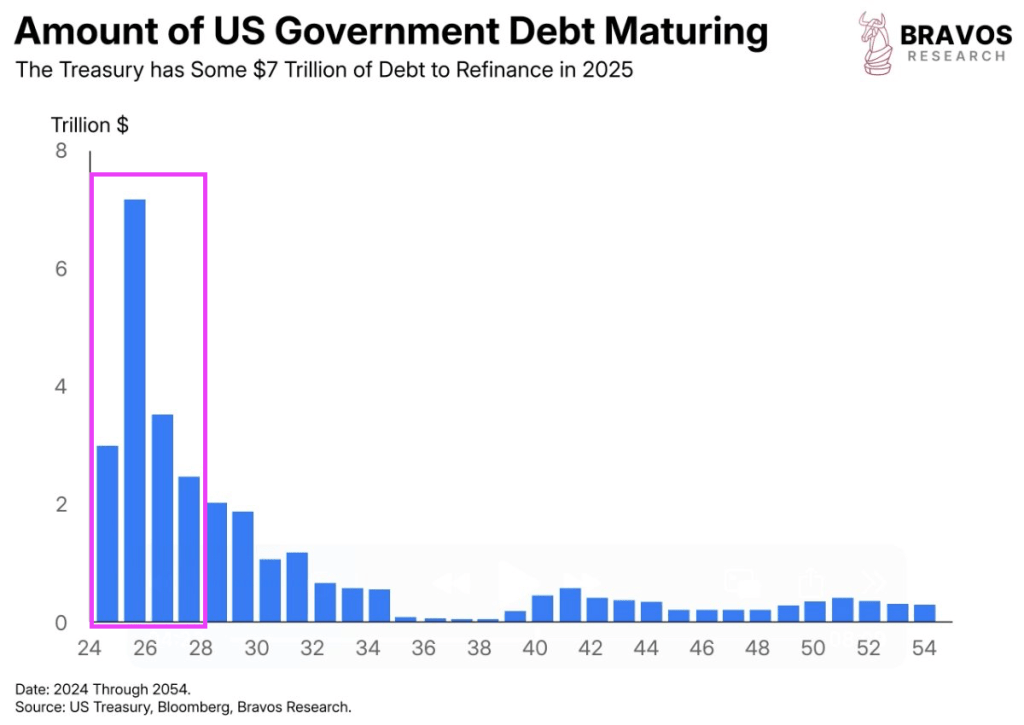
Doge is necessary to get close to closing the budget gap (tax receipts – spending). Biden left Trump and the US with an untenable fiscal situation (think Cloward/Piven). Extremely large debt load with debt maturing over the next couple of years. Thanks to former Treasury Secretary Janet “The Snake” Yellen government funding formula using ST government debt. And its time to pay the piper to pay for Biden’s overspending and Yellen’s Treasury mismanagement.
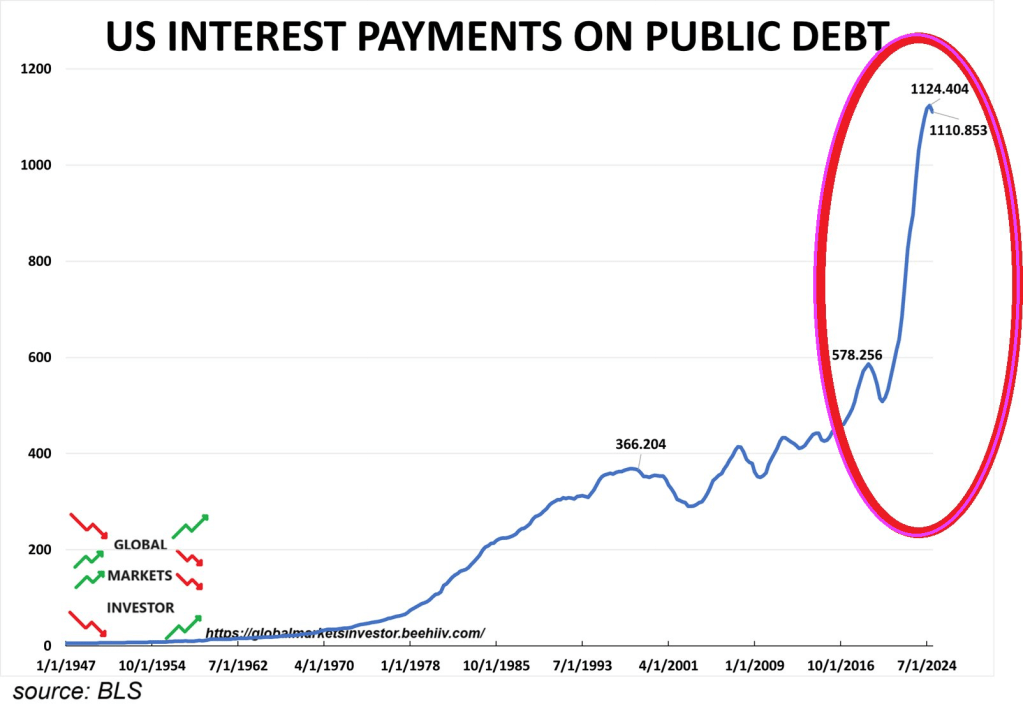
Most of the Treasury debt that Treasury Secretary Bessent must refinance is short-term.
And with interest rates higher under Trump/Bessent than Biden/Yellen, US Interest Payments on Public Debt is expected to keep rising.
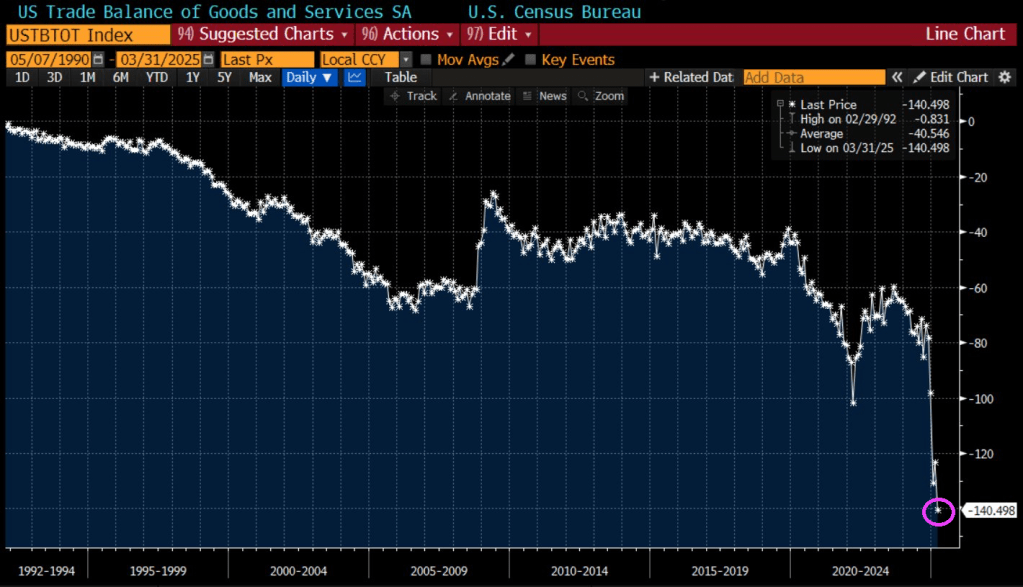
And US trade balance fell to -140.5.
So, were Biden’s economic policies (and Yellen’s Treasury mismanagement) an intentional Cloward-Piven strategy?
Here are Columbia sociologists Cloward and Piven attending a bill signing by President Bill Clinton.
Mortgage applications decreased 4.2 percent from one week earlier, according to data from the Mortgage Bankers Association’s (MBA) Weekly Mortgage Applications Survey for the week ending April 25, 2025.
The Market Composite Index, a measure of mortgage loan application volume, decreased 4.2 percent on a seasonally adjusted basis from one week earlier. On an unadjusted basis, the Index decreased 4 percent compared with the previous week. The seasonally adjusted Purchase Index decreased 4 percent from one week earlier. The unadjusted Purchase Index decreased 3 percent compared with the previous week and was 3 percent higher than the same week one year ago.
The Refinance Index decreased 4 percent from the previous week and was 42 percent higher than the same week one year ago.
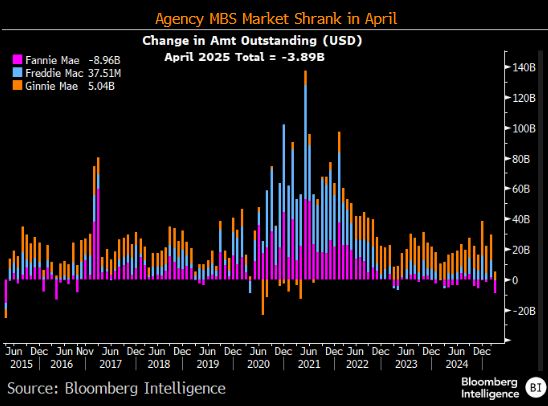
The Agency MBS market shrank in April.
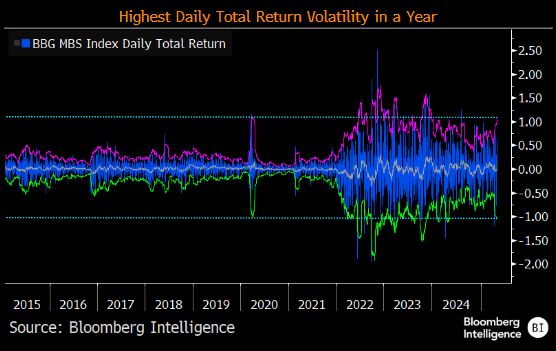
And MBS daily returns have the highest return volatility.
Republicans are trying to lock in Trump’s tax cuts and Democrats are resisting. We now know that DOGE is trying to end the wasteful spending in DC. But I would really like to see tax rates on the middle class fall.
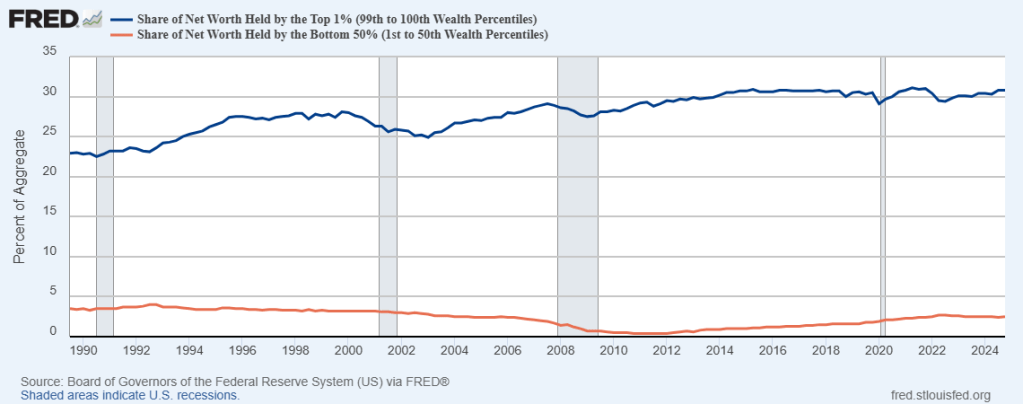
The wealth gap between the top 1% of taxpayers and the bottom 50% of taxpayers is enormous. And has gotten worse since 1990.
Meanwhile. to fight off the temporary effects of the tariff war, Trump is urging Fed Chair Powell to cut rates.
Powell will likely NOT cut rates. But what does “Lunatic Liz” Warren say about rate cuts??
DOGE is working: in Q1, US debt funding needs were $2BN less than the Treasury forecast in February, and in Q2 the Treasury is expected to need $53 billion less than it forecast 3 months ago.
Washington DC is loaded with good ol’ boys. Willing to cut deals with anyone for a slice of financial pie. Like “10% For The Big Guy” Joe Biden.
Money flowing into Treasury funds hit its highest since 2017, by far.
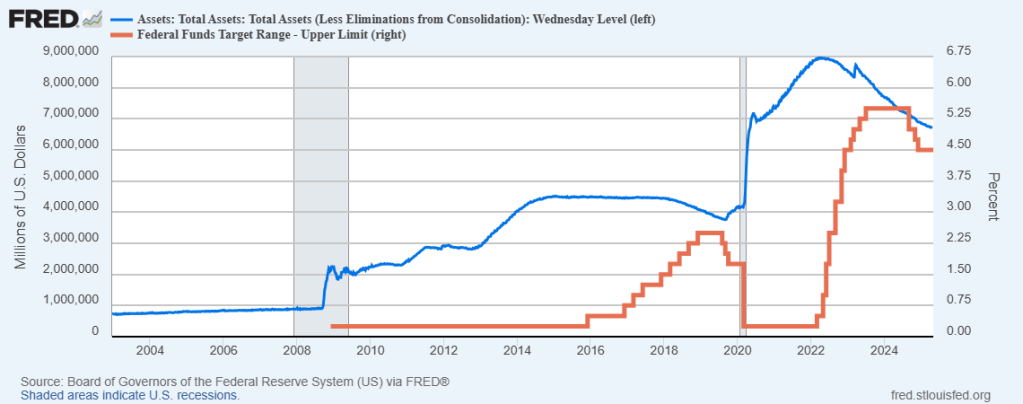
And with the massive expansion of The Fed’s balance sheet with a) the financial crisis and b) Covid crisis, The Fed still has a staggering amount of bonds on its balance sheet, making it vulnerable to interest rate increases.
Like what has happened in 2023 and 2024 under Biden. A fine mess!
Sail away. We are all prisoners of the theft by DC politicians.


You must be logged in to post a comment.