If you look at the following chart, you can see multifamily (5+ unit) starts remain elevated (pink box) which is not surprising given that home prices at growing at 19.1% YoY nationally (orange circle) and REAL hourly earnings have declined (yellow triangle) thanks to reemergence of inflation after 40 years.
Then we have the humming dragon, rising mortgage rates, that will reduce housing affordability even further.
Mortgage rates in the U.S. rose for a third straight week, reaching the highest point in almost two years.
The average for a 30-year loan was 3.45%, up from 3.22% last week and the highest since March 2020, Freddie Mac said in a statement Thursday.
Rates tracked a jump in yields for 10-year Treasuries, which climbed to levels not seen since early 2020, before the pandemic roiled financial markets. Signs point to borrowing costs rising further as the job market improves and the Federal Reserve steps up its efforts to tame inflation.
That would increase the burden on homebuyers who are already stretching to afford a purchase. Rates for 30-year mortgages tumbled to a record low of 2.65% a little more than a year ago.
Cheap loans have helped fuel a housing rally that’s still running hot even as home prices soar out of reach for many Americans.
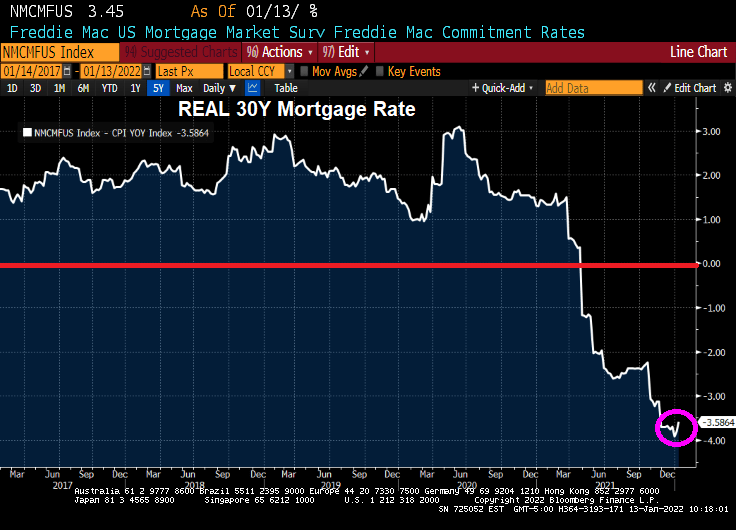
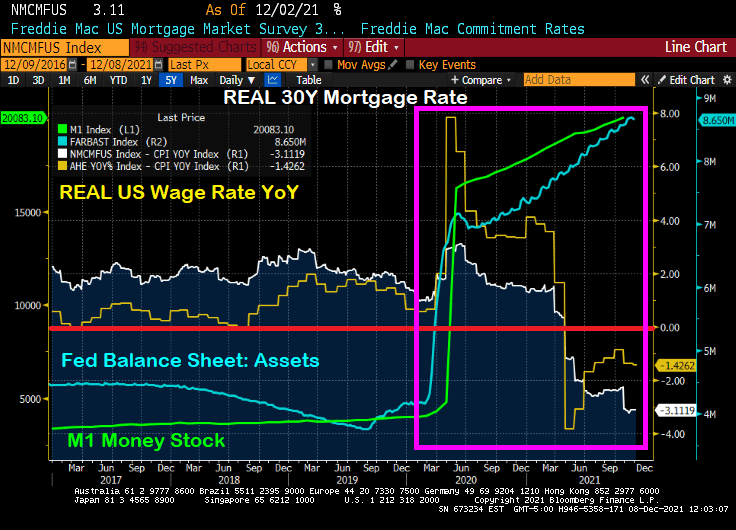
But wait! The REAL 30-year mortgage rate (nominal 30-year rate – CPI YoY) is -3.59%.
Lael Brainard, Biden’s nominee to be Vice Chairman of The Federal Reserve, has been one of the “inflation is transitory” crowd. US Senator Toomey is questioning Brainard in today’s hearing. From Toomey’s opening statement:
Last year, Governor Brainard repeatedly insisted that inflation was transitory. We have now had nine consecutive months where inflation has been more than two times the Fed’s 2% target. That makes it pretty clear that inflation is not transitory. Yesterday’s CPI release of 7.0%—the highest in 40 years—confirms that.
Inflation is a tax that is eroding Americans’ paychecks every day. Even though wages are growing, inflation is growing faster and causing workers to fall further and further behind.
At least the REAL mortgage rate is negative!
I hope Senator Toomey shows Brainard this chart of “transitory” negative wage growth.
Negative wage growth and negative REAL mortgage rates. What a total mess!
The last mortgage purchase applications index from the Mortgage Bankers Association was released this morning. The headline is “Mortgage Purchase Applications Plunge 10% WoW (since the previous week). But this is called “Seasonality.” And it happens EVERY YEAR.
Here is a chart of mortgage purchase application (NON-seasonally adjusted). What will happen when the new year starts and purchase applications began rising?
Whether seasonally-adjusted or not, all number are down for the final week of 2021, except for the 30-year mortgage rate that rose 60 basis points.
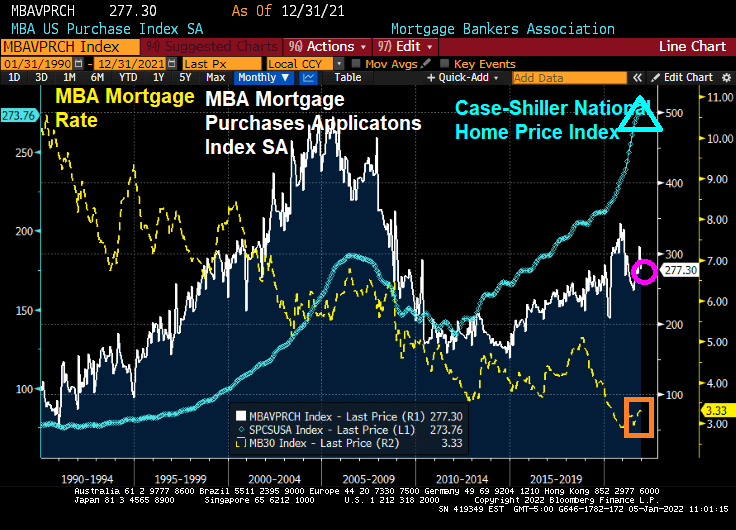
On a seasonally-adjusted basis (aka, smoothed-out), we can see the impact of super-low mortgage rates on home prices.
Here is the data summary for the last week of December 2021. All indices are down … except for the 30 year mortgage rate which was up 60 basis points.
Happy New Year! And Treasuries are off to fast start with investors bailing on Treasuries and buying stocks. AND the expectation that The Fed will raise rates 3 times this year.
The 10-year Treasury Note yield rose above 1.60% this morning.
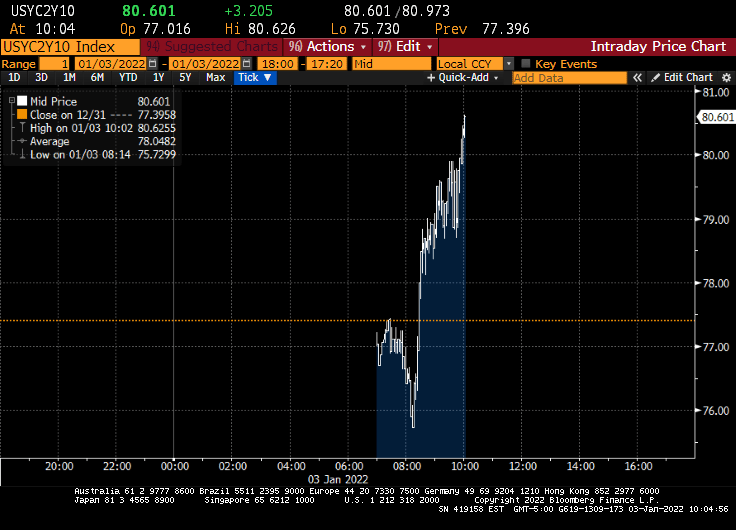
And the US Treasury 10Y-2Y curve rose to 80.601 basis points.
Fed Funds Futures data is showing 3 rates hikes in 2022. May, September and December.
The Fed Dots project is definitely showing an upward trend in the Fed Funds Target rate with FOMC member forecasting the median target rate to be above 2% by 2024.
Of course, Fed reverse repo activity grew to an all-time high (but it is expected to pare-back).
How about mortgage rates? I expect mortgages rates to rise over 2022 as the 10-year Treasury Note rises.
Cautionary note: The Fed is likely to protect economic growth and ignore inflation. So I expect FOMC will continue to reinvest prepayments into Treasury and MBS, pro-rata to the current portfolio.
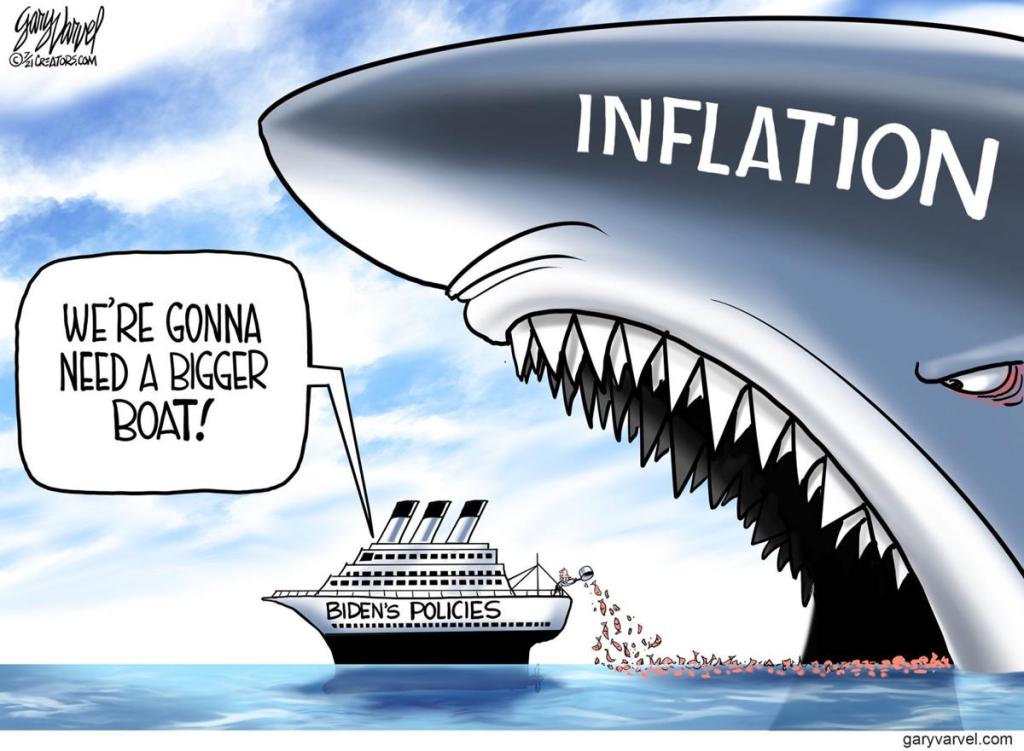
2021 has been a very weird year. Inflation has boomed (highest in 40 years) after the election of Joe Biden as President of the USA (call it Bidenflation). Then we have The Federal Reserve barely acting on the booming inflation (keeping rates at 25 basis points while withdrawing the COVID-related monetary stimulus).
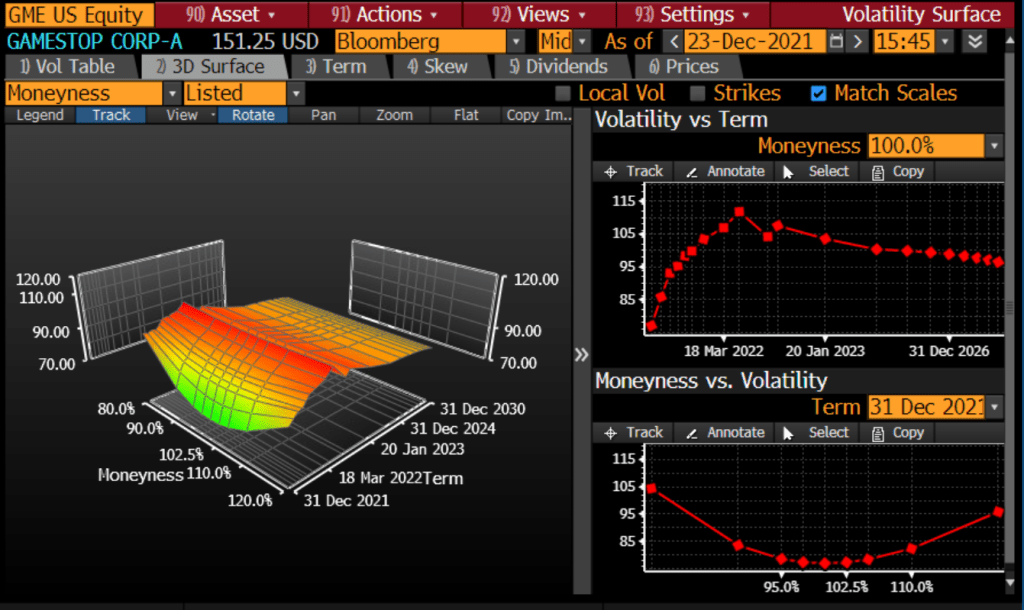
Given the volatility of GameStop (Reddit-inspired), you can see the strange shape of GameStop’s volatility surface.
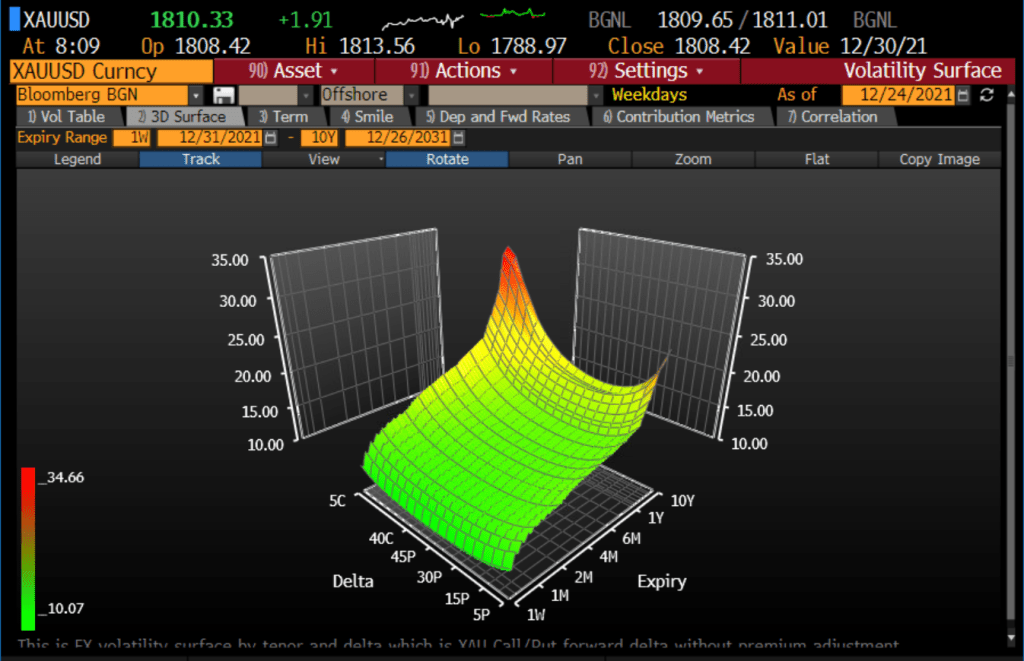
By contrast, gold is now where it was was at the beginning of 2021 and the surge of Bidenflation.
Here is volatility surface for gold.
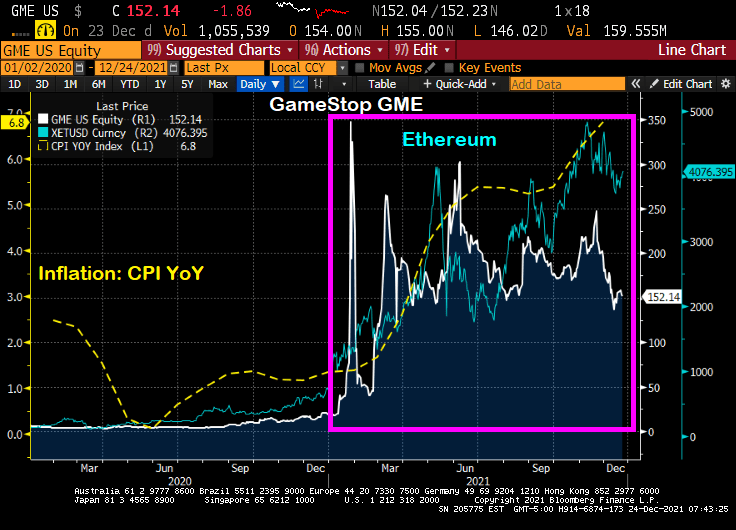
So, there are a number of meme stocks (GameStop is just one example), gold, silver, cryptos such as Bitcoin and Ethereum. But gold seems to be placid with respect to inflation, but the meme stocks and cryptos seem to be motoring. Or is it rage against the financial machine? Or rage against Bidenflation??
The US stock and bond markets are closed today and tomorrow, Christmas day.
Have a Merry Christmas! And celebrate the “Santa Pause” as Powell refuses to raise rates to combat inflation until 2022.
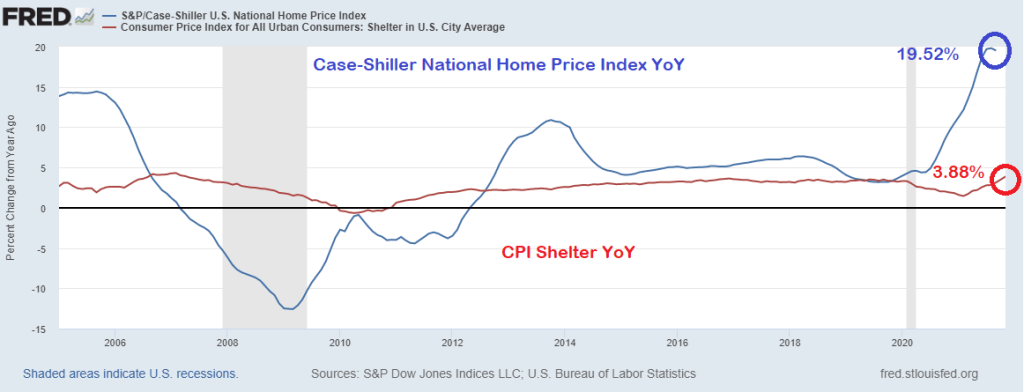
But that 6.9% YoY is very misleading because of the strange way the Bureau of Labor Statistics measures the largest asset in most households’ expenditures: housing.
The BLS measures inflation in housing using the Shelter measurement. Which was only 3.88% YoY. The problem is that the Case-Shiller National Home Price Index was 19.52% in its last reading. That is quite a discrepancy.
So, if we substitute the Case-Shiller National home price index for the CPI Shelter, we get an inflation rate of greater than 11%.
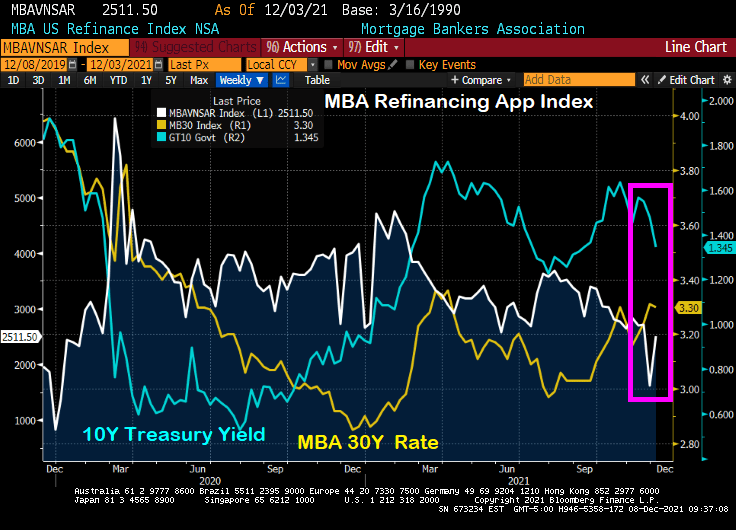
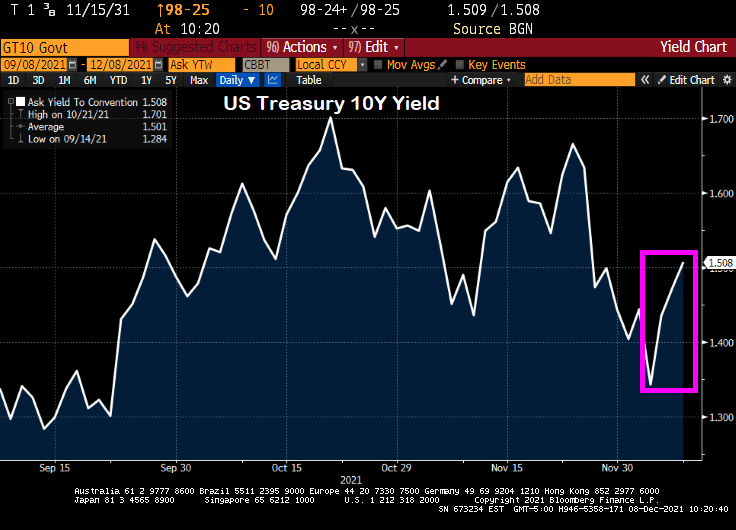
Despite the “Talk, Talk” from The Federal Reserve about balance sheet taper and rate “normalization,” we actually saw the 10-year Treasury yield fall from 1.6651% on 11/23/2021 to 1.343 on 12/3/2021. While the 30-year mortgage rate only fell from 3.31% to 3.3%, it is the SIGNAL that The Fed is sending that people should refinance their mortgages ASAP.
You can see the rise in mortgage refinancing applications of 56% week-over-week (WoW) (white line) with the drop in the 10-year Treasury yield (blue line) despite the relatively small drop in the Mortgage Bankers Association (MBA) tiny drop in their 30-year mortgage rate index.
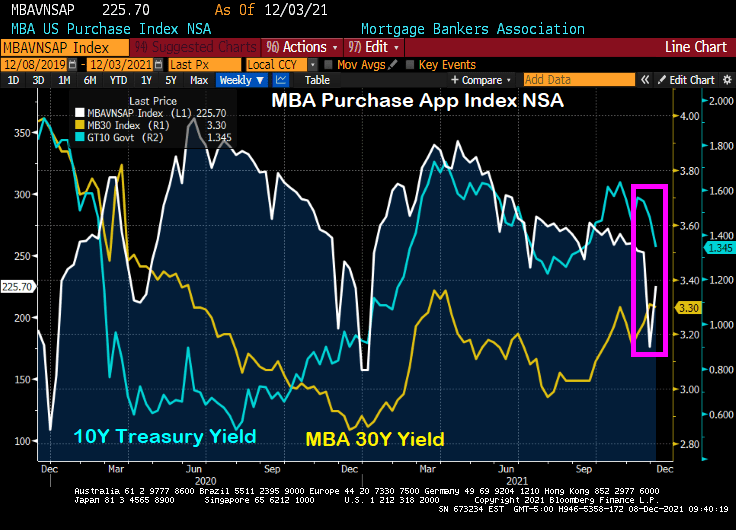
Ditto for the MBA mortgage purchase application index. The drop in the US Treasury yield (blue line) resulted in a 28% WoW increase in mortgage purchase applications.
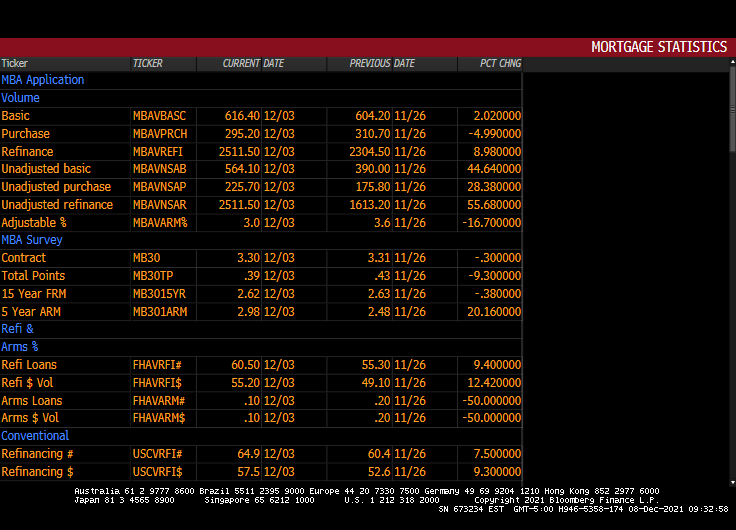
Here is the table of MBA data for the week of 12/03.
Please note that the 10-year Treasury yield have jumped since 12/03 indicating that mortgage application activity for the week of 12/10 will be lower.
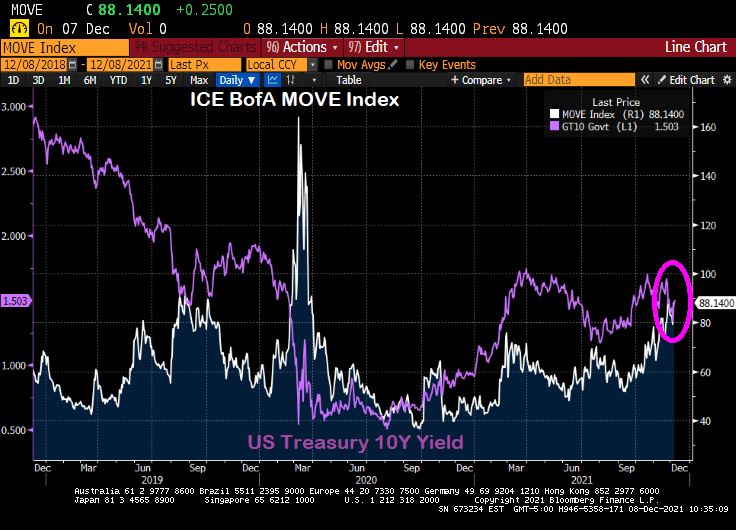
Here is the MOVE bond volatility index and the US Treasury 10-yield chart. Can you spot the COVID outbreak??
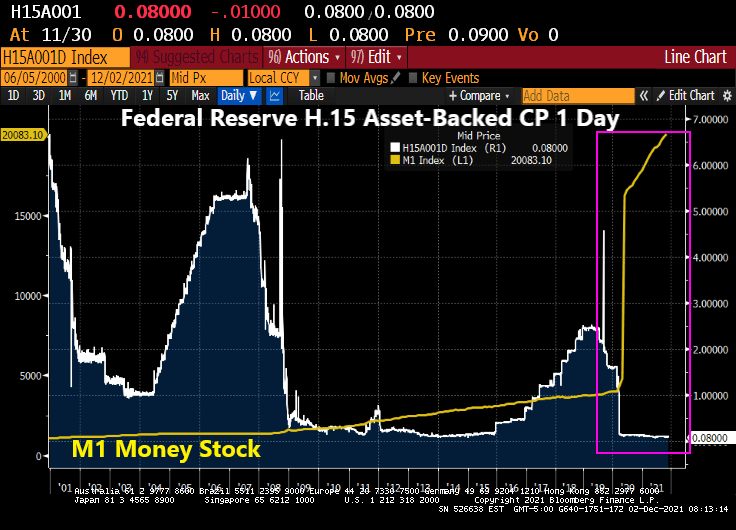
The Dream Team (Fed Chair Jay Powell and Treasury Secretary Janet Yellen) just can’t believe that inflation struck even after M1 Money Stock increased by 369% from March 2020 to today while interest rates remained near zero.
From The Hill: Federal Reserve Chairman Jerome Powell and Treasury Secretary Janet Yellen on Wednesday said they underestimated how quickly the U.S. economy would rebound from the COVID-19 recession and strain supply chains.
During a Wednesday hearing before the House Financial Services Committee, the top two U.S. economic policymakers acknowledged that high inflation has risen higher and lingered much longer than they expected.
“We understood demand would be strong,” Powell said. “We didn’t understand [the] significant problems of the supply side.”
Both Yellen and Powell said substantial fiscal and monetary stimulus played a role in stoking the higher demand that fueled inflation, but they called it a challenging side-effect of an otherwise fast recovery.
Seriously? The Fed and the Federal government dumped trillions of dollars into an economic system and didn’t think there would be negative consequences??
Look at the surge in M1 Money Stock at the same time asset-backed commercial paper rates are 0.08%. That is, about 1/3rd The Fed Funds Target rate (upper bound). None of this concerned The Dream Team?
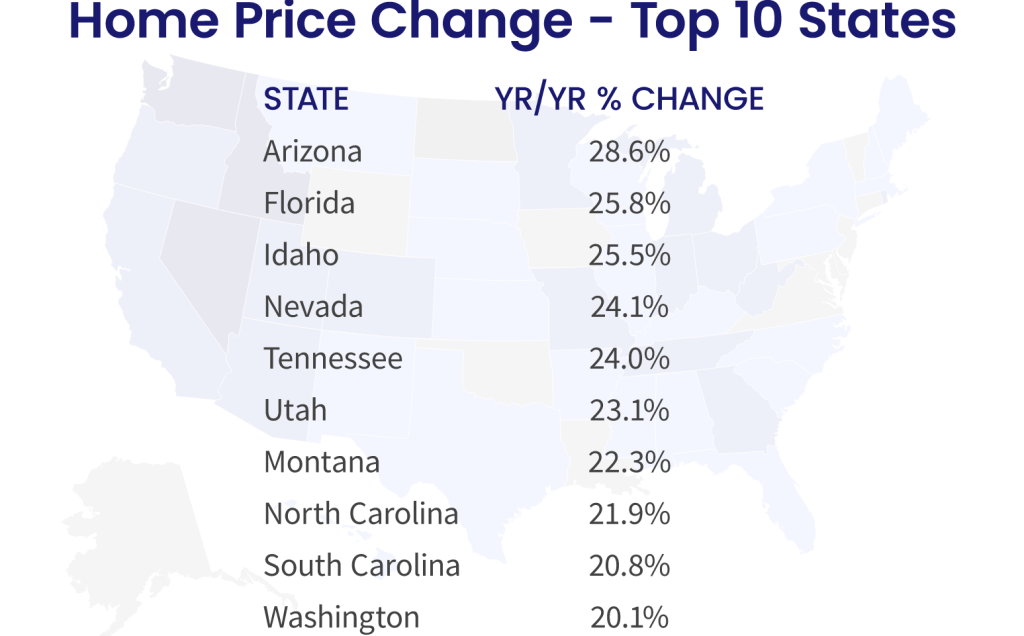
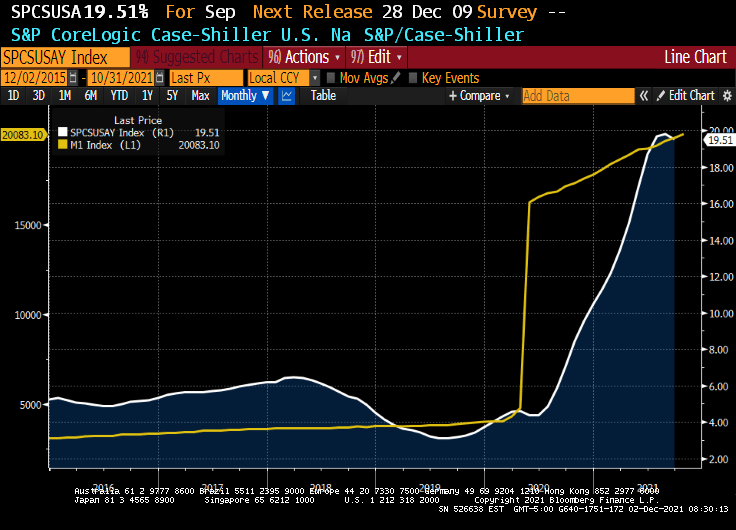
An example of what The Dream Team didn’t see happening was the explosion of home prices. Home price growth was about 4% YoY prior to COVID, and is now 19.51% YoY.
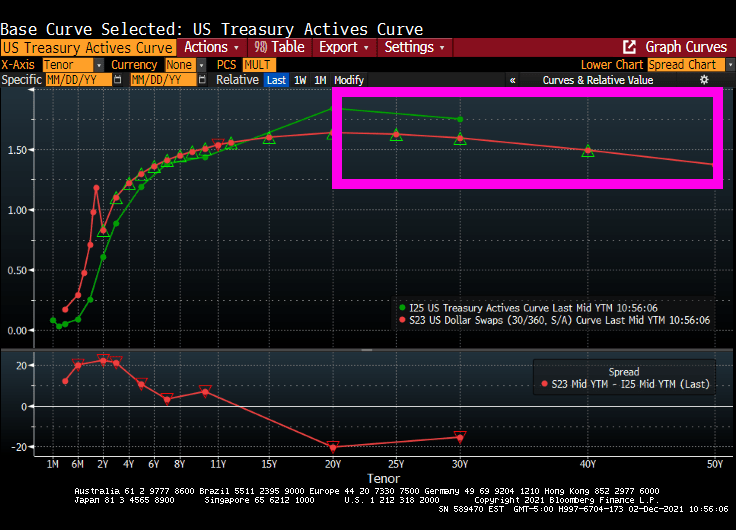
Now we have the US Treasury Actives curve inverting like the US Dollar Swaps curve after 20 years.




















You must be logged in to post a comment.