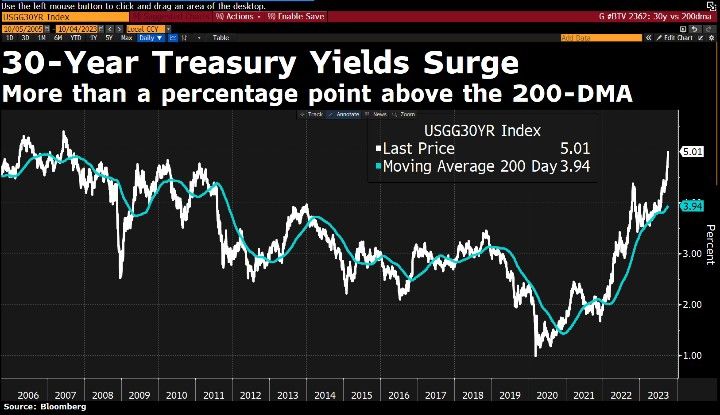
US Treasury yields are a runaway train. The 30-year Treasury yield is soaring and rose above 5% … again. First time since 2007, just before the financial crisis and The Great Recession.
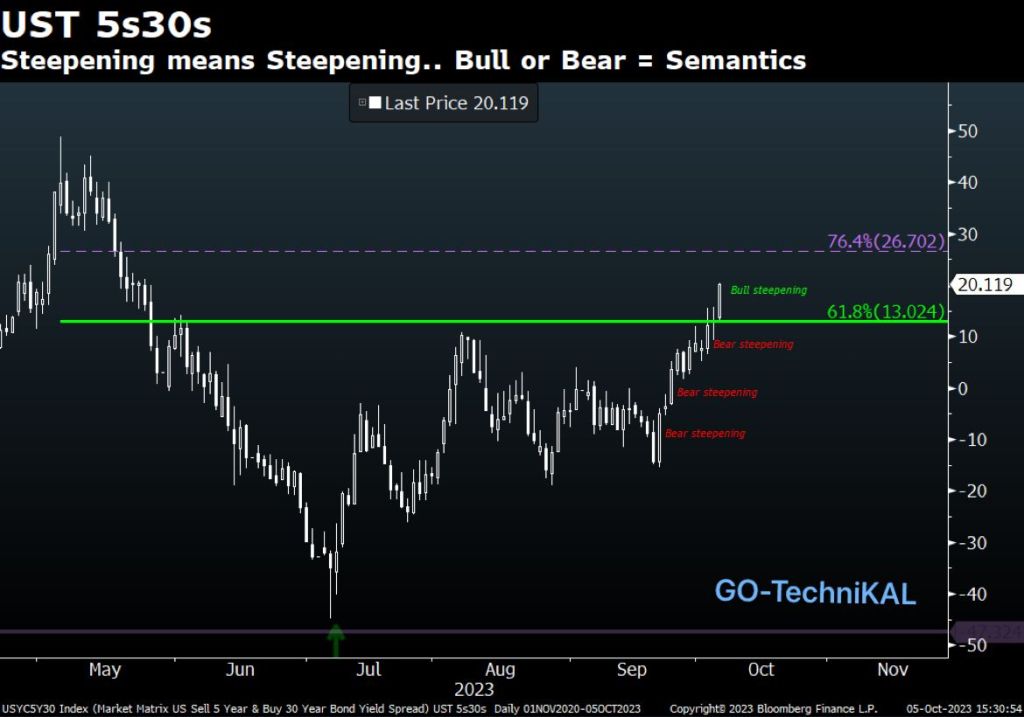
The 30Y-5Y yield curve is steepening.


Confounded Interest – Anthony B. Sanders
Financial Markets And Real Estate
US Treasury yields are a runaway train. The 30-year Treasury yield is soaring and rose above 5% … again. First time since 2007, just before the financial crisis and The Great Recession.
The 30Y-5Y yield curve is steepening.
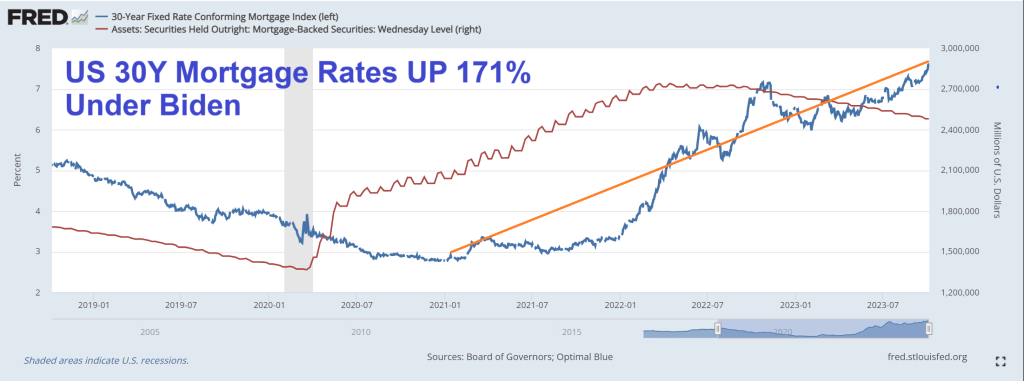
Bidenomics is an economy eater! But at least we know that the southern border is not on Biden’s mind or lips. But as Ronald Reagan once asked “Are you better off now than 4 years ago?” The answer? Most Americans are far worse off due to inflation and the surge in “Would you like fries with your burger?” jobs. And mortgage rates are up 171%.
After last month’s (September) stunning payrolls report, when in our post-mortem we revealed not only a year full of monthly downward data revisions, but also collapse in tull-time jobs and surge in part-time jobs, as well as the worst unadjusted August payrolls since the great recession, we thought that nothing could shock us any more. And then we got the September jobs report.
We won’t spend too much time dissecting the report since regular readers are all too aware of the same old “upward goalseeking” tactics used by the BLS, so here are the highlights.
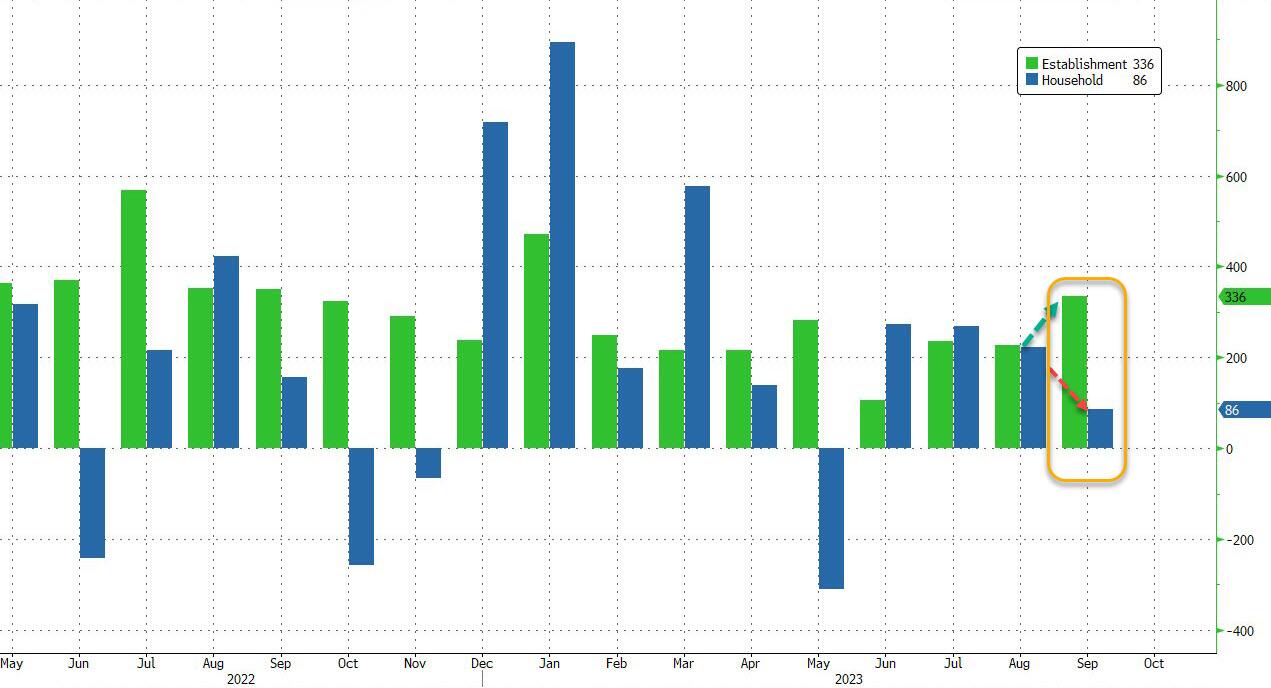
First, the 336K jump in headline payrolls – the biggest since January – was stunning when considering that it was not only above the highest Wall Street estimate but was a 6-sigma beat to expectations.
How is it possible to get such an outlier print to not only trends but expectations? Let’s try to answer that question.
If, as the BLS claims, in September the jobs market suddenly reversed a year of declines, surely there will be some qualitative validations to this quantitative outlier, right? Unfortunately, looking through the supporting evidence we don’t find any justification to the BLS exuberance.
Let’s start with the Household survey: here instead of a number anywhere close to the 336K jobs gained (as the far less accurate Establishment survey reports), the number of newly employed workers was just 86K, the lowest since May, and the second lowest of 2023!
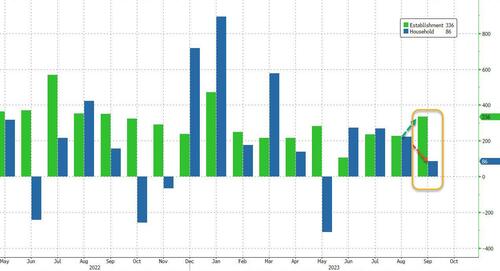
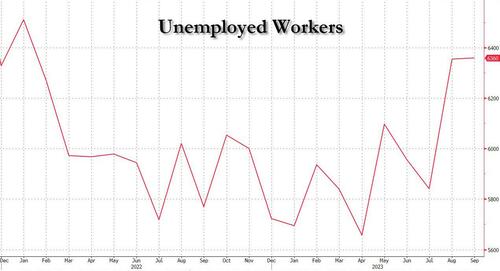
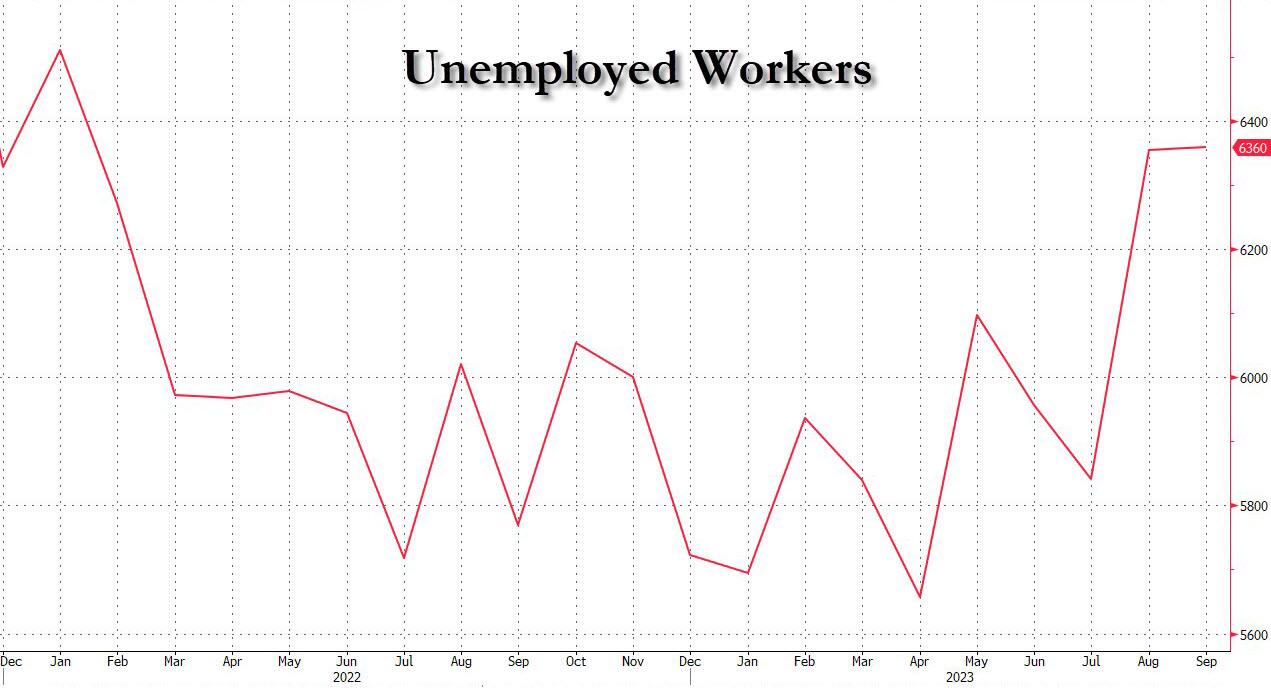
And since the number of unemployed workers also rose to 6.360 million, the highest number since January 2022, the unemployment rate was sticky at 3.8%, and refused to drop to 3.7% as consensus had expected.
How about the Establishment survey? Well, here too, things stink. Yes, the headline surge was great, but the question here is how much of that was purely seasonals.
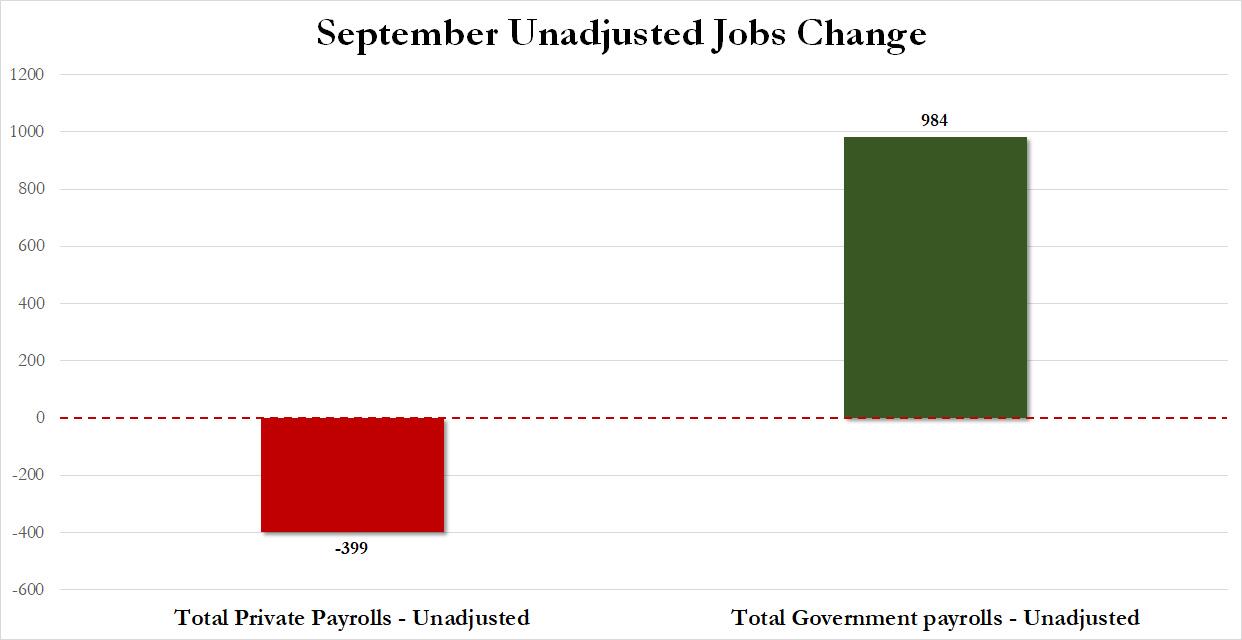
The official adjusted data showed this Leisure and Hospitality added a whopping +96k jobs. But unadjusted data showed that the sector lost 466k jobs in Sep. This means that the unadjusted private sector payrolls was -399!
Wait, if unadjusted total payrolls rose by 585K and yet private payrolls dropped by 399K, that means that… you got it: in September, all of the unadjusted jobs came from – drumroll – the government, which added a whopping 984K jobs (mostly teachers).

Translation: for yet another month all the strength in the Establishment was thanks to seasonals and various plugs that made the total number much stronger.
And now, let’s turn again to the much more detailed and accurate Household Survey, where we find the BLS back to its old tricks again.
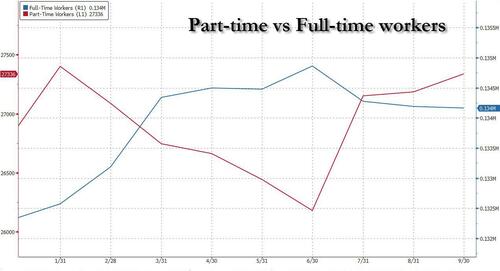
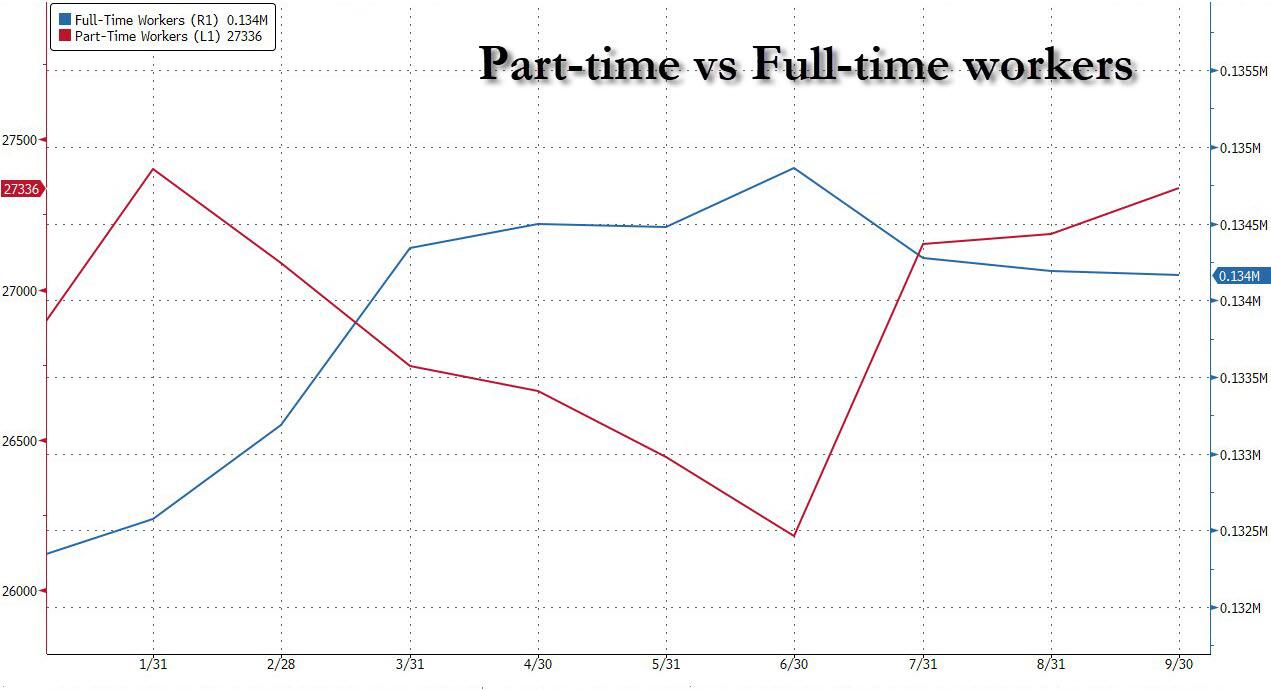
First, as we pointed out earlier, despite the alleged quantitative surge, the quality of the jobs was anything but good. In fact, looking at the infamous table A-9 of the employment report, reveals that in September, a seasonally adjusted breakdown of jobs shows that part-time workers accounted for the entire increase, rising by 151K; as for full-time workers? Well, for yet another month, this number dropped, sliding by 22K in September.
Indeed, as shown in the chart below, while part-time workers rose for the third consecutive month to 27.336 million,and the highest since January, full-time workers have decline for three straight months, and at 134.167 million, this was the lowest number going back to February!
But hold on, you say, why use Seasonally Adjusted number when we already noted above that there continue to be chronic issues with the BLS’ seasonal adjustments in the post-covid era. True, so let’s use unadjusted numbers instead. What do we get?
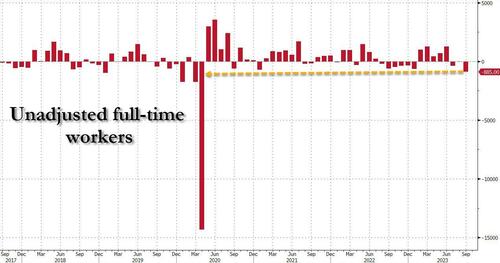
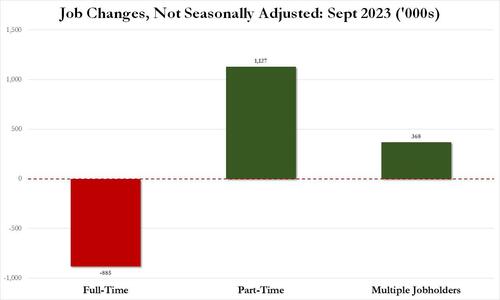
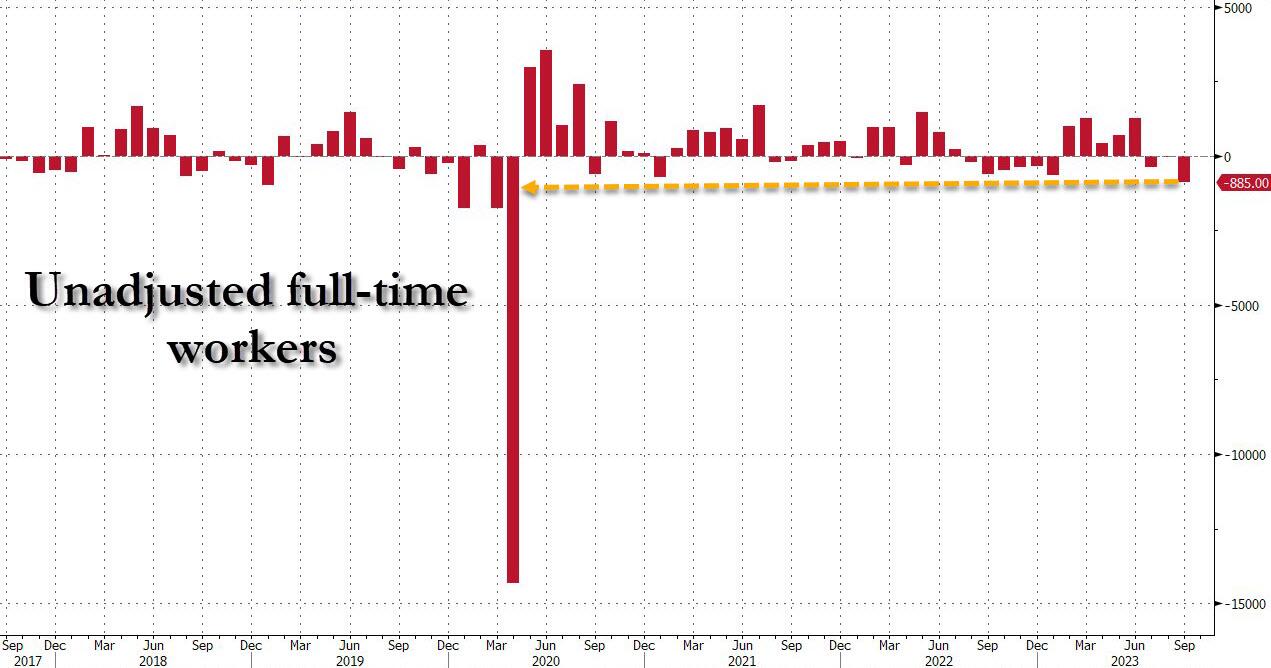
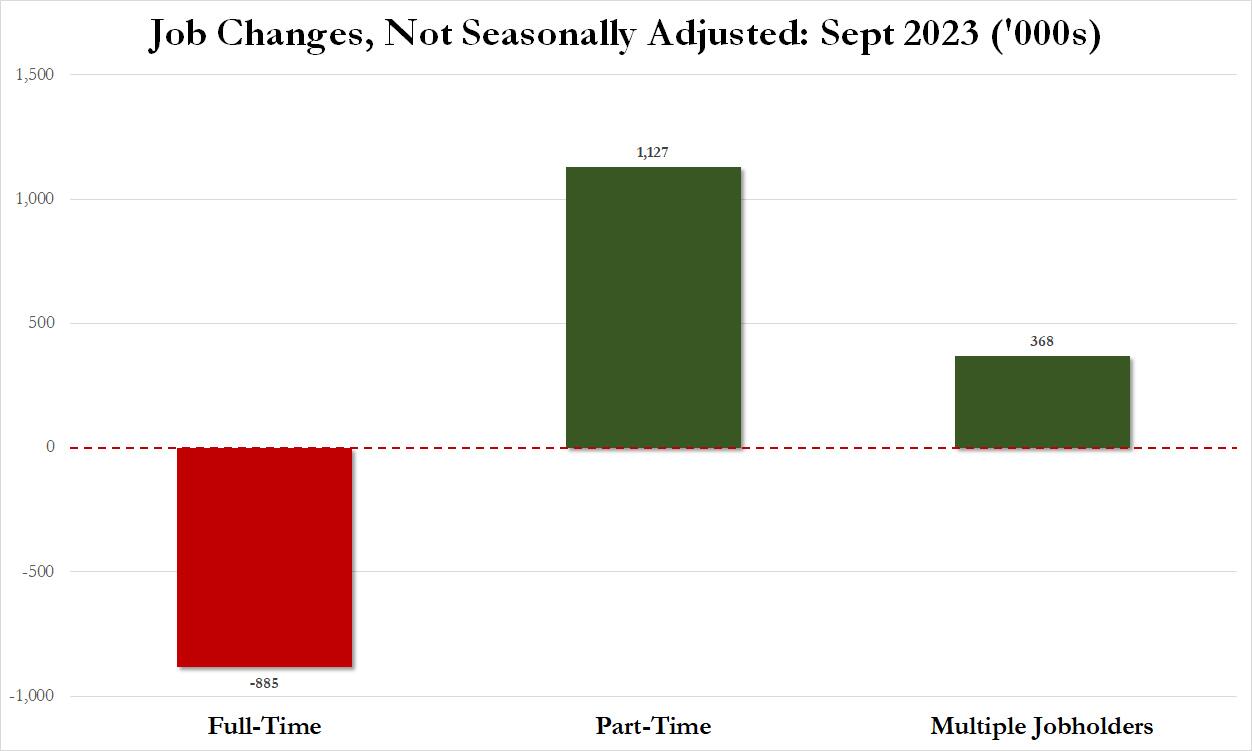
Well, we get the following whopper: in September, the number of unadjusted full-time workers collapsed by 885K. This was the biggest monthly drop since – drumroll- April 2020 when the economy was shut down!
And if full-time workers plunged, that must mean that part-timers exploded, right? Why yes, they did: by 1.127 million in one month to be precise, and at 27.109 million the number of part-time workers was the highest since April.
Finally, let’s not forget the number of multiple jobholders: those unlucky souls which have to work not one but two (or more) jobs to make ends meet under Bidenomics. Also, multiple jobholders (which are measured by the Household Survey) are double, and triple- counted when it comes to the Establishment Survey. So how did thy do in September? Well, on a seasonally adjusted basis, the number increased by 123K to 8.151 million, the highest since January 2020. As for the much more accurate, unadjusted number, well that soared from 7.778 million to 8.146 million, an increase of 368K, or more than all the 336K payrolls reported by the establishment survey.
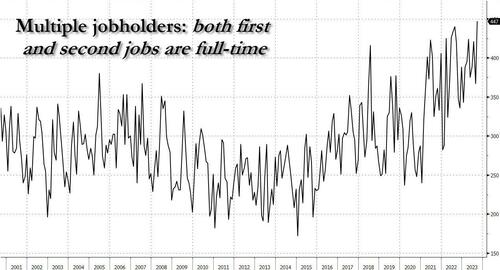
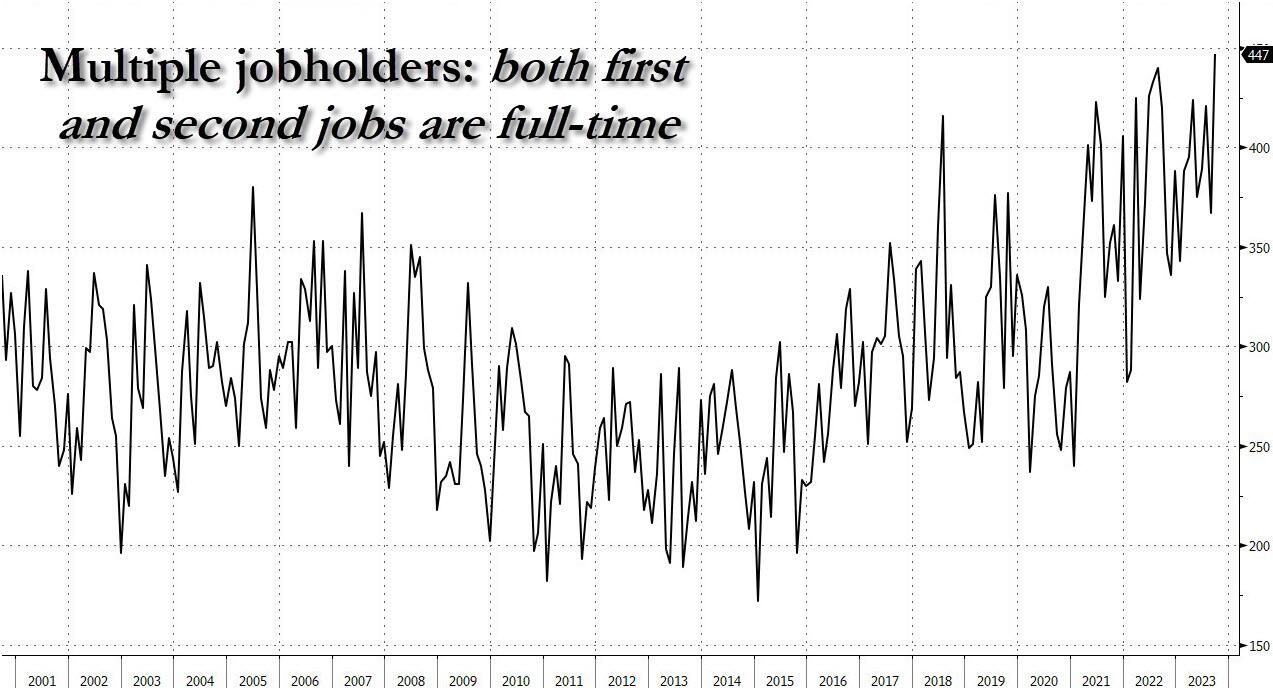
In other words, all of the job gains in September were either from part-time workers or multiple jobholders forced to get another job in addition to their current one, and thus be counted by the BLS as two distinct jobs (or more). One final observation on the multiple jobholders: in September, the subset of multiple jobholders who held both a primary and secondary full-time job just hit an all time high.
Visually, this is what September’s “stunning” jobs report really looked like.
Source for everything: BLS, but one needs to do some actual work to get a sense of what is really going on.
And on top of the blood curdling jobs report, mortgage rates rates and are up 171% under Bidenomics.
And then we have Hillary Clinton pulling a Pol Pot and suggesting de-programming of Trump supporters like in the movie “The Killing Fields.” Pol Clinton??

Thanks to Mish (Mike Shedlock) for this wonderful piece!
The Fed erroneously does not consider rising home prices as inflation. Here’s the result in pictures.

Chart Note
For 12 years, home prices, OER, Rent, and the overall CPI all rose together. That changed in 2000 with another trendline touch in 2012. Then it was off to the races as the Fed did round after round of QE, suppressing mortgage rates.
Case-Shiller Home Price vs Hourly Earnings, the CPI, and Rent

As with the previous chart, for 12 years, home prices, rent, the overall CPI and hourly earnings all rose together. That changed in 2000 with another trendline touch in 2012.
How Much Are Homes Overpriced?
If the 12-year trend of home prices rising with average hourly earnings stayed intact, the home price index would be 211, not 308.
From that we can calculate home prices are ((308-211) / 211) percent too high, roughly 46 percent too high. If you prefer, home prices would need to fall ((308-211) / 308), roughly 31 percent.
Alternatively, if home prices stagnate for years, wages may eventually catch up.
Case-Shiller Home Price 1988=$150,000

The same home that cost $150,000 in 1988 now costs $678,366. But wages have gone up too. And mortgage rates have had wild swings.
Mortgage Payment and Wage Adjusted Mortgage Payment

The Least Affordable Mortgages in History
Factoring in wage growth, home prices, and mortgage rates, homes are the most expensive ever.
It’s actually much worse than the chart indicates because property taxes and insurance are not factored into.
Mortgage Rates

Through massive and totally unwarranted QE, foolishly hoping to create more inflation, the Fed suppressed interest rates to record lows and mortgage rates followed.
Anyone with an an existing mortgage could and did refinance at 3.00 percent or below.
This increased “affordability” and we now have two classes of people courtesy of the Fed: winners and losers (existing home owners who refinanced low and those who want to buy).
Mortgage Application at 30-Year Lows

Please note Mortgage Application Volume Nears 30-Year Lows
“Mortgage rates continued to move higher last week as markets digested the recent upswing in Treasury yields. Rates for all mortgage products increased, with the 30-year fixed mortgage rate increasing for the fourth consecutive week, up to and above 7.53 percent – the highest rate since 2000,” said Joel Kan, MBA’s Vice President and Deputy Chief Economist. “As a result, mortgage applications ground to a halt, dropping to the lowest level since 1996. The purchase market slowed to the lowest level of activity since 1995, as the rapid rise in rates pushed an increasing number of potential homebuyers out of the market. ARM loan applications picked up over the week and the ARM share increased to 8 percent, as some borrowers searched for ways to lower their payments.”
What About the Winners?
Good question. The winners refinanced at 3.0 percent or below. This put extra money in their pockets every month to spend.
And rising wages further stimulated ability of the winners to buy goods and services.
Thus the Fed is still paying for its asinine push to create inflation.
Meanwhile, the housing market is dead and will remain dead with mortgage rates approaching 8.00 percent.
What About Rent?

That’s another good question. For 24 months or so, economists have been predicting an ease in rent inflations.
On September 13, I noted Consumer Price Inflation Jumps 0.6 Percent Led by Energy and Shelter
The price of gasoline rose 10.6 percent, rent another 0.5 percent, shelter, 0.3 percent, and new cars 0.3 percent leading the way for a 0.6 percent increase in the CPI in August.
The price of rent has gone up at least 0.4 percent for 25 straight months. Not to worry, Paul Krugman says this is lagging.
When Will Record Housing Units Under Construction Ease Rent Inflation?

On October 2, I asked When Will Record Housing Units Under Construction Ease Rent Inflation?
That’s really a trick question. For a better question, remove the lead “when” from the sentence.
The answer is: I don’t know, nor does anyone else, although people claim to be clairvoyant.
Housing Units Under Construction vs CPI Rent Year-Over-Year
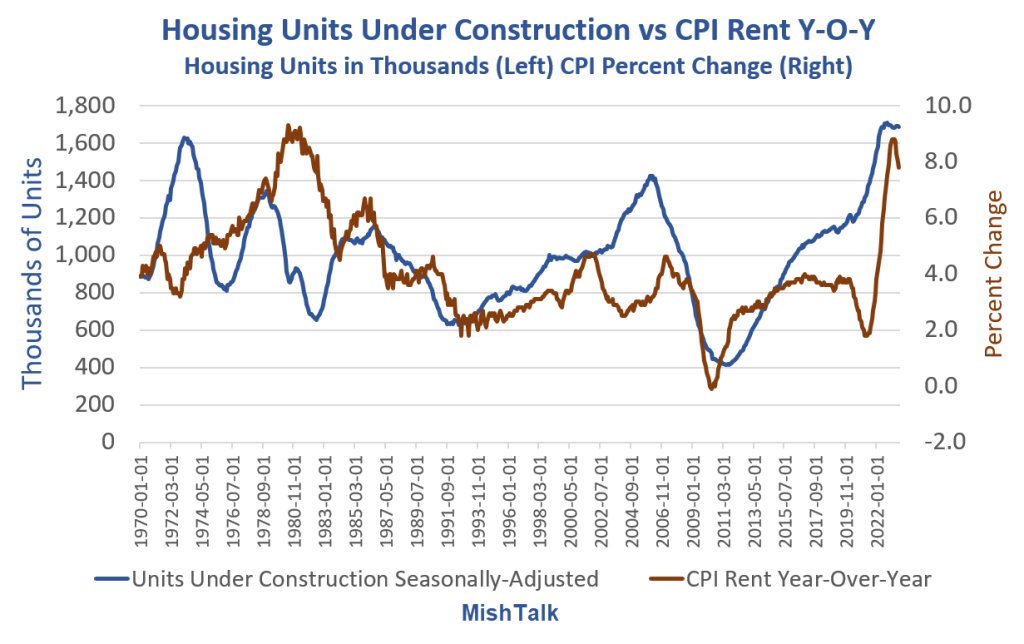
I saw the theory that rent would collapse as soon as housing units get completed so many times that I almost started believing it myself.
However, the data shows no discernable correlation no matter how you shift the lead or lag times.
The chart looks totally random. So perhaps rent abate. Perhaps not. The data itself provides no reason to believe anything.
Regardless, please note the floor. Year-over-year rent has a floor of about 2 percent except in the Great Recession housing crash.
And these charts are not imputed Owner’s Equivalent Rent prices for which people pay no actual rent. These charts reflect rent of primary residence.
34 Percent are Screwed
Well, don’t worry. Only 34 percent of the nation rents, and besides, rent is lagging.
Sarcasm aside, the Fed blew huge asset bubbles and did not see that as inflation. Nor did the Fed see that three massive rounds of fiscal stimulus would cause inflation.
Real Income and Spending Billions of Chained Dollars

Note the three rounds of massive fiscal stimulus in the Covid pandemic. This triggered the most inflation since the 1970s. Economists debate how much “excess savings” still remains.
For discussion of excess savings, please see Excess Pandemic Savings, How Much is Still Unspent?
The Fed never saw this coming, never saw a housing bubble in 2007, and has never once predicted a recession.
Heck, former Fed chair Ben Bernanke denied a housing bubble and denied a severe recession that had already started.
Expect More Inflation Everywhere
Unfortunately, Biden is doing everything humanly possible to stoke inflation with EV mandates, natural gas mandates, union pandering, student debt forgiveness, and regulations, some of which is blatantly unconstitutional.
As a result, Fed Rate Interest Rate Hike Expectations Are Still Higher for Even Longer
Looking to Buy a Home?
If you are looking to buy your first home and need to finance, good luck.
The longer the Fed holds rates high, the longer the housing transaction crash lasts. But cutting rates will further expand the housing bubble, asset bubbles in general. And bubbles are destabilizing.
That is the Fed’s tightrope dilemma, of its own making.
If you are one of the winners, congrats. But that extra money the Fed put in your pocket every month may stoke inflation for a long time.



Coping with inflation caused by Federal spending (and excessive Fed stimulus) is difficult and eventually consumer max out their credit cards. Like now!
Credit card useage nosedived by -10.8% in September, according to Citi. This is the fifth straight month of spending decleration.

Leading the decline was electronics. The leader on the positive sign was … jewelry?? Hey, I thought mobs of people were robbing stores because they were hungry!!
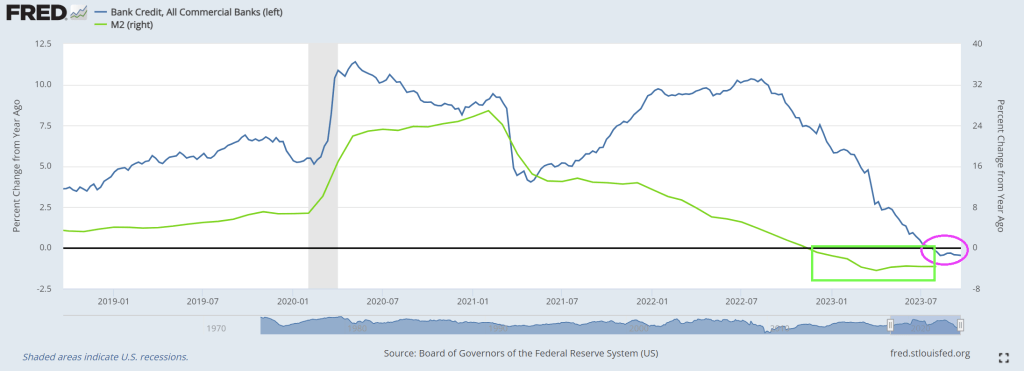
In terms of bank credit, rising rates to fight inflation, bank credit growth Bank credit growth has been negative for nine straigth weeks.
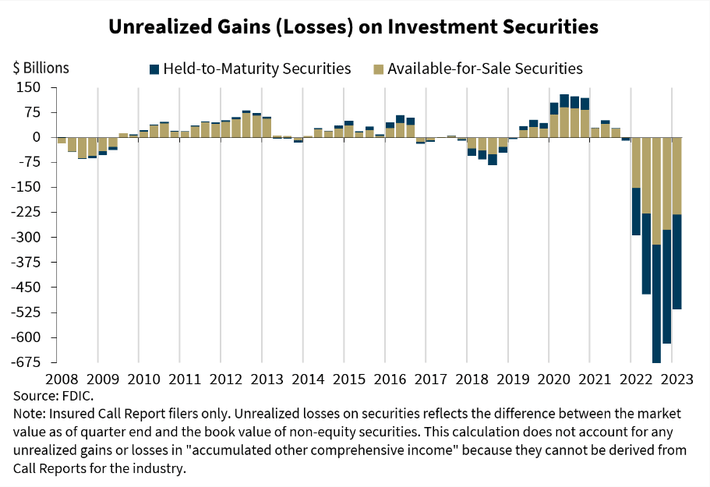
Then we have unrealized losses on bank balance sheets, expected to surge to $700 billion with soaring interest rates.
On a different note, Homeland “Security” head Mayorkas now claims the US has to build a wall to combat the out-of-control immigration on the southern border. Wait! I thought Mayorkas and Congressional members (angrily) claim the border was secure! It doesn’t matter, Mayorkas is simply signalling to blue states that he will build a wall. But how fast is a different question.
Here is a video of tHe Biden Administration arranging for the border wall to be consructed. Mayorkas will likely call O’Reilly the builder to build the border wall.

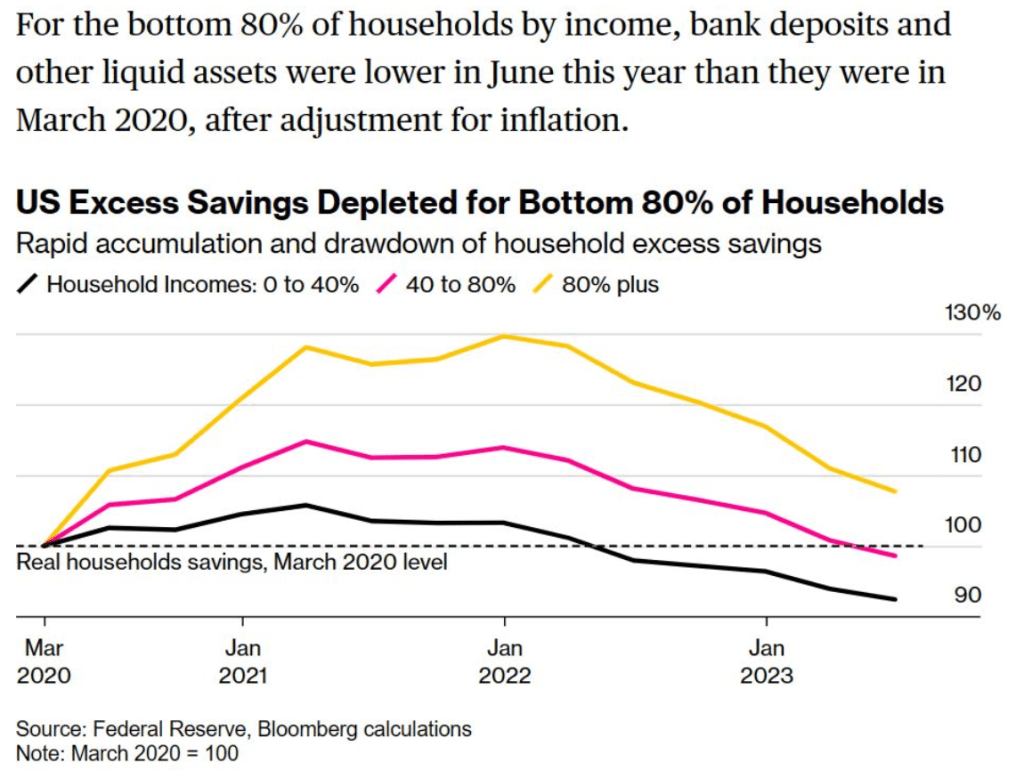
Wasting away again with Bidenomics, code for massive Federal subsidies to green energy donors. And incentives to buy impractical EVs. Imagine in an emergency and your car only goes 200 miles (and then you have to wait for an available charger to come open). Well, the top 1% are doing fine. But the bottom 80% of households by income are seeing rapid deplection of savings to cope with the rising costs of Bidenomics.
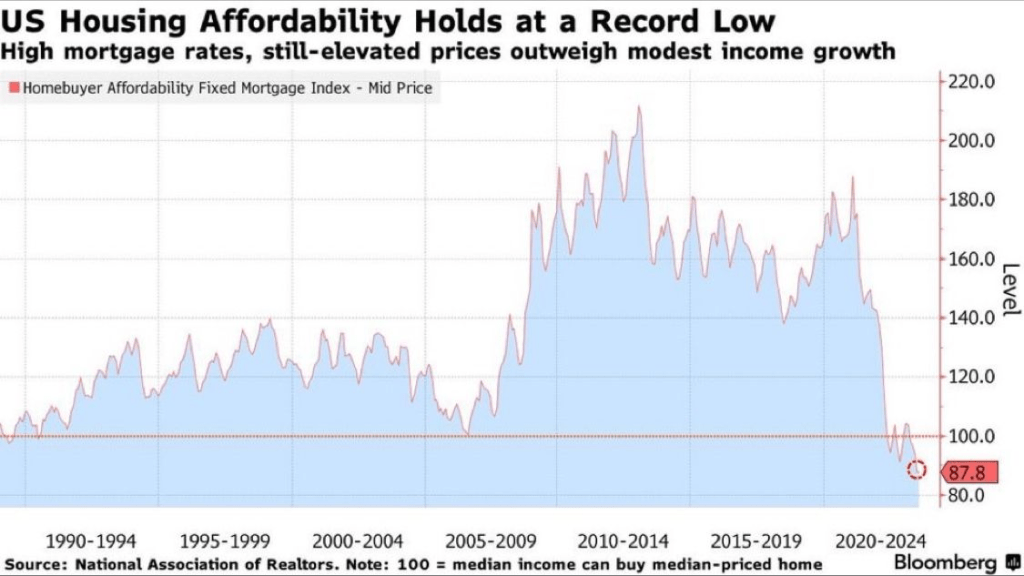
And then we have shrinking home affordability, now at a record low.

Freddie Mac’s mortgage rate is up to 7.31%, the highest level since December 2000. That means that mortgage rates are up 69% under Biden.

That is in spite of $2.5 TRILLION in agency MBS being held on The Fed’s balance sheet.
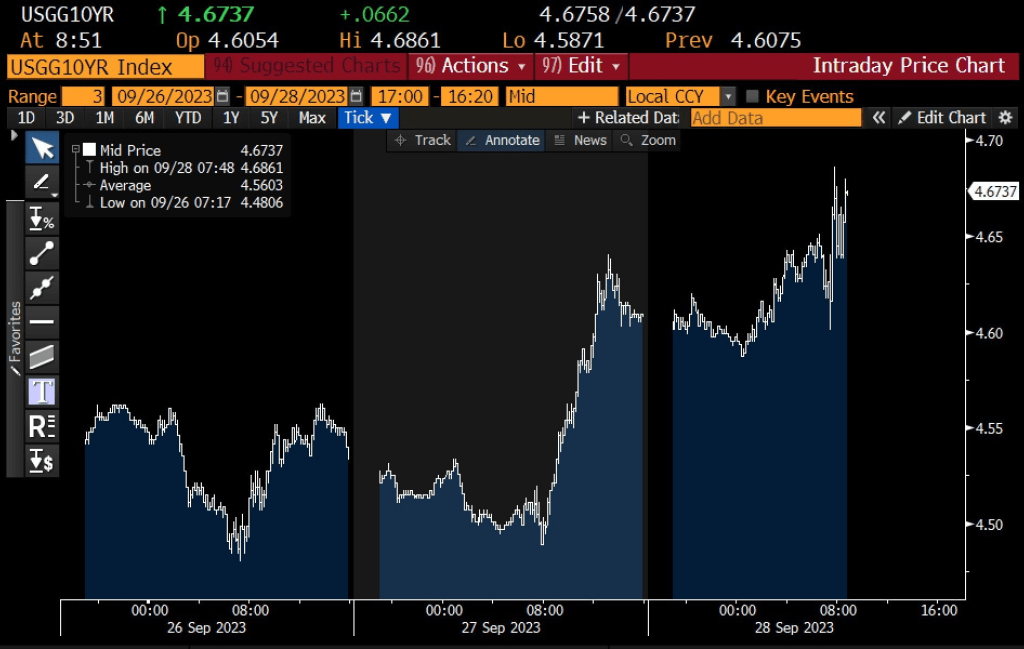
As the 10-year Treasury yield is up to 4.67%.
Wasting away again in Biden’s Mortgage Market! Looking for our lost economy.
Mortgage rates moved to their highest levels in over 20 years as Treasury yields increased late last week. The 30-year fixed mortgage rate increased to 7.41 percent, the highest rate since December 2000, and the 30-year fixed jumbo mortgage rate increased to 7.34 percent, the highest rate in the history of the jumbo rate series dating back to 2011.
The Market Composite Index, a measure of mortgage loan application volume, decreased 1.3 percent on a seasonally adjusted basis from one week earlier. On an unadjusted basis, the Index decreased 2 percent compared with the previous week. The Refinance Index decreased 1 percent from the previous week and was 21 percent lower than the same week one year ago. The seasonally adjusted Purchase Index decreased 2 percent from one week earlier. The unadjusted Purchase Index decreased 2 percent compared with the previous week and was 27 percent lower than the same week one year ago.

Biden’s press secretary Karine Jean-Pierre said that Biden was laser focused on reducing inflation. At least he isn’t laser focused on little girls … for the moment. But he still does seem laser focused on providing Ukraine with billions of dollars.
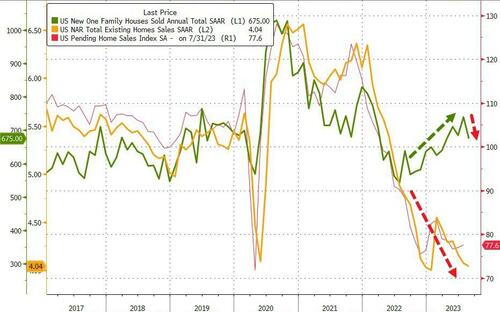
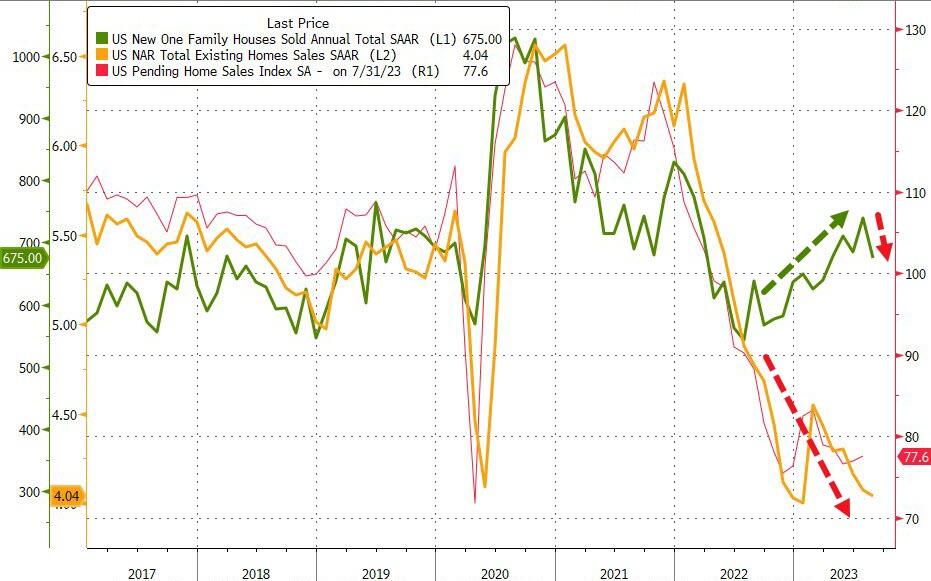
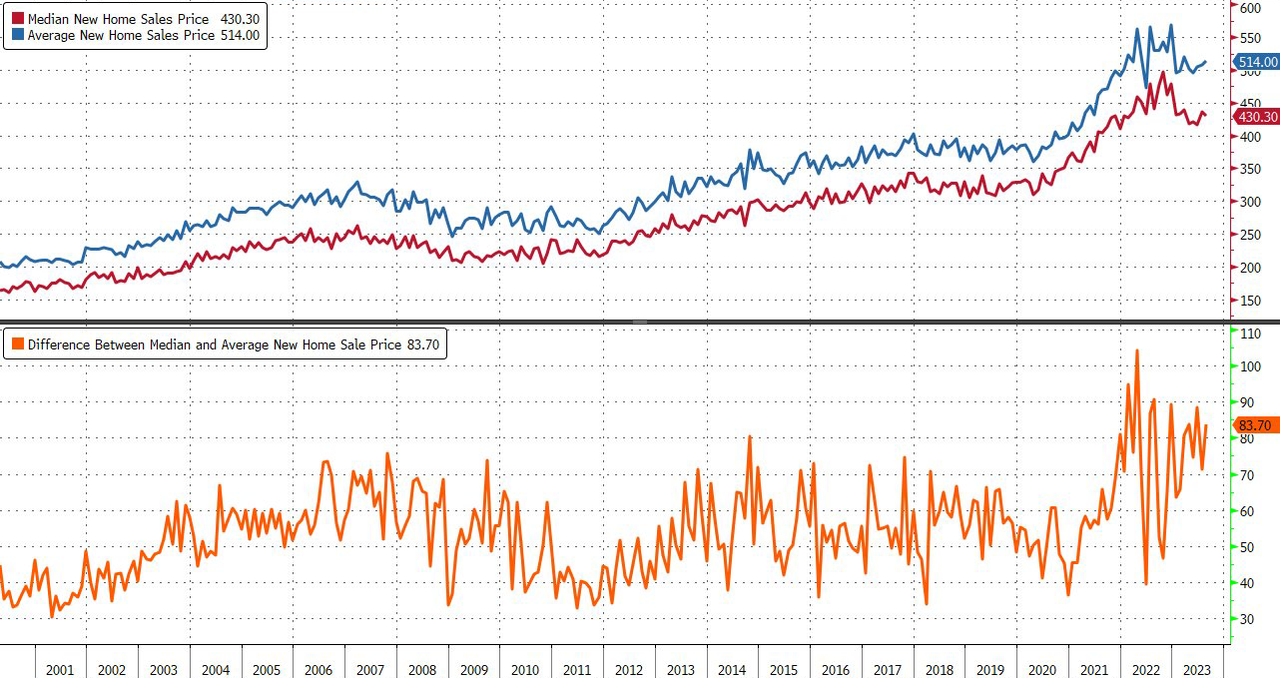
After months of soaring in the face of higher mortgage rates (and higher prices), new home sales hit a wall in August, crashing 8.7% MoM – the biggest drop since Sept 2022 (and four times worse than the -2.2% MoM expected)…
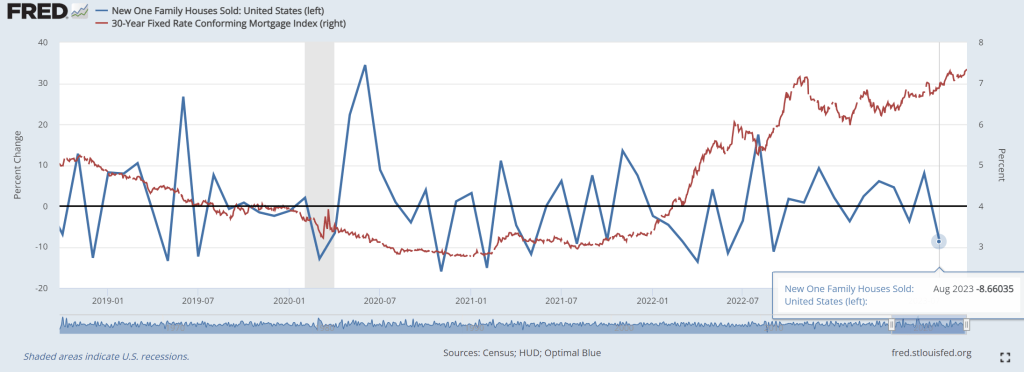
But at least new home sales were up on a YoY basis.

hat is the lowest SAAR since March…
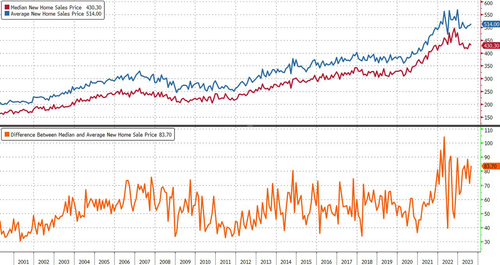
The median sales price of a new home edged lower to $430,300 (average home price rose), according to the Commerce Department’s report.
Despite the decline, that’s still well above pre-pandemic levels.
As a reminder, according to a report released Friday by Redfin Corp, nearly 60,000 deals to purchase homes fell through in August (roughly 16% of homes that went under contract last month, the biggest share of cancellations since October).
“I’ve seen more homebuyers cancel deals in the last six months than I’ve seen at any point during my 24 years of working in real estate,” Jaime Moore, a Redfin agent, said in the report.
“They’re getting cold feet.”
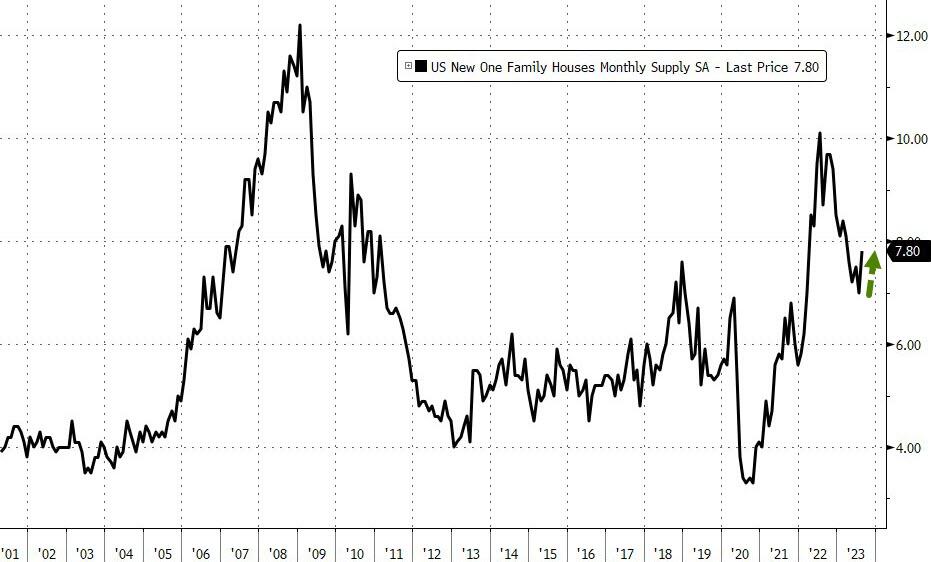
A potential silver lining is the rising in supply (but now much that is driven by a decline in the denominator – homes sold – vs numerator – homes available; is unclear)…
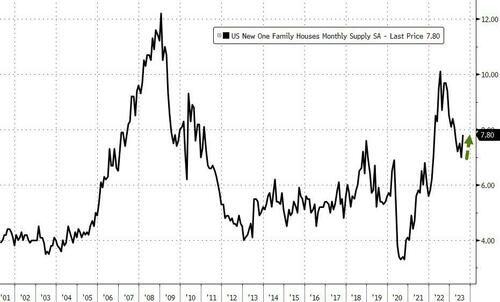
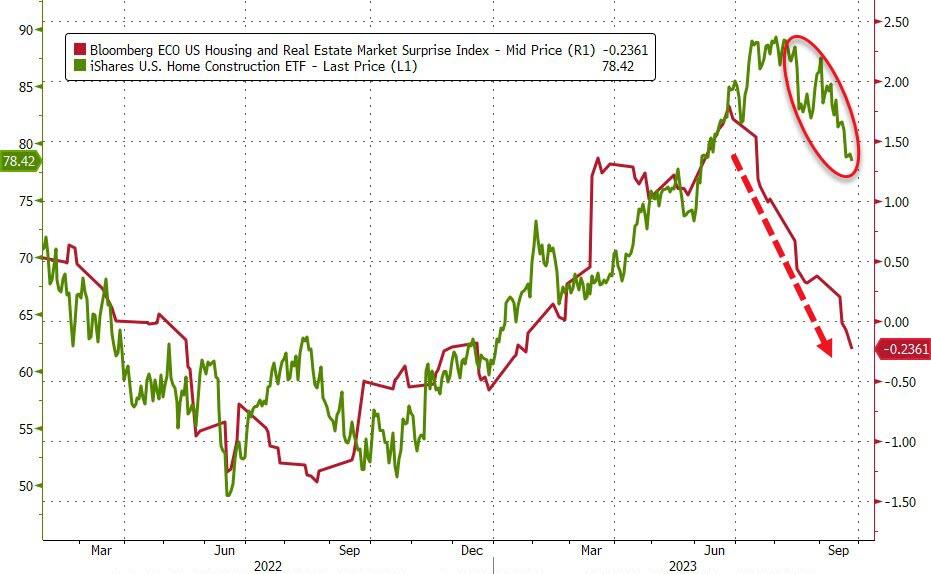
Is the catch-down to reality about to begin?

Source: Bloomberg
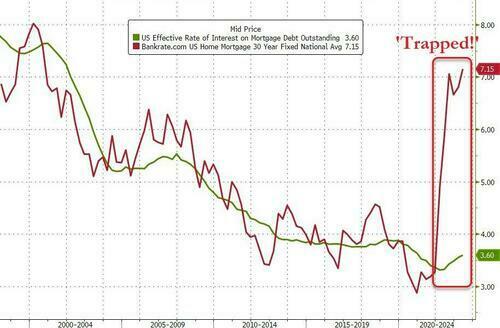
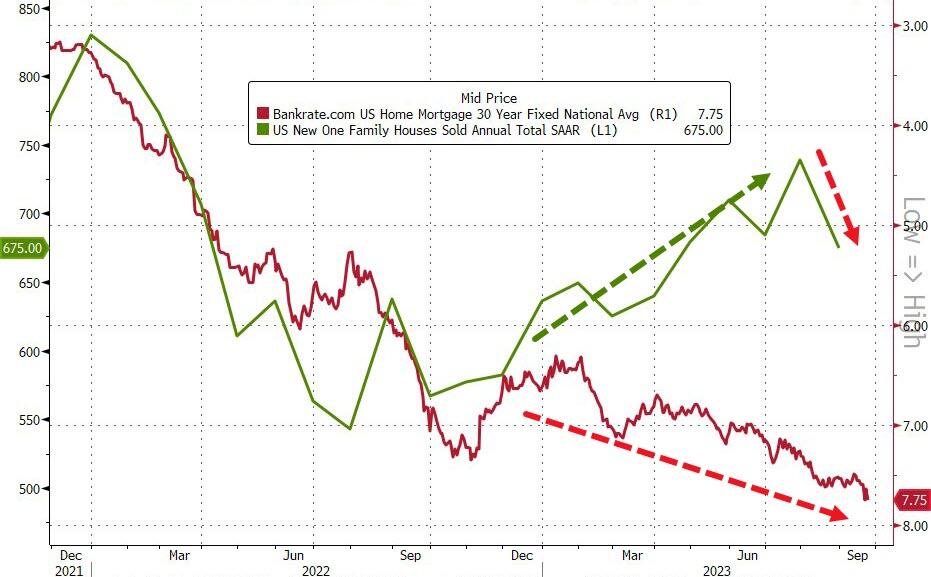
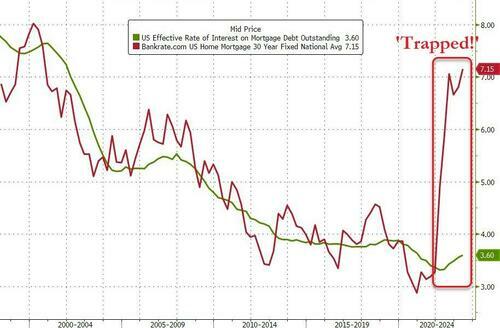
They should, given that homebuilders can’t be filling this gap – between the current 30Y mortgage rate and the effective rates that borrowers are currently paying on their home loans – (i.e. subsidizing new home sales) forever…
Source: Bloomberg
And investors are starting to wake up too…

Is Jay Powell about to get the ‘affordability’ compression he was hoping for?

Thanks to rampant Federal spending and overstimulus by The Federal Reserve, US housing prices are simply unaffordable for many. Particularly since the Covid epidemic (Wuhan China Flu).
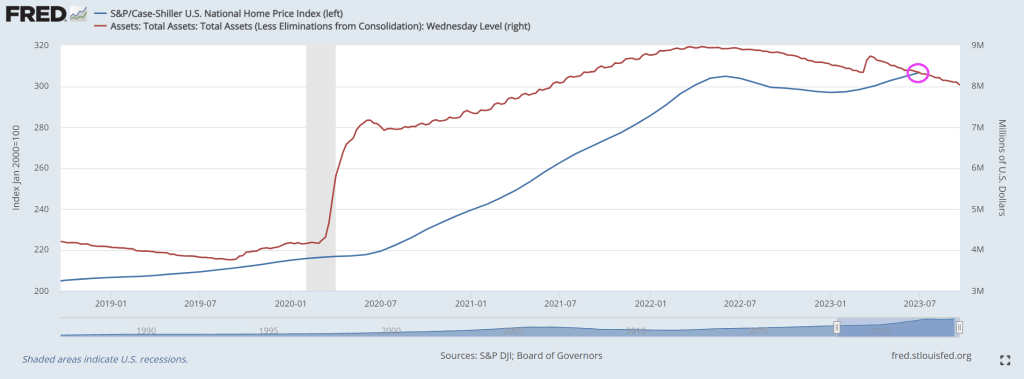
The S&P CoreLogic Case-Shiller U.S. National Home Price NSA Index, covering all nine U.S. census divisions, reported 1.0% annual change in July, up from a 0% change in the previous month.
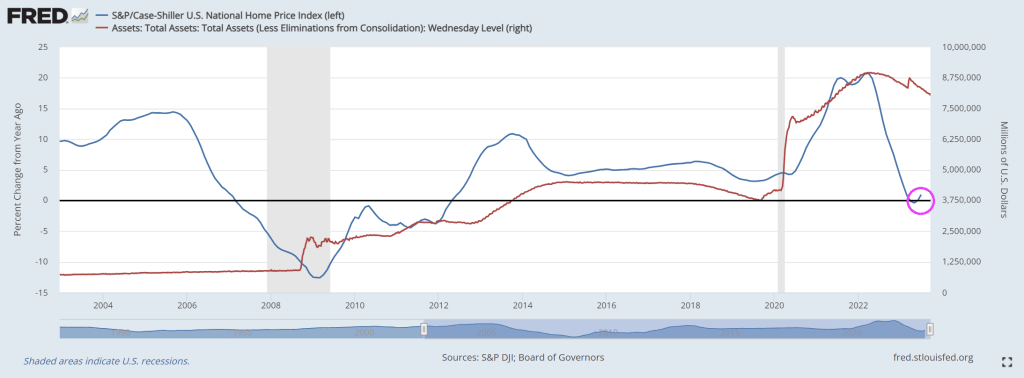
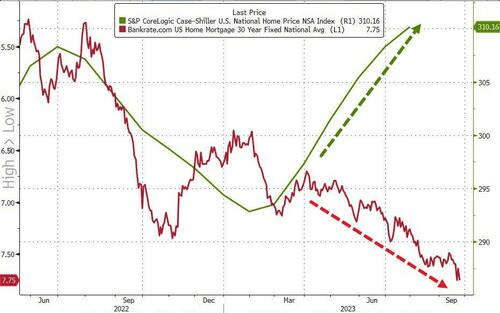
Yes, home prices grew in July despite rising mortgage rates. As CS Lewis wrote “That Hideous Strength” but this is about how The Fed doesn’t understand what they have done.
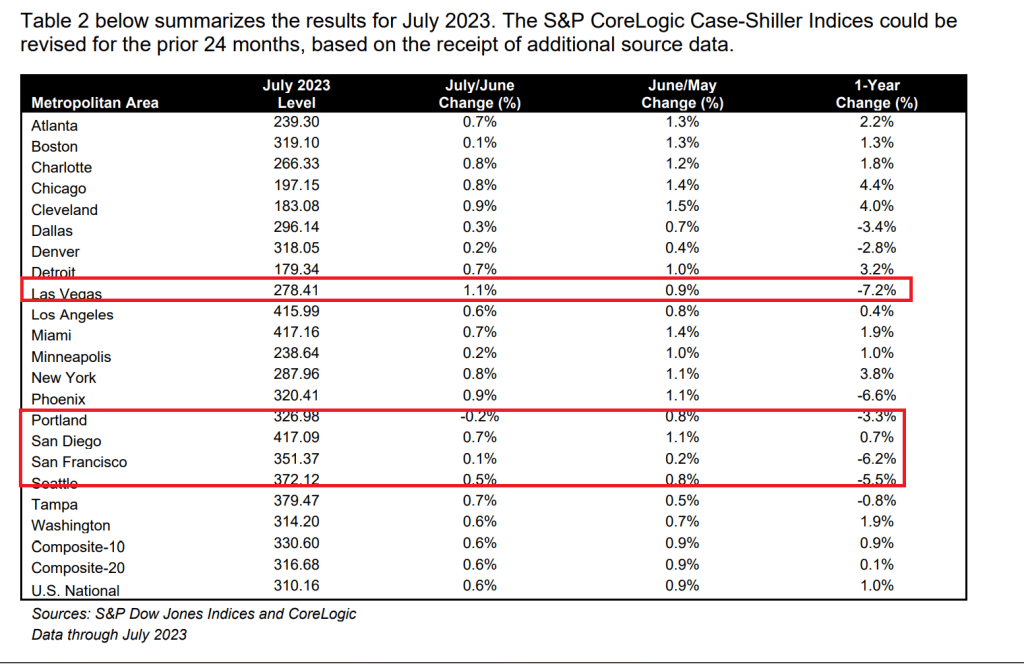
At the metro level, Las Vegas leads in YoY price declines at -7.2%. In a close second is San Francisco at -6.2%. Portland and Seattle also declined.
Here is Screamin’ Joe Biden. You know Biden is lying when he gets angry.

Donald Trump was famous for his “Make America Great Again!” campaign. Joe Biden seems to want to make America LAST again (MALA).
A newly aired “60 Minutes” segment entitled The unexpected way American tax dollars are being used in Ukraine has uncovered that the US government is paying the salaries of some 57,000 Ukrainian civic services personnel.
The report details the various ways non-military aid is being spent at a moment GOP Congressional leaders are intensely debating whether to move forward with a proposed defense budget that includes Biden’s push for $24 billion more in military assistance for Kiev.
“The U.S. has spent just over $43 billion on military aid to Ukraine since Russia invaded. That’s equivalent to about 5% of the American defense budget. European countries combined have contributed around $30 billion,” the 60 Minutes report narrates.
And this includes the following stunning detail:
American taxpayers are financing more than just weapons. We discovered the U.S. government’s buying seeds and fertilizer for Ukrainian farmers… and covering the salaries of Ukraine’s first responders – all 57,000 of them.
That includes the team that trains this rescue dog – named Joy – to comb through the wreckage of Russian strikes looking for survivors.
Political commentator Collin Rugg has noted in relation to the potential government shutdown looming for Oct. 1st: “Yes, your tax dollars will be used to fund Ukrainian salaries while American citizens are forced to wait for their pay while the government remains closed,” he said on X.
Rugg is referencing the fact that the Biden administration and Pentagon have declared that Ukraine aid will remain exempt from any potential government shutdown. This means Ukrainian salaries will still be paid, even while federal employees aren’t, in the event of a shutdown.
Here’s more from the 60 Minutes video, featuring a Ukrainian woman “thanking” US taxpayers for footing the bill for Ukrainian employees, thanks to USAID funding:
Tatiana Abramova: Especially in the condition of war, we have to work. We have to pay taxes, we have to pay wage– salary to our employees. We have to work, don’t stop.
Holly Williams: Why does that help Ukraine win the war?
Tatiana Abramova: Because economy is the foundation of everything.
American officials from USAID – the agency in charge of international development – helped Abramova find new customers overseas. In the midst of war, her company is supporting over 70 families.
Meanwhile, a fresh Newsweek headline: US Will Pay Salaries to Thousands of Ukrainians During Government Shutdown…
“US taxpayers will pay the salaries of thousands of Ukrainians, even as the country faces a government shutdown at the end of September.”
But as noted above, this is more like tens of thousands of Ukrainian salaries.
“A federal government shut down will effectively begin on October 1 if Congress isn’t able to pass a funding plan that Biden signs into law,” Newsweek underscores. “If that happens, federal agencies have to stop all nonessential work and will not send paychecks for as long as the shutdown lasts.”
Appropriately, the 60 Minutes episode invoked memory of the late John McCain…
In total, America’s pumped nearly $25 billion of non-military aid into Ukraine’s economy since the invasion began – and you can see it working at the bustling farmers market on John McCain Street in central Kyiv.
The late senator is revered in Ukraine because he pushed the U.S. government to start sending arms to the country… back in 2014.
Here’s how 60 Minutes presents bipartisan support for Biden’s blank check for Ukraine:
While in Kyiv, we learned that three of McCain’s former colleagues were also in town: Democratic Sens. Elizabeth Warren and Richard Blumenthal and Republican Sen. Lindsey Graham. They don’t normally agree on much – together, though, they’re some of the staunchest supporters of U.S. funding for Ukraine’s resistance.
Indeed Zelensky himself while meeting with US Senators in Washington last week said something similar – that without continuing American funds, the war effort is doomed. He urged Congress to keep the billions in aid flowing, and sought to present that Moscow will one day expand aggression beyond just Ukraine.
* * *
Meanwhile, the “aid from the heart of every ordinary American person” will continue (whether those ordinary Americans like or not)…
While Biden seems obsessed with protected Ukraine’s sovereign border, he has left the US southern border wide open. There have been OVER 5.8 MILLION illegal crossings of our southern border.
So, Old Joe Biden is Making America Last Again (MALA)!


You must be logged in to post a comment.