Mortgage Applications Dropped To Lowest Since 1996 As Purchase Applications Drop -22.2% WoW, -38.5% 2WoW, -42% YoY (Refi Apps Down -87% YoY)

Mortgage applications generally nosedive in the last two weeks of the year (seasonality effect), but Federal Reserce monetary tightening to fight inflation is making the last two weeks worse than usual.

Mortgage applications decreased 13.2 percent from two weeks earlier, according to data from the Mortgage Bankers Association’s (MBA) Weekly Mortgage Applications Survey for the week ending December 30, 2022. The results include adjustments to account for the holidays. It marked the lowest mortgage applications since 1996.

The Market Composite Index, a measure of mortgage loan application volume, decreased 13.2 percent on a seasonally adjusted basis from two weeks earlier. On an unadjusted basis, the Index decreased 39.4 percent compared with the two weeks ago. The holiday adjusted Refinance Index decreased 16.3 percent from the two weeks ago (2WoW) and was 87 percent lower than the same week one year ago (YoY). The seasonally adjusted Purchase Index decreased 12.2 percent from two weeks earlier. The unadjusted Purchase Index decreased 38.5 percent compared with the two weeks ago and was 42 percent lower than the same week one year ago.

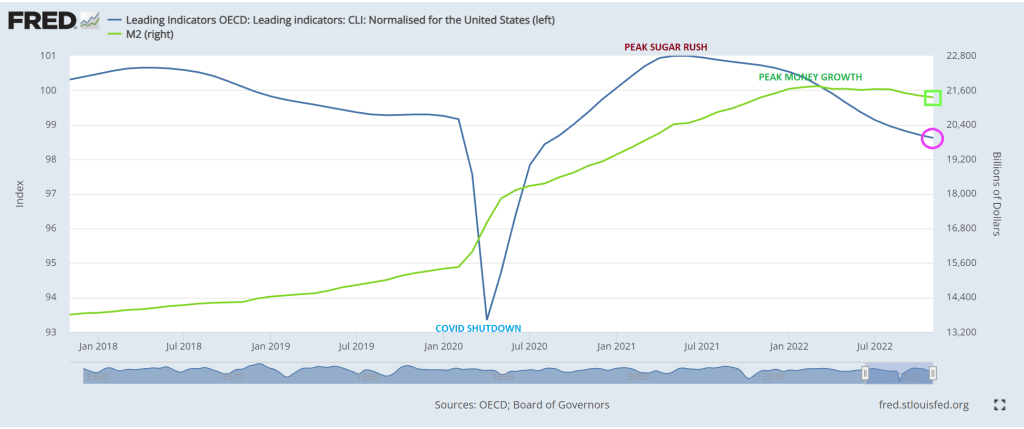
Notice that purchase applications are declining with slowing M2 Money growth showing the impact of The Fed trying to remove the punchbowl.

The week-over-week (or WoW) numbers are pretty bad.

Something Happening? Fed Repos Soar To $2.55 Trillion As US Treasury Yields Tank -14.5 Basis Points (Mortgage Rates To Decline)

There is something happening in markets this morning. And its not good.

First, banks are stashing cash with the New York Fed on an “overnight basis” although it is looking pretty permanent to me. Repos (or repuchase agreements) soared to $2.55 TRILLION as of 12/30/22.

But this morning we see the US Treasury 10-year plummeting -15 basis points. As I used to tell my University of Chicago, Ohio State and George Mason finance students, any 10 basis point shift (plus or minus) is a big deal. Something is happening.

The 10-year Treasury yield plunging -15 bps is a “good thing” for the mortgage market in that US mortgage rates will likely follow suit and fall.

US Housing Leading Growth Index Slumps To Lowest Since 1982 And 2008 Recessions (Fed Pivot Coming?)

As we begin 2023 (and I am still bummed-out over Ohio State University losing a nail-bitter to Georgia in the Peach Bowl), we need to look at the condition of one of the most important sectors of the US economy.\, housing.

If we look at the US Housing Leading Growth index (courtesy of RecessionAlert.com) has slumped to its worst reading since the recessions of 1982 and 2008.

And then we have the OCED leading indicators for the US falling as M2 Money growth slows.

My favorite chart shows US home price growth falling faster than University of Michigan football team’s national championship home hopes.

Will this prompt The Federal Reserve to pivot? Only time will tell.

Hedging Inflation With Real Estate? NAREIT Index Fell “Only” -23.8% Since Last Year (NCREIF Index UP +9.4%)

We all know that US housing weakened in 2022 with inflation and The Fed’s counterattack. But what about equity real estate investment trusts (REITs) and commercial real estate (NCREIF)?

The NAREIT all equity REITs index is down -23.8% since the same date one year ago. Hey, that is better than Cathie Wood’s ARK fund (down -68.4% YoY). Oddly, the NCREIF commerical real estate index was up +9.4% through Q3. Interesting to see the NCREIF index (red line) rising with The Fed Funds Target rate (dashed yellow line).

And US home prices are still growing, but the trend looks like the WWII German battleship Tirpitz sinking.

1253

US November Pending Home Sales Crash (-38.6% YoY) As Fed Tightens And M2 Money Growth Grinds To A Near Halt

US existing home sales in November collapsed by -38.6% YoY as M2 Money growth runs out of gas.

The above chart is similar to yesterday’s “Ski Slope” chart of US home prices YoY.

Unfortunately, pending home sales YoY are the worst in recorded history.

What will President Biden do about this dire situation? Our “Vacationer in Chief” is off on yet another vacation to St. Croix in the US Virgin Islands, so probably nothing. Now that Biden is sunbathing, what will his Treasury Secretary Janet Yellen do?

Let It Blizzard? Home Sales Slumped 35% in November, The Biggest Decline on Record

Let it snow! Or is it a blizzard?

Redfin released a terrible housing report showing that home sales fell a gut-wrenching 35% in November, the largest on record since Redfin has been collecting data.

Hopefully mortgage rates will continue to decline in 2023!

Merry Christmas from sub-zero Columbus Ohio where it is snowing with 50 mph gusts. Brrrrrr.

US New Home Sales Rose 5.8% MoM In November, But DOWN -15.3% YoY For The Ninth Straight Month (M2 Money Is Vanishing)

A classic good news, bad news story. The good news? US new home sales rose 5.8% in November, better that the expected -5.1%, The bad news? On a year-over-year basis, US new home sales FELL

Sales of new US homes unexpectedly rose in November, suggesting some stabilization in demand as mortgage rates eased late in the month from their highs.

Purchases of new single-family homes increased 5.8% to an annualized 640,000 pace last month after rising in October, government data showed Friday.

A mid-month retreat in 30-year mortgage rates back below 7% along with an increase in builder incentives may have helped support demand. Still, the sales data are volatile from month to month. With home prices remaining elevated and the Federal Reserve poised to raise interest rates further, headwinds for the housing market will persist into 2023.

The increase in sales last month was concentrated in the West and Midwest.

The report, produced by the Census Bureau and the Department of Housing and Urban Development, showed the median sales price of a new home was up 9.5% from a year earlier to $471,200.

There were 461,000 new homes for sale as of the end of last month, though the grand majority remain under construction or not yet started. The number of homes sold in November and awaiting the start of construction — a measure of backlogs — rose to the highest since the beginning of the year.

But for all the cheerleading, new home sales were DOWN -15.3% on a year-over-year basis. The ninth straight month of negative new home sales growth.

At least the median price of new home sales was down -2.79% from October to November.

Misery! US Real GDP Remains Below 2% YoY As Core PCE (Inflation) Rises And Remains Near 5% YoY (Misery Index Remains Elevated At 12%)

Its another slow growth economic report for the Biden Administration. So much stimulus, so little to show for it other than painful inflation.

On a year-over-year (YoY) basis, US real GDP rose to a measly 1.9%. US core PCE YoY fell slightly to 4.93%. M2 Money growth is at 2.6% YoY.

The Misery Index (U-3 inflation rate + inflation) remains elevated and above 10% (it currently clocks-in at 12%), far above the pre-Covid reading of around 5%.

Here is the rest of the story. On a quarter-over-quarter basis, real GDP rose to 3.2% QoQ. Personal consumption rose 2.3% QoQ. Core PCE (Personal Consumption Expenditures) rose to 4.7% QoQ. If we use core PCE as a measure of inflation, inflation is rising.

Here is a video of Fed Chair Jerome Powell (doubling as President Joe Biden) saying creating inflation and then raising interest rates to fight it “It’s for the best.”

US Existing Home Sales Plunge -35.4% In November, 16 Straight Months Of Negative YoY Growth (Median Price YoY Falls To 3.21% As Fed Stimulus Wears Out)

One of the big problems with Federal goverment and Federal Reserve monetary stimulus is … it wears out. Just look at M2 Money growth.

US existing homes sales fell -7.70% in November to 4.09 million units SAAR. And since the same month last year, existing home sales are down -35.4% YoY.

Existing home sales were the lowest in November since 2010.

The good news? The median price of existing homes fell to 3.21% YoY. The bad news? The ark is really bad pointing to a bad December. Inventory for sale (orange line) remains below pre-Covid shutdown levels.

Of course, will the Federal government and Federal Reserve come riding to the rescue of the housing market … again? It looks like The Fed is thinking about it.

Mortgage Bomb Cyclone! Mortgage Rates Drop 82 Basis Points Since October 21, Yet Purchase Apps Down -17.25% (Purchase Apps Down 36% Since Last Year, Refi Apps Down 85% Since Last Year)

The mortgage market is behaving like today’s bomb cyclone in terms of the weather. Bomb cyclone in that mortgage rates have dropped 7.16% on October 21, 2022 to 6.34% on December 16, 2022 (a drop of 82 basis points), but mortgage purchase and refinancing applications are not increasing like one would hope.

Mortgage applications increased 0.9 percent from one week earlier, according to data from the Mortgage Bankers Association’s (MBA) Weekly Mortgage Applications Survey for the week ending December 16, 2022.

The Refinance Index increased 6 percent from the previous week and was 85 percent lower than the same week one year ago. The seasonally adjusted Purchase Index decreased 0.1 percent from one week earlier. The unadjusted Purchase Index decreased 3 percent compared with the previous week and was 36 percent lower than the same week one year ago.

But remember, The Federal Reserve is going to be lowering their target rate after they keep raising it.