MBA Purchase Applications Drop -.58% Since Last Week, Refi Apps Rise 3.15% WoW As Mortgage Rates Declined 3rd Straight Week (Purchase Apps Down -39% Since Same Week Last Year, Refi Apps Down 77%)

Falling mortgage rates are having a predictible effect on mortgage refinancing applications, but not so much for mortgage purchase applications.

Mortgage applications increased 7.0 percent from one week earlier, according to data from the Mortgage Bankers Association’s (MBA) Weekly Mortgage Applications Survey for the week ending January 20, 2023. This week’s results include an adjustment for the observance of Martin Luther King, Jr. Day.

The Refinance Index increased 3.15 percent from the previous week and was 77 percent lower than the same week one year ago. The unadjusted Purchase Index decreased 1 percent compared with the previous week and was 39 percent lower than the same week one year ago.

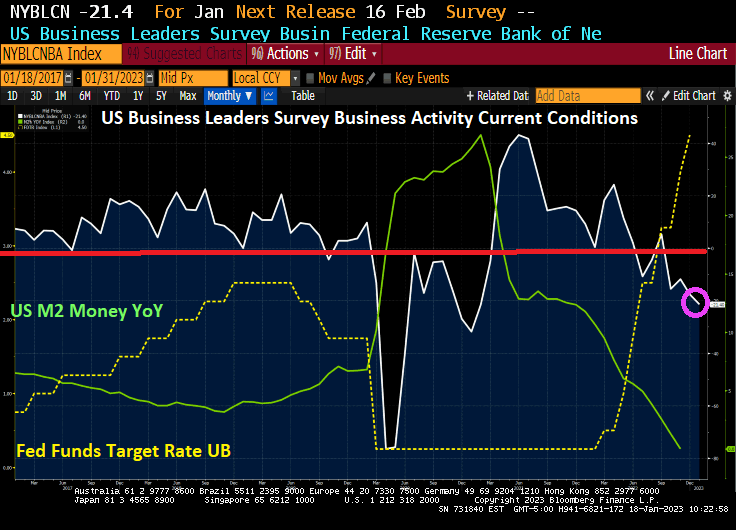
Generally speaking, declining mortgage rates are due to declining 10-year Treasury yields. And 10-year Treasury yields decline as the economy weakens. Of course, M2 Money growth YoY is now 0% as The Fed tightens.

On a humerous note, US Treasury Secretary Janet “The Evil Gnome” Yellen is visiting Africa and lecturing them on prudcnt sovereigh debt management. Seriously. China responded with “Fix the US debt problems before you lecture anyone else.”

Winter Is Coming! Richmond Fed Outlook Declines To -11 As Philly Fed Outlook Down To -8.9 And NY Empire State Outlook Down To -32.9 (US 10Y-3M Yield Curve Inverts To -126.5 Basis Points)

Three regional Fed reports I like to watch are New York’s Empire State Outlook, Philly Fed’s Outlook and Richmond Fed’s outlook. Today, The Richmond Fed released their manufacturing outlook and … it declined to -11.

So the big three are all down (Philly down to -8.9 while NY’s Empire State outlook is down to -32.9.

On the Treasury front, the US 10Y-3M yield curve inverted further (a signal of impending recession) just tanked to -126.462 basis points.

Winter is coming!

US Leading Indicator More Like Bleeding Indicator After 10 Straight Months Of Declines, Down -1% As M2 Money Growth Dies (Mortgage Rate Rises To 6.47%)

The Conference Board’s Leading Indicator should be called The Bleeding Indicator given that the leading index has declined to 10 straight months. This is happening as The Fed tightens monetary policy to combat inflation.

Leading indicators include economic variables that tend to move before changes in the overall economy. These indicators give a sense of the future state of an economy.

How about mortgage rates? Settling in a 6.47%.

The Great Biden/Pelosi/Schumer Powell (4 Horsemen) Inflation Tax In One Chart (Personal Savings DOWN -64.8%, Consumer Credit UP, Real Weekly Earnings Growth NEGATIVE For 21 Straight Weeks)

I must admit, Joe Biden has a horribly misleading nickname “Middle Class Joe.” Between Biden’s horrible energy policies and Pelosi’s/Schumer’s spending binges, the US middle class and low wage workers have suffered mightely with the inflation tax. Throw in Jerome Powell and The Federal Reserve’s manic money printing and the American middle class has a problem.

US inflation peaked at 9.1% year-over-year (YoY), but has declined to a still painful 7.1% YoY as The Fed removes it aggressive monetary stimulus. But to cope with persistent US inflation, consumers have had to dip into savings and use more credit cards. As a consequence, personal savings plunged -64.8% YoY while consumer credit rose 7.9% YoY.

The other tax on the middle class and low-wage workers is the 21 straight months of negative REAL weekly earnings growth.

On the housing front, REAL home prices are growing at 1.5% YoY while REAL weekly wage growth is still NEGATIVE at -3.13% YoY.

Make no mistake, inflation caused by The Fed and Federal governments spending is a tax on the middle class and low wage workers.

Biden, Pelosi, Schumer and Powell are the 4 Horseman of the Inflation Apocalypse.

Sign Of The Times? Citi Economic Surprise Index Falls To -17.70 As US CDS (Default Insurance) And Fed Reverse Repos Remain Elevated

Its a sign of the times!

First, US default risk as measured by credit default swaps remains elevated (primarily because Biden and Democrats refused to cut wasteful spending or reign in non-retirees on Social Security). And NY Fed’s Reverse Repos remain elevated.

And then we have Citi’s economic surprise index for the US at -17 as The Fed slows money growth to 0%.

I wish I knew a place where inflation and insane Federal government spending and policies doesn’t exist.

The Thrill Is Gone! US Existing Home Sales Decline -34% Year-over-year For 17 Straight Months (Median Price Of EHS Falls -1.53% MoM)

The Thrill Is Gone from the US housing market as M2 Money growth fells to 0%.

US Existing Home Sales fell -1.5% from November to December (MoM) to 4.02 SAAR units sold. That translates to a depressing -34% decline since December 2021 (YoY).

On the positive side, these numbers are better than expected (-3.4% MoM expected). Still, these numbers are pretty dismal.

Existing home sales MEDIAN PRICE fell to $366.9k as M2 Money growth vanishes. And inventory of existing homes for sale remains lower than pre-Covid levels.

Let’s see what Powell and the Gang (aka, The Federal Reserve Board of Governors) does with interest rates going forward.

Today, the 10-year Treasury yield is up 7.1 basis points, but the real action is in Europe where sovereign yields are up 11.5 bps in France, 9.8 bps in Germany and 18.6 bps in Italy.

Janet Yellen And Treasury Tap Retirement Funds (Social Security) to Avoid Breaching US Debt Limit (US CDS Elevated To 2013 Debt Crisis Level)

US Treasury Secretary Janet Yellen has signalled that she will “tap” into Social Security to avoid breaching the US debt limit. Of course, if she does, it is unlikely that she will return the dollars.

The Credit Default Swaps 1-year for the US (insurance against default) sits at 68.55, near the highest since 2013 debt ceiling crisis.

Notice that the debt ceiling keeps on climbing once the Kabuki Theater of Democrats and Republicans is over.

The Volatility Cube for the US CDS 1 year signals that it will all be over soon.

So, Yellen and Treasury are threatening us with taking away Social Security and Medicare if we don’t agree with their lavish Pelosi-like spending sprees and debt.

And why exactly is Janet Yellen flying to China? I admit Washington DC has lousy Chinese food, but at least I hope Yellen takes Hunter Biden with her to negotiate the impending US default and debt workout.

US Housing Starts Plunge -21.8% Since Last December (But 1 Unit Starts UP 11.26% Since November)

December’s housing construction numbers are a mixed bag. On the one hand, US housing starts are down -1.36% from November to December, but down -21,8% since December 2021 (YoY).

The good news? 1-unit (single family detatched) rose 11.26% from November to December (MoM). But 5+ (multifamily) starts are down -18.91% MoM.

But 5+ unit PERMITS are up 7.14%. Perhaps Hunter Biden can now rent an apartment rather than pay his father $50,000 a month in rent for Joe’s Wilmington Delaware house.

KB Homes experienced a 68% cancellation rate in Q4 2022.

This version of The Scream is one of four made by Edvard Munch, and the only one outside Norway. It is coming up for auction at Sotheby’s in New York.

‘Soft Landing’ Narrative Nuked As US Industrial Production Plunges In December And New York Biz Leaders Survey Crashes To -21.4 (US Treasury 10Y Yield Drops -14.1 Basis Points)

Soft landing for the US economy? It is looking less and less likely. The bond market (10-year Treasury yield) just shed -14.1 basis points. As I always told my investments students, any 10 basis point shift in the 10-year Treasury yield is significant.

Let’s start wit the US business leaders survey of current conditions. It just crashed to -21.4

Then we have US industrial production, down -0.7% in December. And is up only 1.65% year-over-year as M2 Money growth stalls.

Capacity Utilization plunged more than expected to 78.7% (79.5% exp).

Biden claiming the US economy is strong is pure Fantasy Island.

Today, Jean Pierre annouced that Biden’s economic plans are working.

Markets Are Strange! Mortgage Applications Rise 27.9% Since Previous Week, But Purchase Applications Remain 35% Lower Than Last Year (Refi Apps 81% Lower Than Last Year)

Markets are strange.

Mortgage applications increased 27.9 percent from one week earlier, according to data from the Mortgage Bankers Association’s (MBA) Weekly Mortgage Applications Survey for the week ending January 13, 2023. But mortgage applications are 60% lower than the same week last year.

The Refinance Index increased 34 percent from the previous week and was 81 percent lower than the same week one year ago. The seasonally adjusted Purchase Index increased 25 percent from one week earlier. The unadjusted Purchase Index increased 32 percent compared with the previous week and was 35 percent lower than the same week one year ago.

Here are the stats.

One lender in particular, Wells Fargo, smells blood in the economic waters, and has cut back mortgage originations.

Just remember, mortgage applications generally rise in the first part of the year until May, then start slowing until the last week of the year. This is called seasonality. But despite the fast growth this year, purchase applications are still down -35% compared to last year at this time.