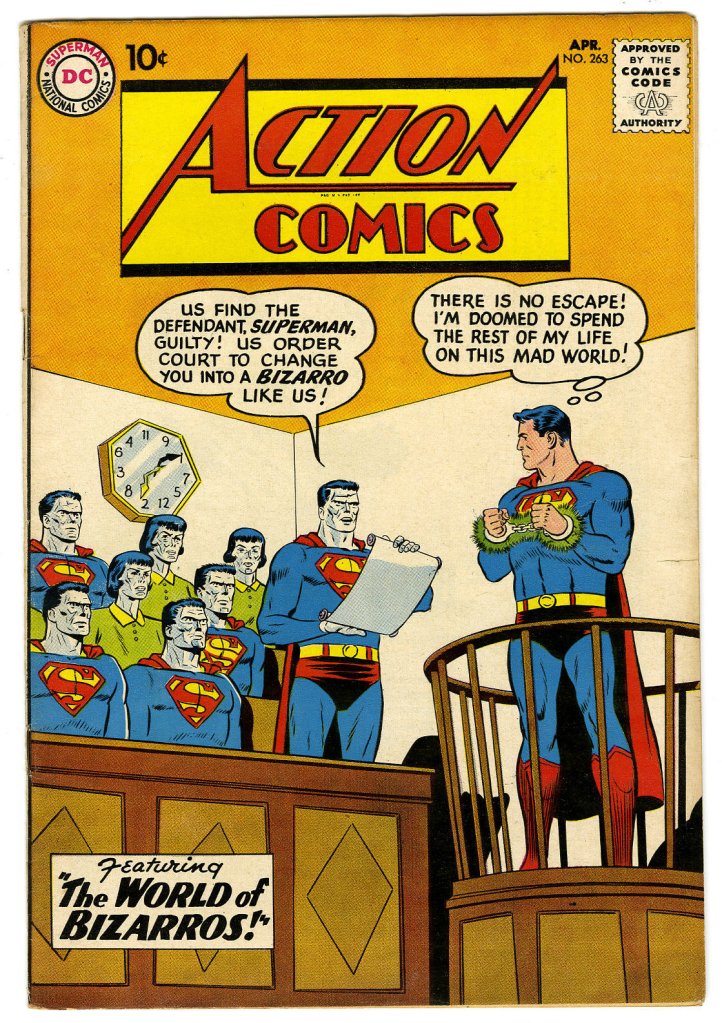
At least it wasn’t Mao Zedong on the quarter. Or Anthony Fauci.
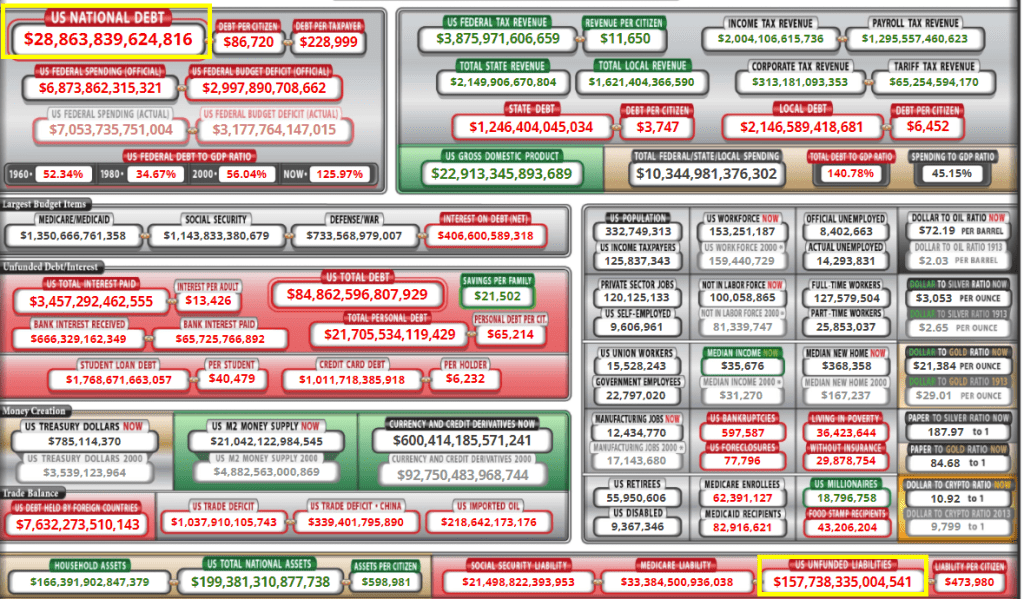
Here is Treasury Secretary Janet Yellen’s solution to the massive disconnect between the current outrageous government debt load and the entitlements promised by Congress. Other than a new quarter.
Like the poem, Casey At The Bat, the US economy struck out with a shockingly bad jobs report for September.
Oh, somewhere in this favored land the sun is shining bright; The band is playing somewhere, and somewhere hearts are light, And somewhere men are laughing, and somewhere children shout; But there is no joy in Mudville USA—mighty Casey Biden has struck out.
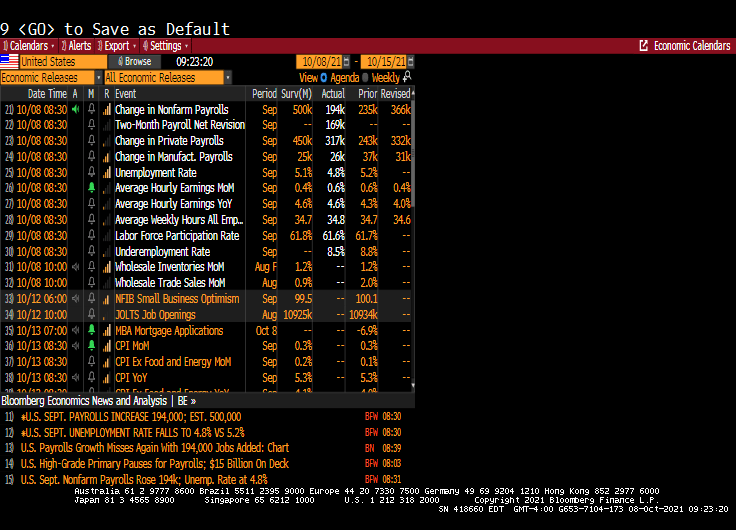
The U.S. economy added fewer jobs than forecast for a second straight month in September. Nonfarm payrolls increased by just 194,000 last month after an upwardly revised 366,000 gain in August, Labor Department figures showed Friday. 500K was expected.
The U-3 unemployment rate declined to 4.8% (meaning that the labor force shrank due to people dropping out of the labor force). In fact, 338,000 people dropped out of the labor force.
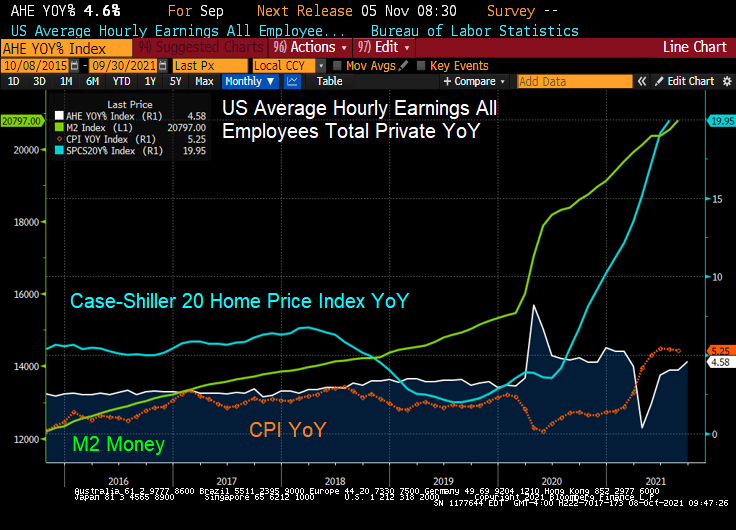
Average hourly earnings YoY rose to 4.6%. While that is an improvement, but it is lower than the inflation rate of 5.25% YoY and house price inflation of 20% YoY.
This miserable jobs report is a victory for Fed doves that don’t want to raise rates or slow down the balance sheet growth.
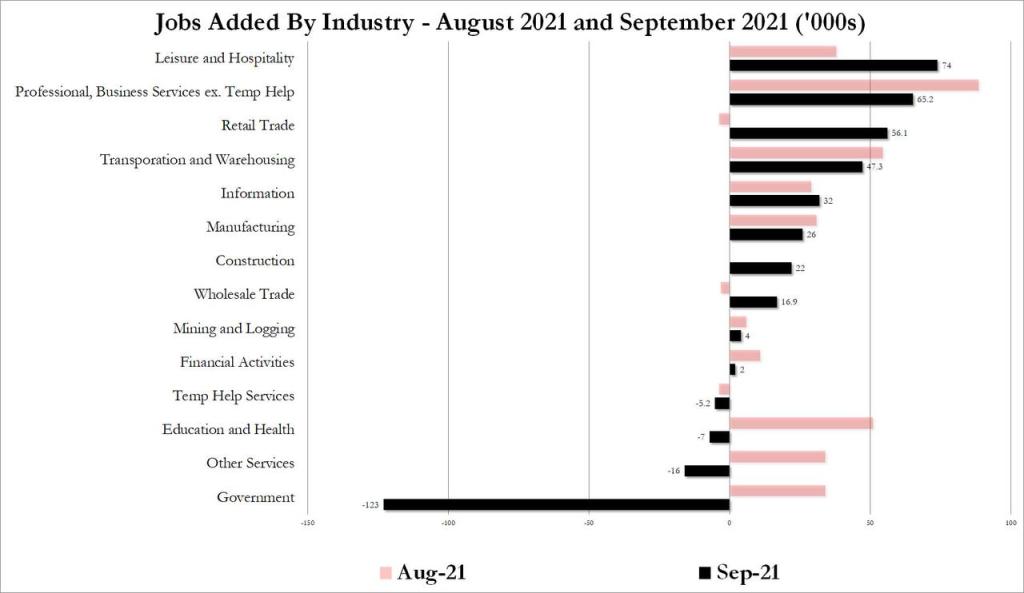
Where were the jobs created? Leisure and hospitality, as usual, leads in job gains.
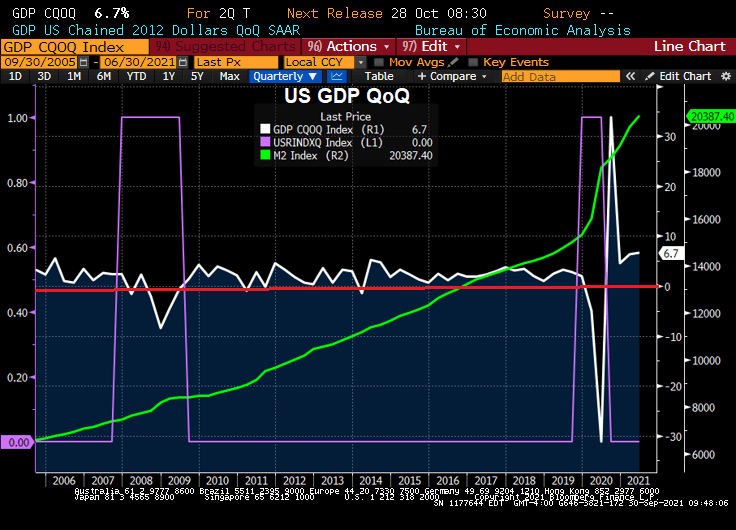
Well, Janet, we are headed there anyway with GDP crashing to a measly 1.33%.
The fear of not approving a debt ceiling increase (laughable since Democrats can do it on their own) has caused there to be a “little dipper” in the US Treasury actives curve. Meaning that the 1-month T-bill yield is higher than the 1-year T-bill yield.
The culprits? Declining auto sales, manufacturing, etc.
I have discussed soaring prices since Biden’s election (food, energy, housing, rent, etc). But another soaring price component is shipping costs. Up 315% since mid-February.
While Trump’s slogan was “Make American Great Again”, Biden and The Fed’s slogan should be “Make America Far More Expensive For The Middle Class.” But that won’t fit on a bumper sticker.
Since Joe Biden took office in January 2021, we have seen several actions from The White House. First, was the cancellation of the Keystone Pipeline (making the US more energy dependent on others). Second, Biden waived US sanctions on Russian pipeline to Germany. Big winner? Russia. Big loser? US consumers trying to heat their homes.
Here is a chart of natural gas prices since Biden took office in January.
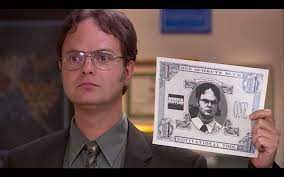
Biden reminds me of Dwight Schrute from the TV show “The Office” as he loves to punish people. In this case, families trying to heat their home. And have his own currency, Schrute Bucks.
Perhaps The Federal Reserve should rename the US Dollar as “Biden Bucks.”
Central banks are turning “hawkish” in the face of inflation.
(Bloomberg) — Treasuries fell, sending 10-year yields to a three-month high, as traders braced for a testing week of heavy bond auctions and continued to digest the prospect that central banks in the U.S. and Europe will step up the pace of policy tightening.
The yield on 10-year Treasuries reached 1.51%, the highest since June, before settling at 1.48%. The yield has climbed 16 basis points over the past week as the Federal Reserve signaled it may start reducing its asset purchases in November and raising rates as soon as next year. Yields on two- and five-year Treasuries hit their highest levels since early 2020, with a combined $121 billion of the securities set to be sold Monday. A seven-year auction is due Tuesday.
While Treasuries briefly extended the selloff after a report showed durable goods orders exceeded economists’ forecasts, they started to pare losses after U.S. equity futures soured.
Bond yields increased across the globe last week as central banks move to reduce pandemic stimulus. The Bank of England surprised markets by raising the prospect of increasing rates as soon as November, and Norway delivered the first post-crisis hike among Group-of-10 countries. In the U.S., traders pulled forward wagers on an interest-rate increase to the end of 2022 following last week’s Fed meeting.
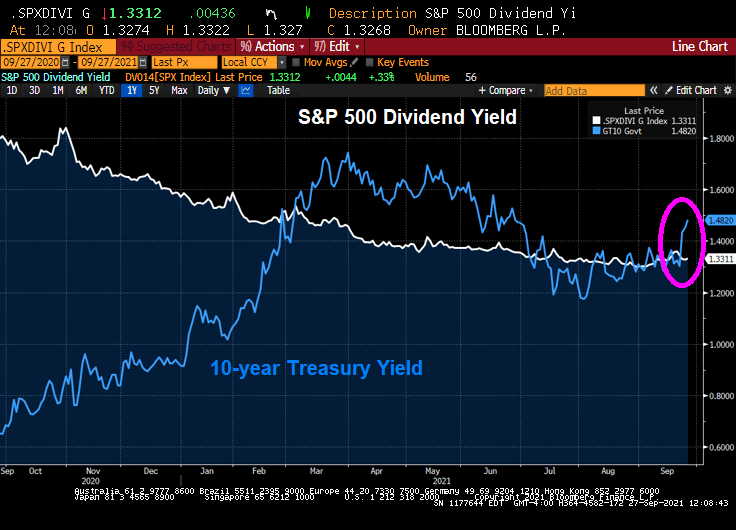
On the equity side, FAANG stocks trail the S&P 500 as 10-year Treasury yield climb.
We have the 10-year Treasury yield climbing above the S&P 500 dividend yield.
Phil Hall of Benzinga wrote a series of excellent articles in four parts for MortgageOrb (although “The Orb” has removed his name). Here are the links to his stories.
After re-reading these excellent articles on the housing bubble and crash, I thought I would take the opportunity to present a few charts to highlight the housing bubble, pre-crash and post-crash.
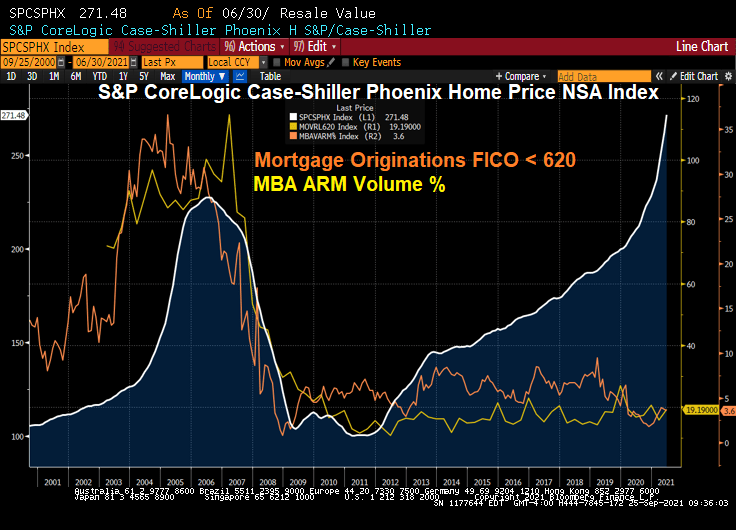
Here is a graph of Phoenix AZ home prices. Note the bubble that peaked in mid 2006. The Phoenix bubble correlates with the large volume of sub-620 FICO lending and Adjustable-rate mortgage (ARM) lending. Bear in mind, many of the ARMs prior to 2010 were NINJA (no income, no job) ARM loans.
What happened? Serious delinquenices at the national levels spiked as The Great Recession set in and unemployment spiked.
Since the housing bubble burst and surge in serious mortgage delinquencies, The Federal Reserve entered the economy with a vengeance. And have never left, and increased their drowning of markets with liquidity.
The Fed whip-sawing of interest rates in response to the 2001 recession was certainly a problem. They dropped The Fed Funds Target rate like a rock, then homebuilding went wild nationally and home prices soared thanks to Alt-A (NINJA) and ARM lending. But now The Fed is dominating markets like a gigantic T-Rex.
Oddly, then Fed Chair Ben Bernanke never saw the bubble coming. Or the burst.
Speaking of pizza, Donato’s from Columbus Ohio is my favorite. Founder’s Favorite is my favorite, but they do offer the dreaded Hawaiian pizza (ham, pineapple, almonds and … cinnamon?)
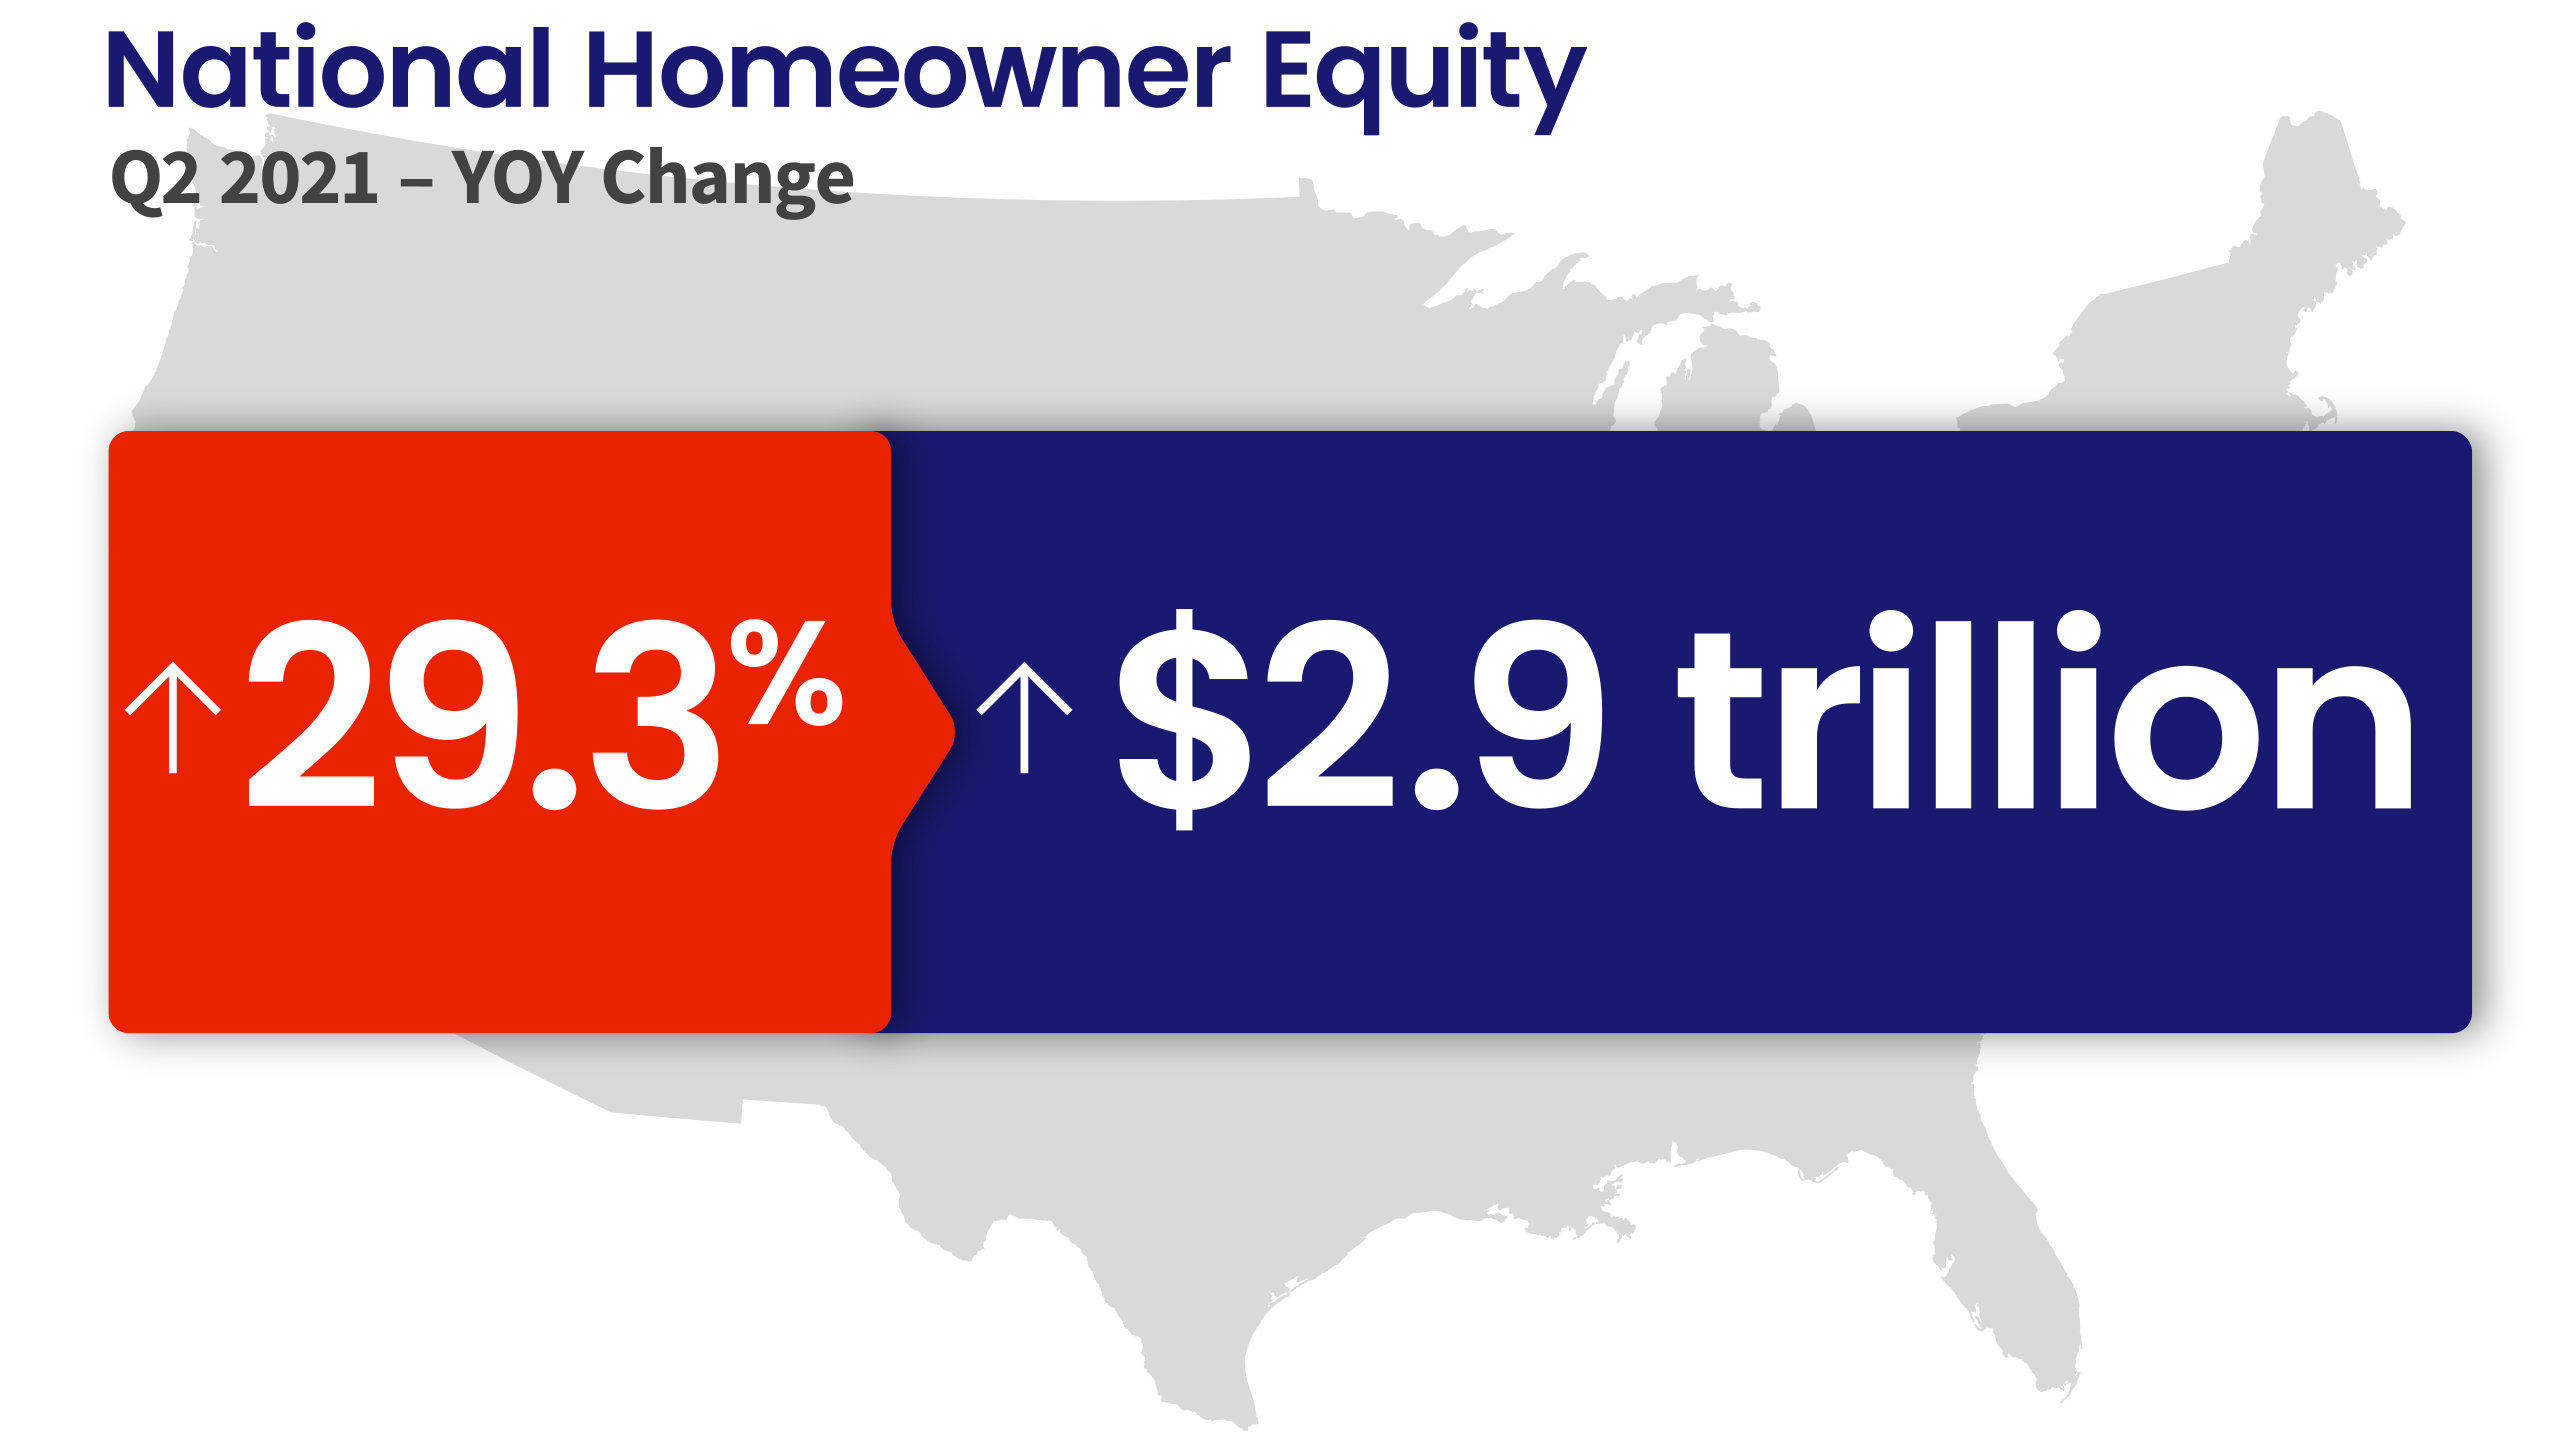
Since Q2 2020, US homeowners have been big winners in terms of home price gains and equity in their homes. Unfortunately, this means that renters are big losers. Once again, The Federal Reserve is benefiting once segment of the population while punishing the other segment.
*Homeownership mortgage source: 2016 American Community Survey.
National Homeowner Equity
In the second quarter of 2021, the average homeowner gained approximately $51,500 in equity during the past year.
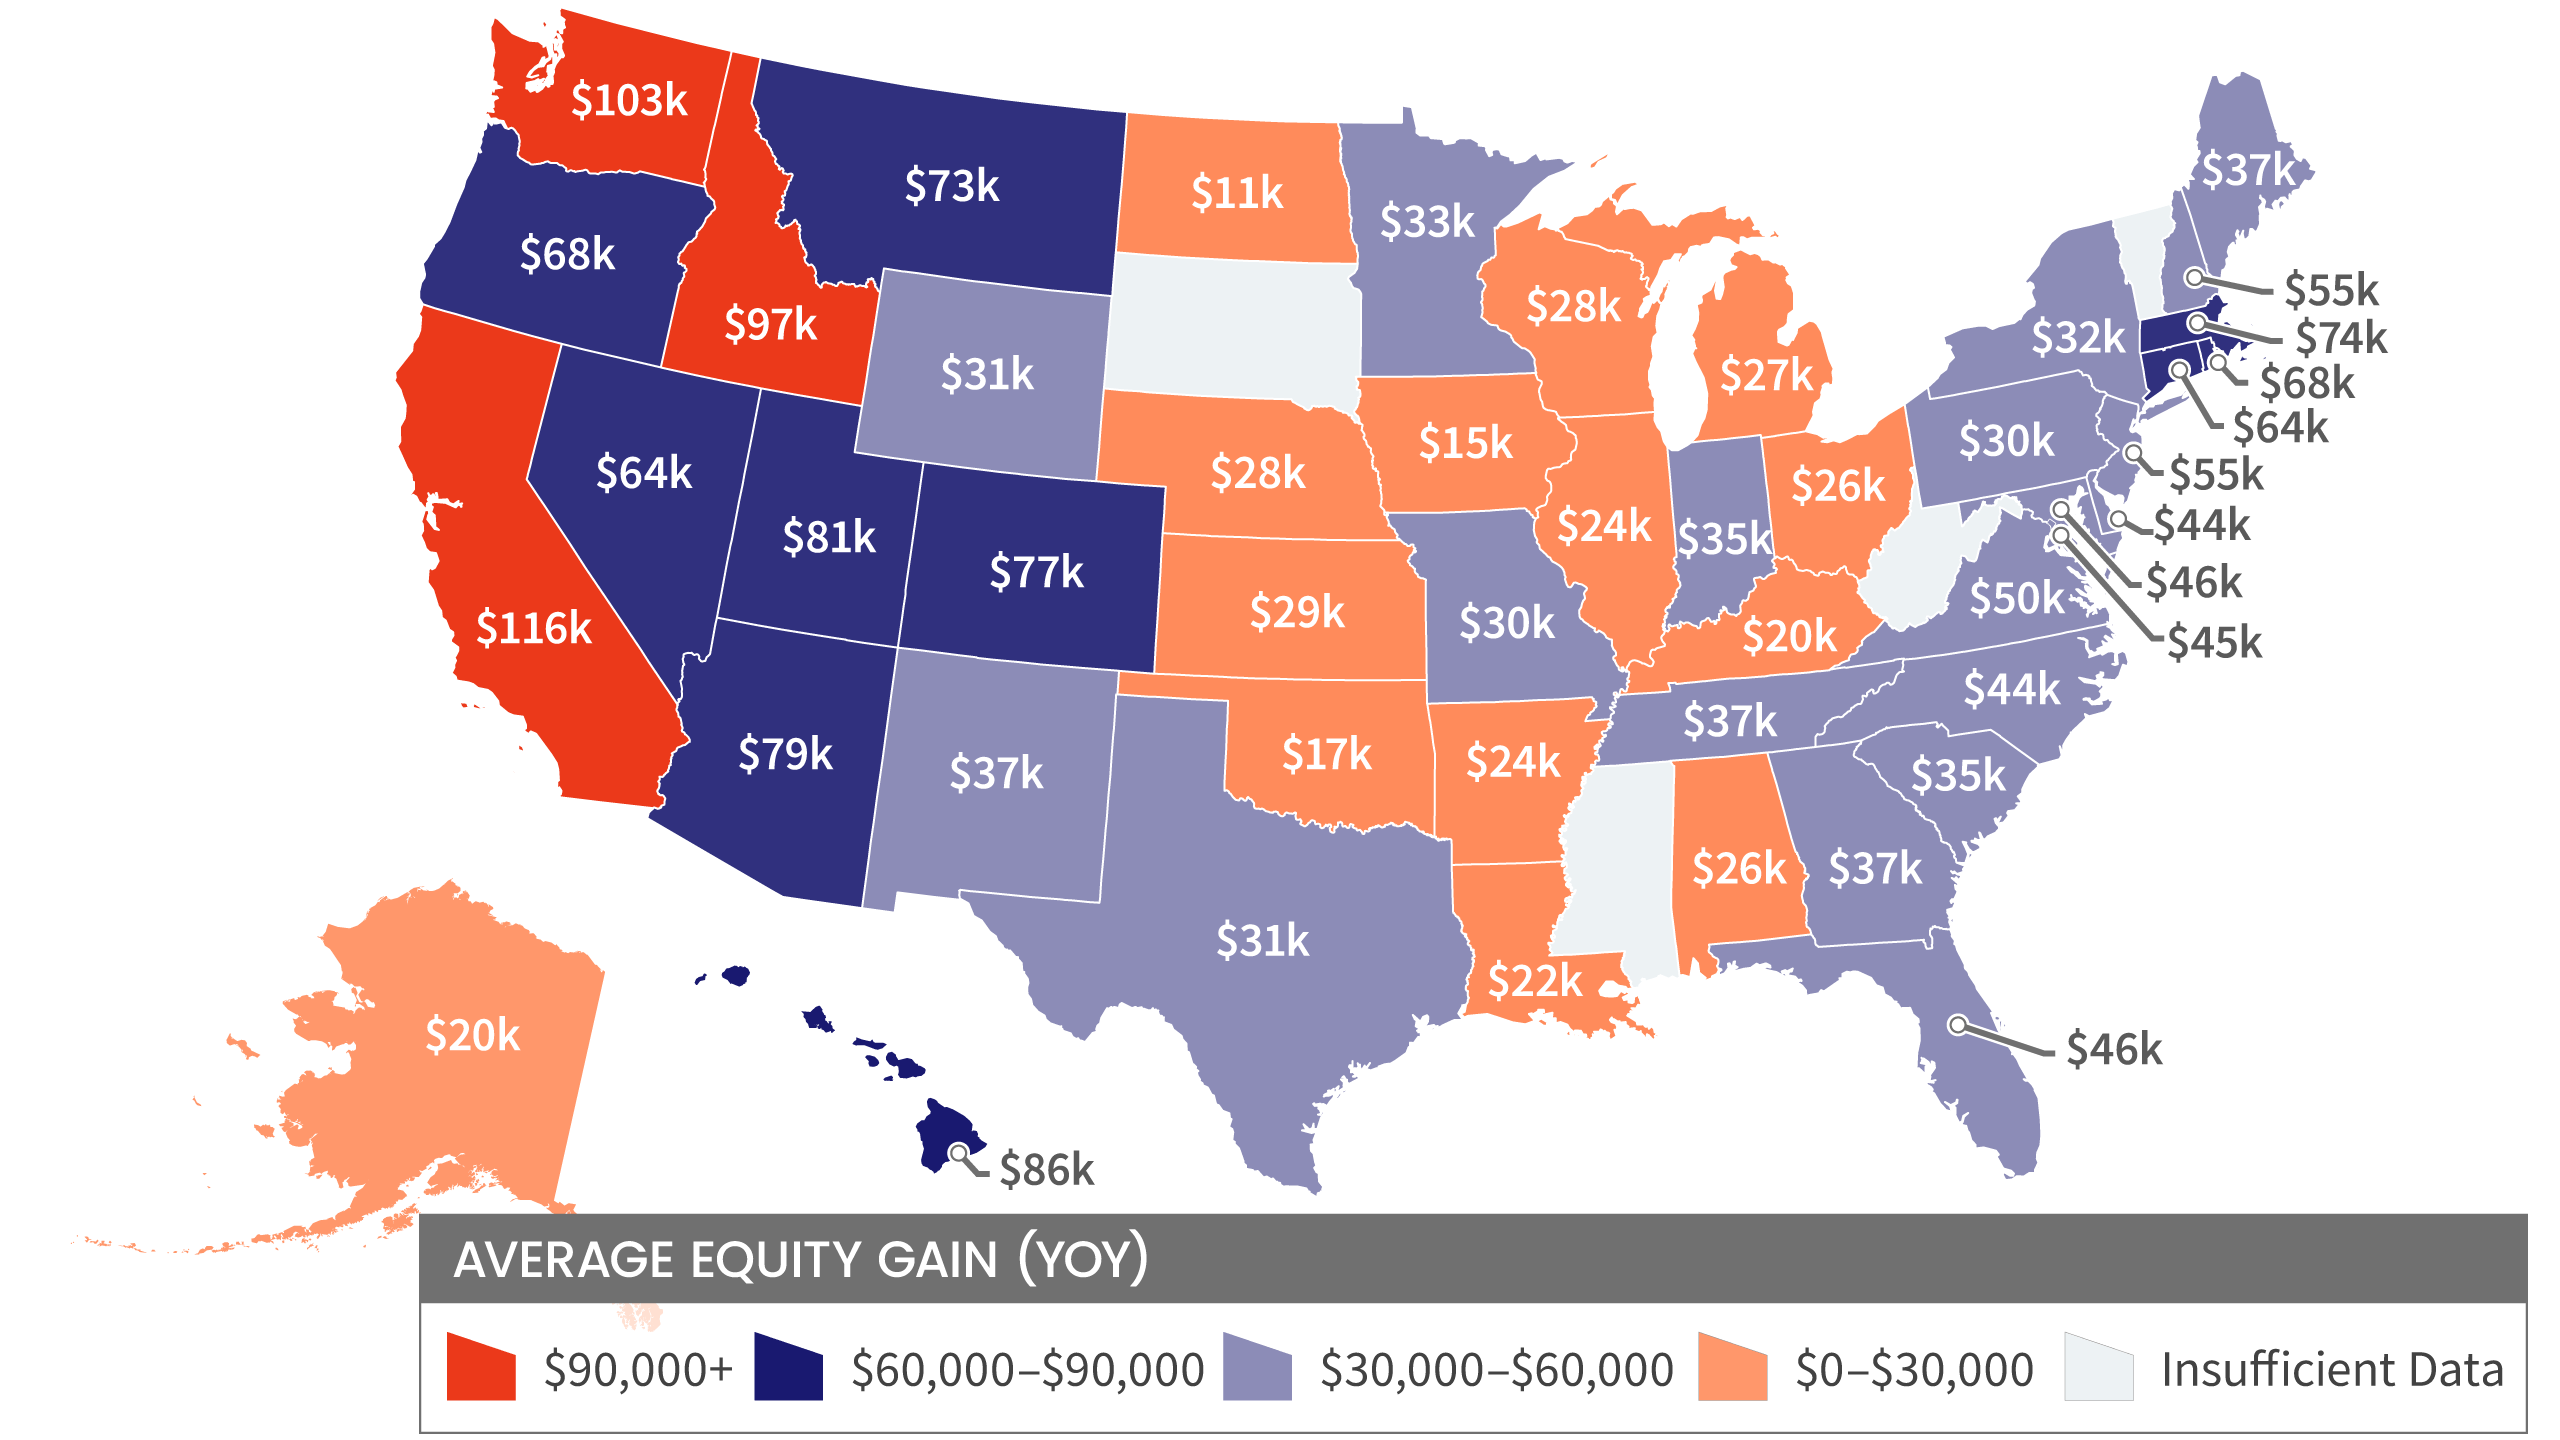
California, Washington, and Idaho experienced the largest average equity gains at $116,300, $102,900 and $97,000 respectively. Meanwhile, North Dakota experienced the lowest average equity gain in the second quarter of 2021 at $10,600.
10 Select Metros Change
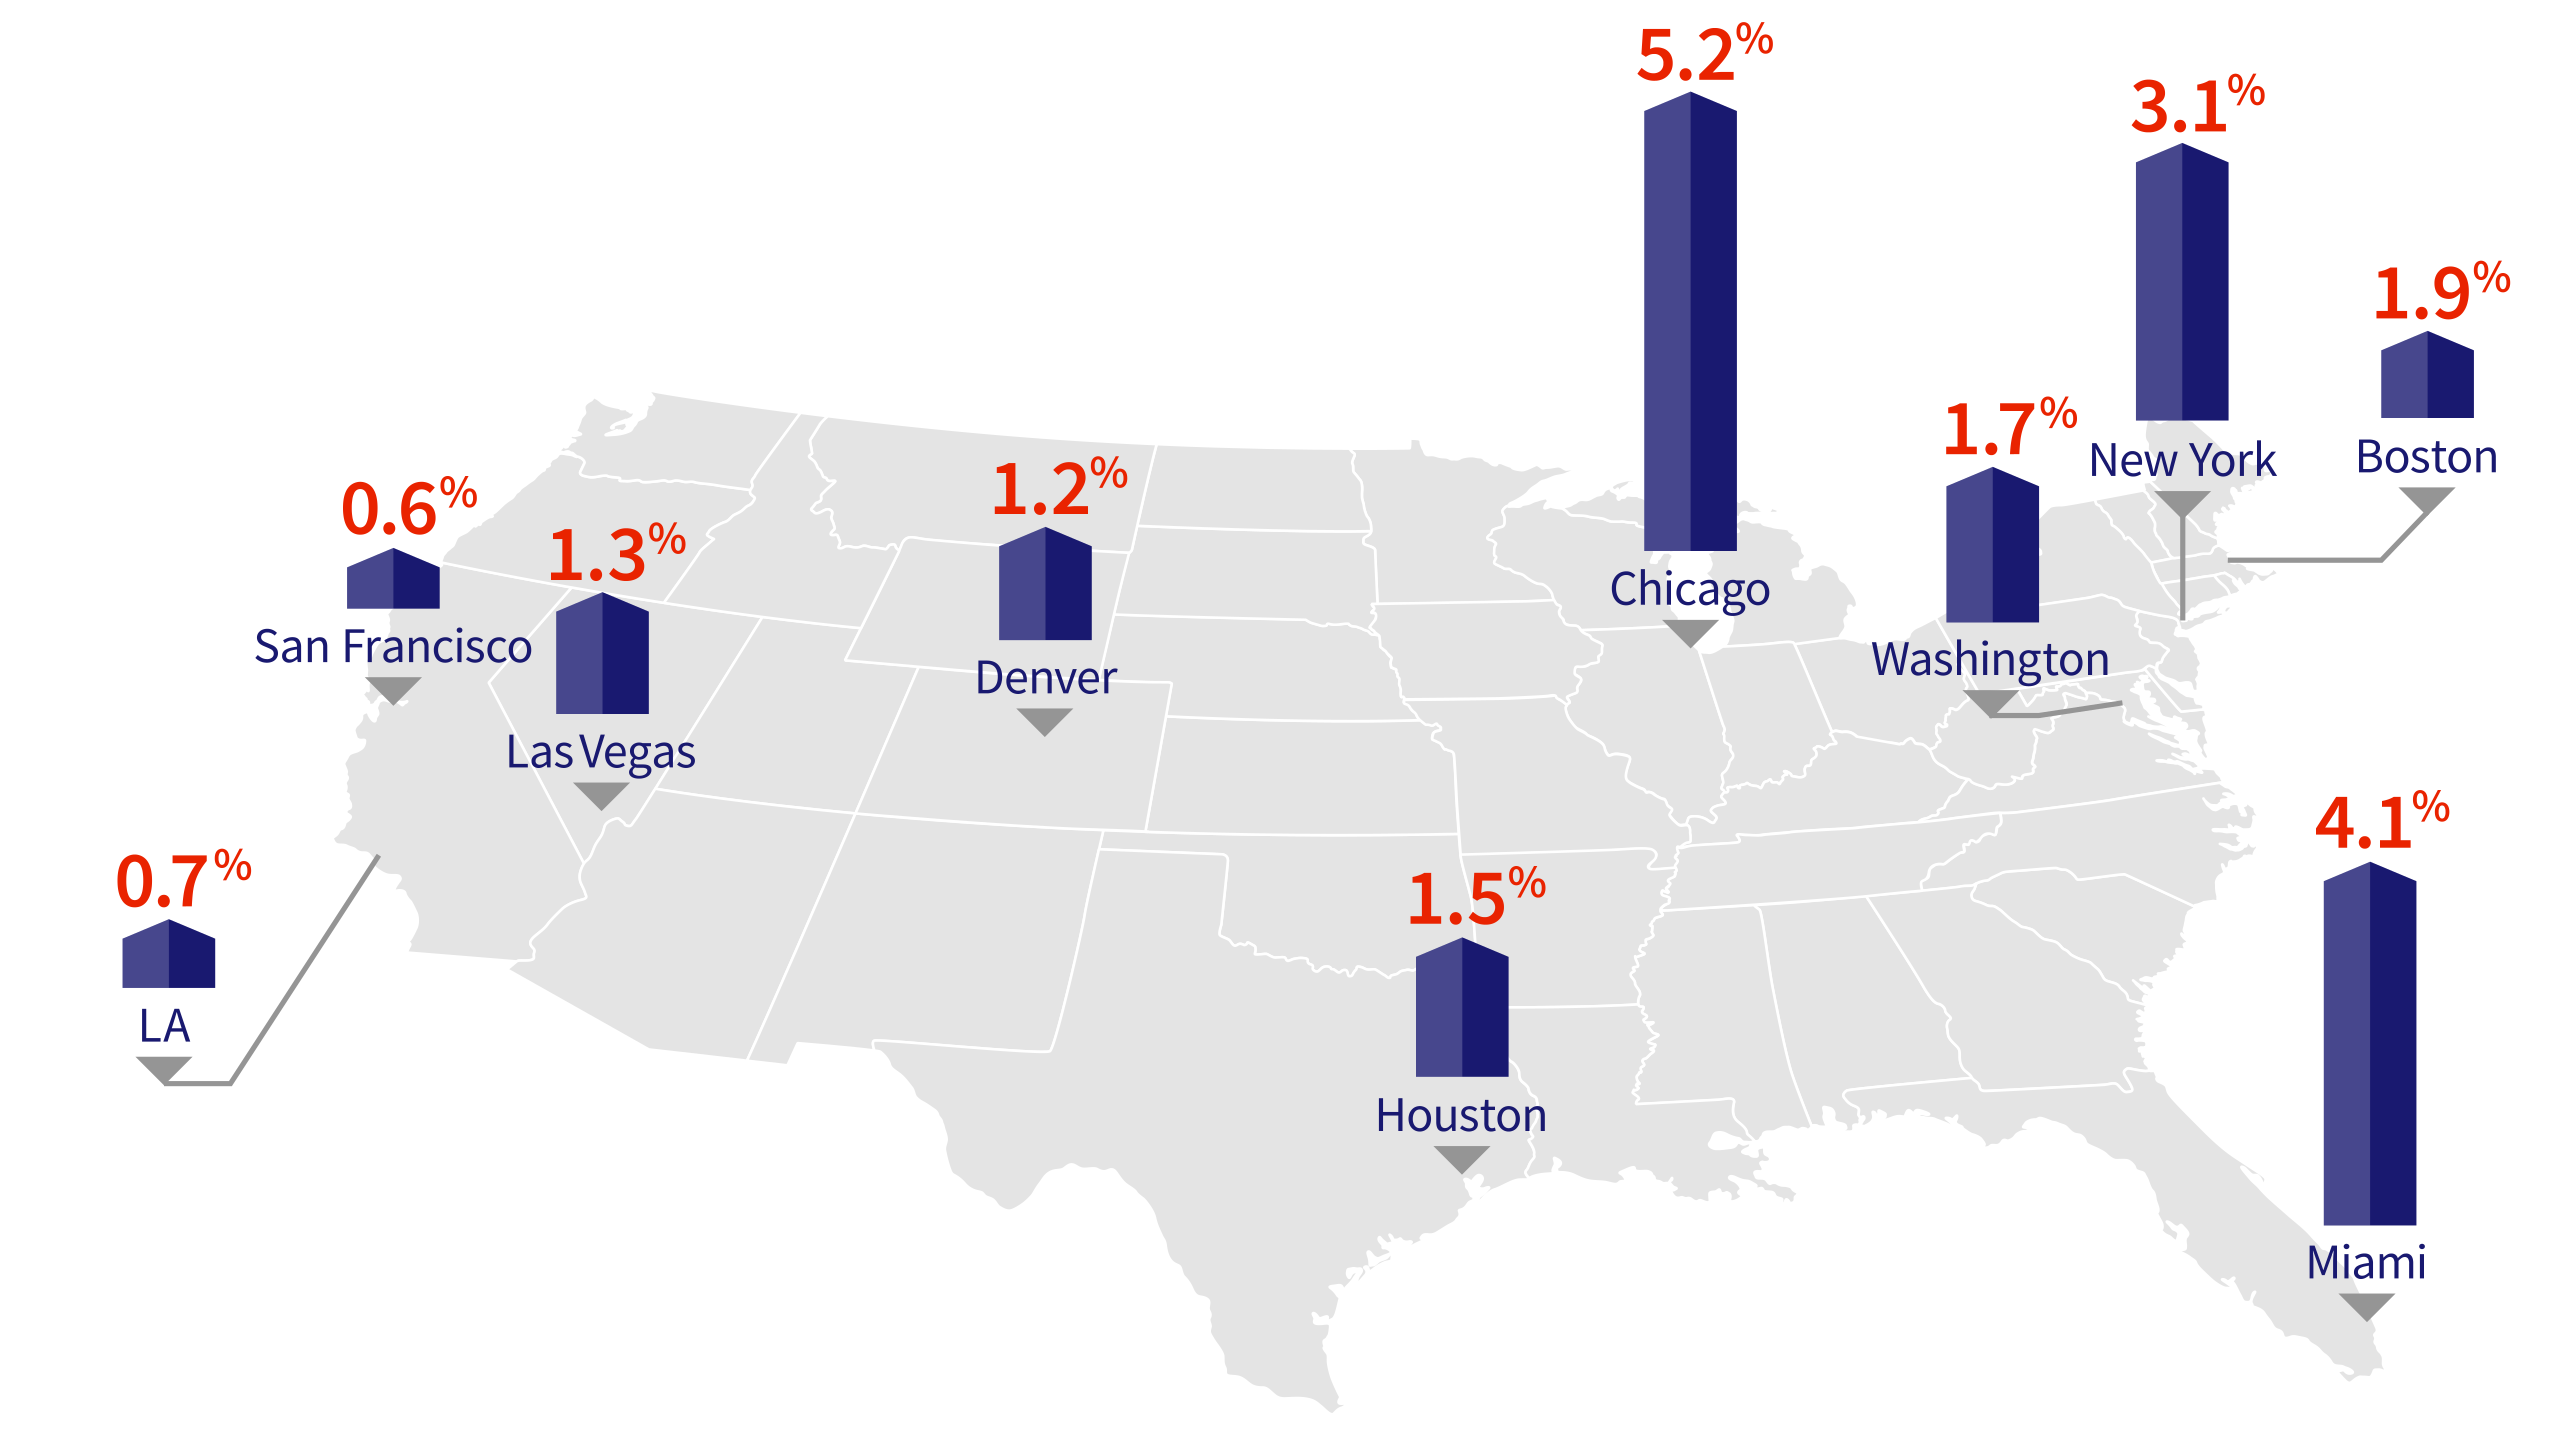
CoreLogic provides homeowner equity data at the metropolitan level, in this graphic 10 of the largest cities, by housing stock are depicted.
Negative equity has seen a recent decrease across the country. San Francisco-Redwood City-South San Francisco, CA, is the least challenged, with Negative Equity Share of all mortgages at 0.6%.
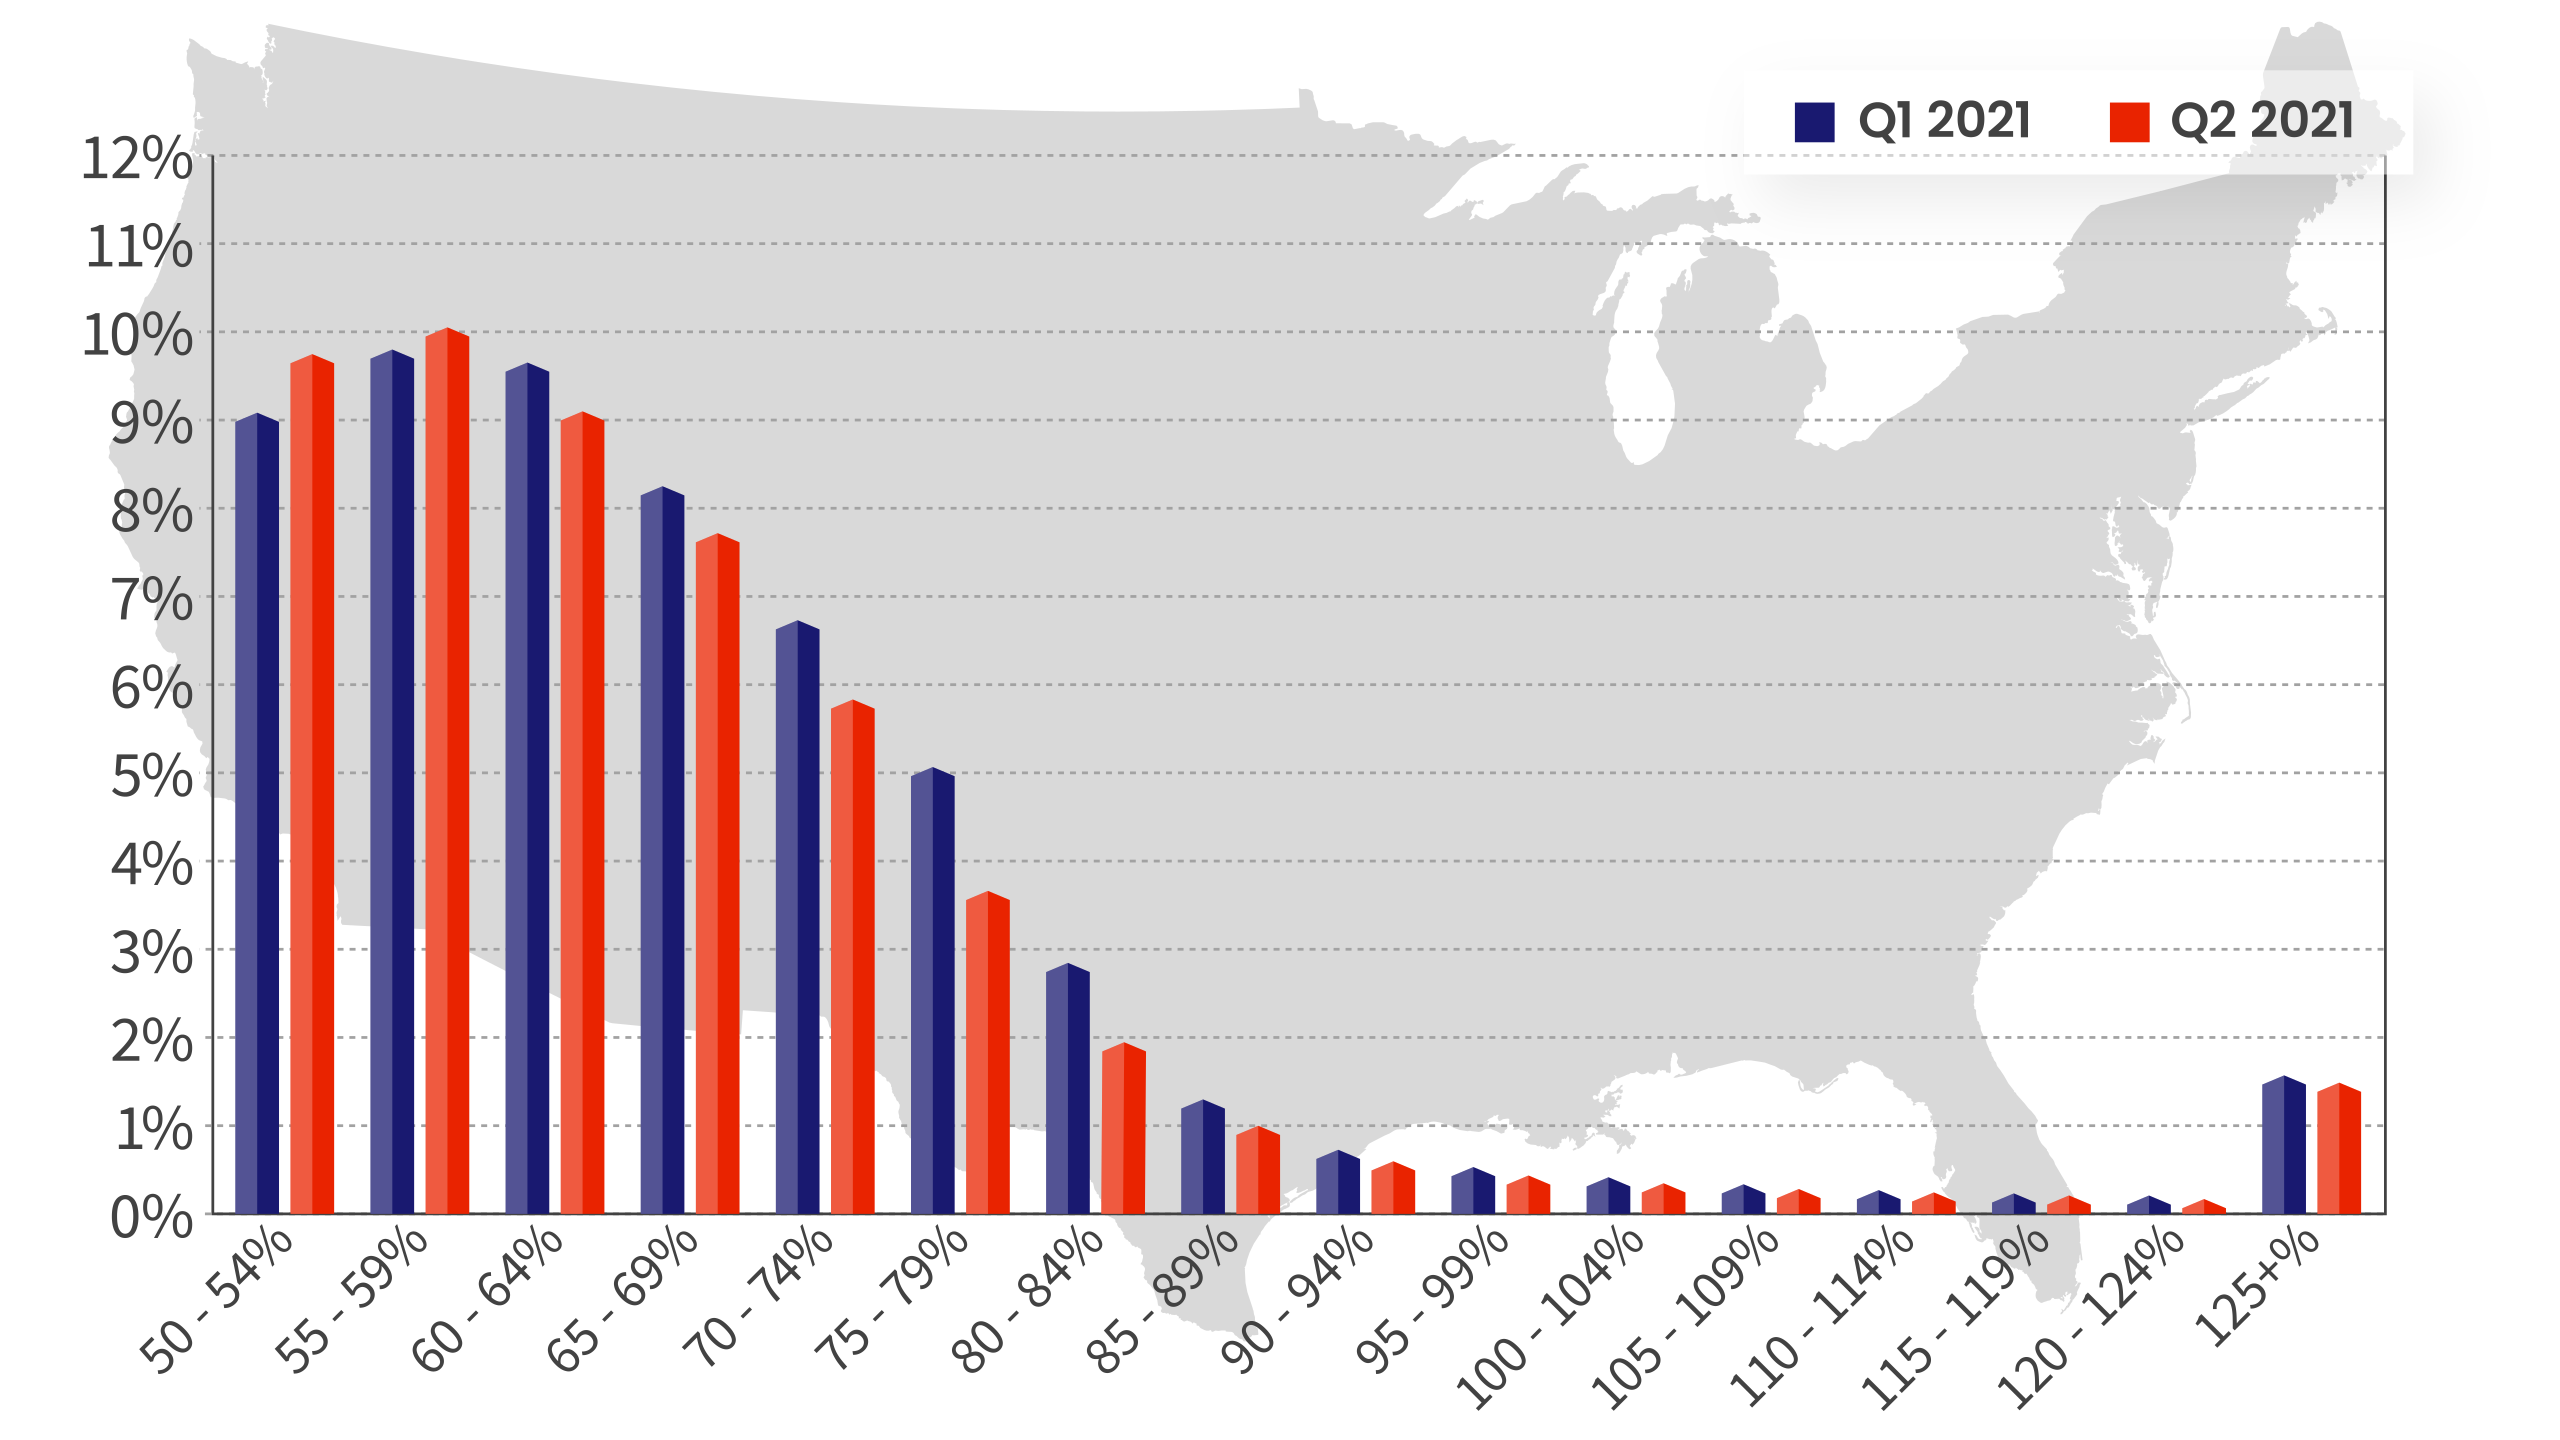
Loan-to-Value Ratio (LTV)
The graph represents National Homeowner Equity Distribution across multiple LTV Segments.
Since growing home equity lead to lower default risk (or at least losses to the mortgage holder), we are seeing mortgage delinquencies fall after the Covid surge.
Building materials copper and PVC (pipes) both surged with The Fed’s Cat 5 hurricane approach to liquidity. Then copper backed-off, but PVC rose when Hurricane IDA struck the gulf coast.
The Fed will announcing their plans (maybe) at 2pm today.
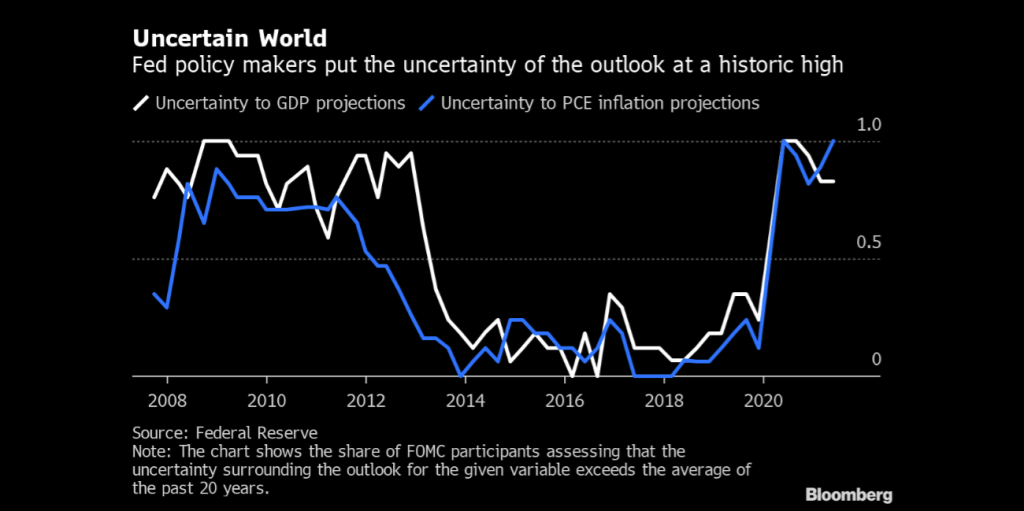
What would it take to knock the U.S. recovery off course and send Federal Reserve policy makers back to the drawing board? Not much — and there are plenty of candidates to deliver the blow.
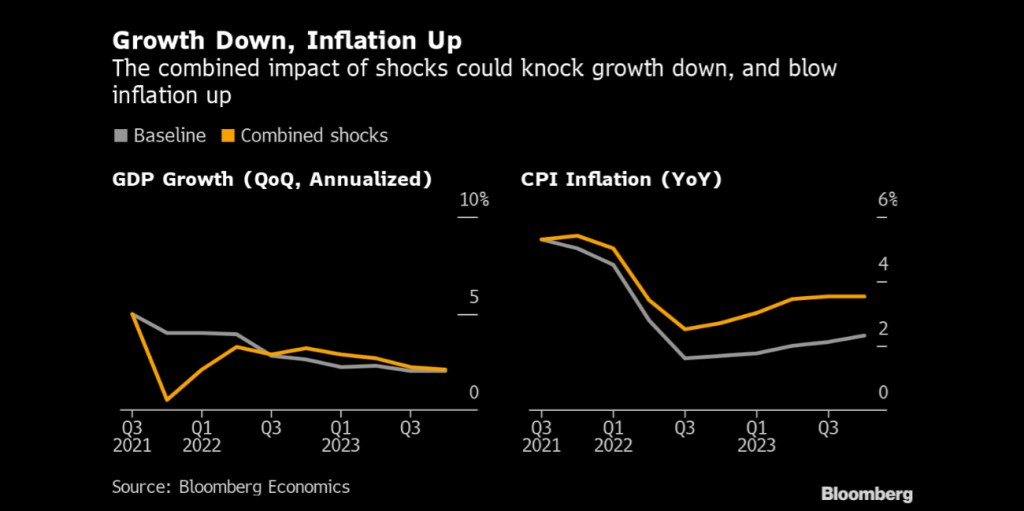
From one direction: U.S. debt-ceiling deadlock, China property slump or simply an extension of Covid caution could hit growth and jobs — taking the Fed’s proposed taper of bond purchases off autopilot, and pushing its first interest-rate increase back to 2024 or later. From the other: Sustained supply-chain snarl-ups could keep inflation stubbornly high and unmoor inflation expectations — forcing an acceleration of the taper, and an early rate liftoff in 2022.
And if shocks arrive from both directions at once, the upshot could be a combination of weak growth and rapidly rising prices — not as severe as the stagflation of the 1970s — but still leaving Fed Chair Jerome Powell and his colleagues with no easy answers.
In the following, we use Bloomberg Economics’ new modeling tool SHOK to explore these scenarios. None of them represents our base case. At a moment of elevated uncertainty, it makes sense to pay more attention to the risks.
Is the U.S. Economy Headed for a Slowdown? Signs of a slowdown in the U.S. economy aren’t hard to find.
August payrolls — just 235,000 new jobs, one-third of the expected number — were a red flag. The delta variant has made consumers cautious again. The University of Michigan’s index of sentiment plunged in August; only six declines since the modern index was launched in 1978 have been bigger.
Add all these pieces together, and a recovery that looked unstoppable just a few weeks ago now appears to be losing steam. At Bloomberg Economics, we have cut our prediction for annualized third-quarter growth to 5%, from above 7% at the start of the quarter. Others have gone lower, with forecasters at some of the big banks anticipating growth closer to 3%. Even if delta subsides, it’s not hard to imagine scenarios where the slide continues.
One of them involves the partisan impasse over raising the U.S. debt ceiling. The U.S. government is expected to reach the limits of its debt-servicing capacity in October. Default, a potentially catastrophic event for the global financial system, still appears an outside possibility. But even without one, recent history shows that dancing around the possibility — triggering a persistent risk-off period in the markets — can have serious consequences. Separately, a government shutdown starting Oct. 1 would hardly be helpful when the recovery is already struggling to find its footing.
In the three weeks around the 2011 debt-ceiling standoff, the S&P 500 index plummeted more than 15% and corporate borrowing costs spiked. Using SHOK we estimate that a repeat performance would shave about 1.5 percentage points off annualized fourth-quarter growth — and ensure a rocky start to 2022.
Global Risks to the Fed’s Plan Not all the risks originate so close to home.
Fears of a China housing crash have long haunted global markets. Now, President Xi Jinping’s “common prosperity” agenda has turned that into a real possibility.
Regulators are cracking down on abuses that inflated property values, and tight controls on lending have helped push prices and new construction sharply down. That’s left Evergrande, one of the nation’s biggest developers, on the cusp of a default. The consequences of a wider slump could be severe, because real estate drives demand for everything from steel and concrete to furniture and home electronics — contributing as much as 29% of China’s GDP, all told.
It wouldn’t take a sub-prime style meltdown to send shockwaves around the world and move the dial for the U.S. China’s economy is currently forecast to enter 2022 with growth at around 5%. A property slump could take that down to 3%, triggering a blow to trade partners, a drop in oil and metal prices, and a risk-off moment in global markets. In that scenario, the U.S. would limp into 2022 with the recovery marked down and inflation back below the 2% target.
When Is Jerome Powell Likely to Raise Rates? Powell has set out the FOMC’s criteria for rates liftoff: maximum employment, and inflation that hits and is set to exceed the 2% target for some time. A blow to employment and demand from a debt-ceiling standoff or China shock might mean those criteria are not met. Rate hikes could be kicked into the long grass, with expectations moving from 2023 out to 2024 or beyond. The test for tapering is less stringent, and a start at the end of this year appears close to baked in. Even so, if the recovery stumbles the Fed might have to make a course correction, introducing discretion into a process that markets expect to run on autopilot.
In 2015, the stock-market and currency slump in China — and the sustained shift to global risk-off sentiment that triggered — was enough to delay the start and slow the pace of the U.S. tightening cycle. In 2021, the Fed might not have that luxury.
China’s residential property slowdown deepened last month, signaling that regulatory tightening and an escalating crisis at the country’s most indebted developer are hurting buyer sentiment.
Supply-chain breakdowns — from port closures to shortages of semiconductors and lumber — have been one of the main factors pushing U.S. inflation above 5% this summer. That’s enabled Powell to label the price jumps as “transitory” and soothe fears of an upward spiral. The lower CPI reading for August provides some support for that thesis.
It wouldn’t take much, though, for further supply shocks to keep inflation uncomfortably high. From home electronics to textiles, American consumers load their shopping carts with goods that are made in Asia and delivered via supply chains that crisscross the continent. When the inflation rate for used cars in the U.S. hit 45% this year, driven by semiconductor shortages that threw assembly lines into disarray, it illustrated what can happen when those fragile linkages break down.
All of this adds to the risk of further “transitory” shocks to inflation. One early-warning signal: according to press reports, semiconductor giant TSMC has announced plans for price hikes of as much as 20% next year.
The effects of pandemic-induced supply-chain disruptions are still rippling through businesses and households, reflected in higher prices for goods, delays in receiving them and flat-out shortages.
For the Fed, inflation running hot into 2022 would be troubling on its own, and worse if it triggers a shift in inflationary psychology. If businesses start to feel comfortable setting prices higher, and workers start demanding higher wages to compensate, the risk is a situation reminiscent of the wage-price spirals of the 1970s — when it took a recession engineered by the Volcker Fed to squeeze inflation expectations out of the system.
Unmoored inflation expectations would very likely trigger an early and aggressive response from the Fed: an accelerated taper, and a rate hike in 2022.
A no-win scenario would be if the two blows — to output and jobs, and to supply chains and prices — landed at the same time, leaving Fed officials in a quandary. Ease policy to support growth and they would add fuel to the inflationary fire. Tighten to bring prices under control, and they would exacerbate the drag on the recovery, throwing more Americans out of work.
Agreement in Congress, or decision by the Democrats to go it alone, could remove the default risk. China has in the past proved skillful at shifting gears to avoid a housing crash. Vaccination rates in Asia are rising. The latest U.S. data — inflation slowed and retail sales rose — have been encouraging.


























You must be logged in to post a comment.