Sales of existing single-family houses, townhouses, condos, and co-ops that closed in January dropped by 4.9% from December, seasonally adjusted, to an annual rate of 4.08 million sales, according to the National Association of Realtors today.
This rate of sales was up just 2.0% from the abysmally low levels a year ago – 2024 as a whole had been the worst sales year since 1995 – and flat with the abysmally low levels two years ago.
Compared to January 2021, the sales rate was down by 36%, compared to January 2019, the sales rate was down by 25%
On a NON seasonally adjusted basis, things look even more grim.
Active inventory is up 27.6% YoY. As mortgage rates are projected to rise, things can get worse.
Mortgage rates continue to hover around 7%. Mortgage rates rose 164% under Biden!
Maybe if Fed Chair Jerome Powell is forced to wear Sky Saxon of The Seed’s wizard outfit, he will improve his policies.
Janet Yelllen, the former Federal Reserve Chair and Treasury Secretary under clueless Joe Biden was a disaster in every respect. As Fed Chair, she was noteworthy for her clinging to low rates for too long. And as Treasury Secretary, she is noteworthy for her gross fiscal mismanagement (look at the deficit and debt crisis!). Now Zero Hedge has this disastrous report of $4.7 TRILLION in virtuallly untraceable Treasury payments.
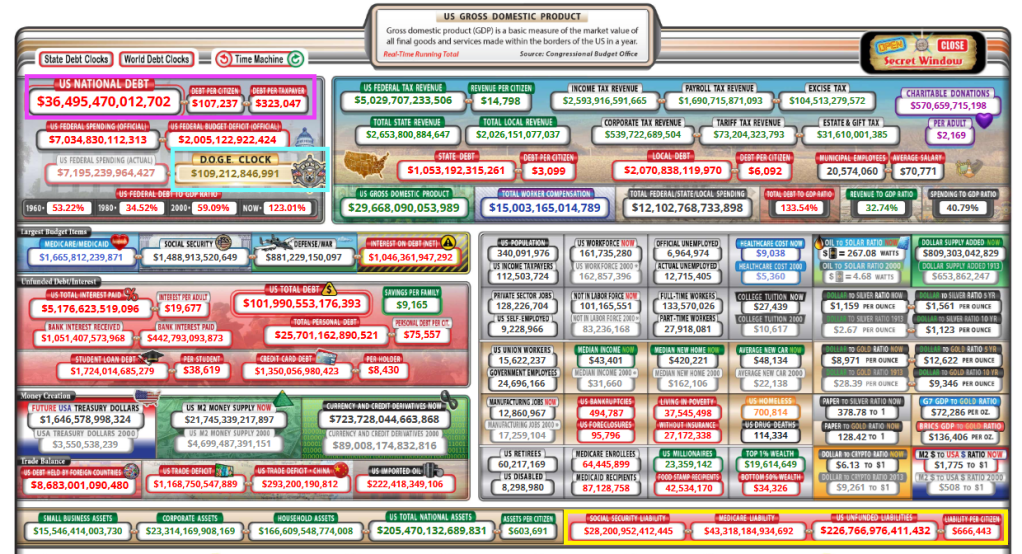
The Elon Musk-led Department of Government Efficiency (DOGE) on Monday revealed its finding that $4.7 trillion in disbursements by the US Treasury are “almost impossible” to trace, thanks to a rampant disregard for the basic accounting practice of using of tracking codes when dishing out money.
With a debt load of $36.5 trillion and D.O.G.E. clock at $109 million and growing. Not to mention the $227 trillion in unfunded liabilities.
Mind you, it’s not as if such a federal tracking system wasn’t already in place— it simply went casually unused for all sorts of payouts adding up to an almost unfathomable $4.7 trillion. Without Treasury Access Symbol (TAS) identification codes associated with those payouts, there’s little hope in figuring out where all that money went.
“In the Federal Government, the TAS field was optional for ~$4.7 Trillion in payments and was often left blank, making traceability almost impossible,” DOGE announced via its X account. Thanks to DOGE, those “optional” days are over. “As of Saturday, this is now a required field, increasing insight into where money is actually going,” DOGE added.
DOGE’s scrutiny of various government agencies is eliciting high-pitched shrieks from nearly every leftist in America, from establishment politicians who don’t want the curtain that hides their hijinks and grifting torn down, to your liberal sister-in-law who thinks the government has an endless supply of money and that it spends it all virtuously.
Earlier this month, Treasury Secretary Scott Bessent pushed back on portrayals of DOGE employees as reckless rogues. “These are highly trained professionals,” he told Bloomberg. “This is not some roving band going around doing things. This is methodical and it is going to yield big savings.”
In the wake of the latest revelation that makes normal people glad that DOGE teams are scouring the federal government, Democrats desperately tried to find a way to make it sound bad that DOGE exposed trillions in untraceable payouts and promptly instituted tighter accounting discipline.
Meanwhile, leftists have also been foaming at the mouth over news that DOGE staffers are looking into the Social Security Administration’s (SSA) books, as if they were going to start rerouting funds to Tesla. Considering Social Security is careening toward mandatory benefit cuts as soon as 2033, everyone should welcome a team of financial professionals making sure the system isn’t being drained by improper payments.
Of course, that appears to be exactly what’s been happening. On Sunday night, Musk said DOGE might be on the trail of “the biggest fraud in history,” as SSA data appears to show that 20.789 million Americans over the age of 100 are collecting Social Security retirement benefits. That includes 12 million who are purportedly over 120 years old.
Bent on derailing DOGE, Democrats have sued to prevent the organization from accessing federal data associated with the Office of Personnel Management, and the Health and Human Services, Education, Energy, Transportation, Labor and Commerce departments. On Monday, the federal judge handling the request for a restraining order expressed skepticism over Democrats’ challenge, noting that their “evidence” was largely media speculation about potential harms springing from DOGE’s activities: “The courts can’t act based on media reports. We can’t do that.“
A ruling is expected Tuesday. Here’s looking forward to DOGE proceeding to uncover a relentless string of scandals for months and months to come.
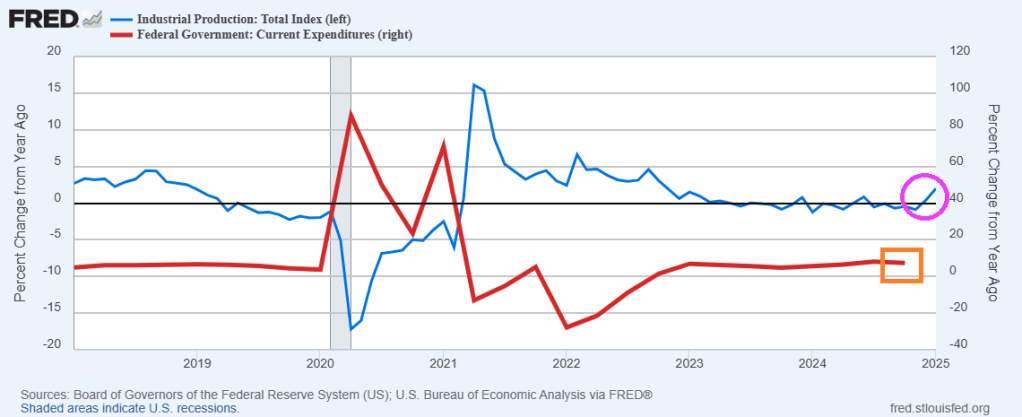
In January, US Industrial Production rose 2.00% YoY, the strongest growth rate since Oct 2022.
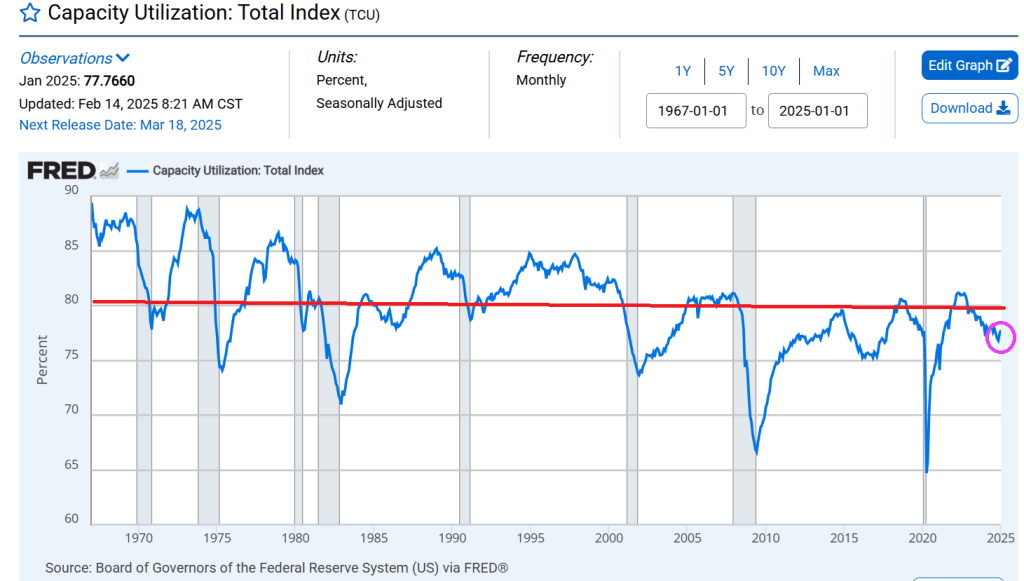
Capacity Utilization accelerated again in January (2nd straight month), rejecting the recessionary red flags. But CAPUTE remains below the critcal measure of 80.
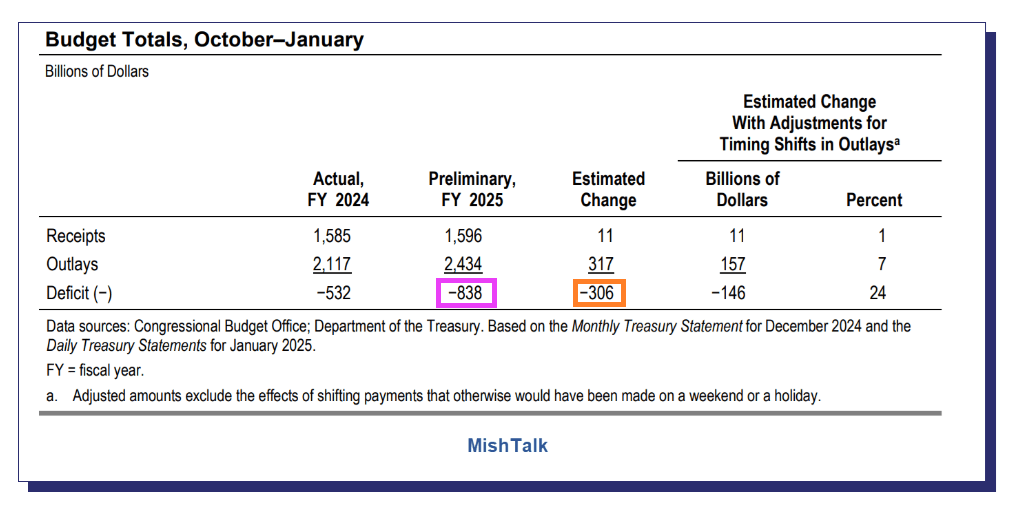
The US deficit for the first four months of fiscal Year 2025 is $838 billion, up $306 billion. Adjusted, the increase is more like $157 billion to $225 billion.
The federal budget deficit totaled $838 billion in the first four months of fiscal year 2025, the Congressional Budget Office estimates. That amount is $306 billion more than the deficit recorded during the same period last fiscal year. Revenues were $11 billion (or 1 percent) higher, and outlays were $317 billion (or 15 percent) higher.
The change in the deficit was influenced by the timing of outlays and revenues, which decreased the deficit during the first four months of fiscal year 2024 but increased it during the same period this fiscal year. Outlays in October 2023 were reduced by shifts in the timing of payments that were due on October 1, 2023, a Sunday. (The payments were made that September.) Outlays in the first four months of 2025 rose, on net, because payments due on February 1, 2025, a Saturday, were made in January. If not for those shifts, the deficit so far this fiscal year would have been $750 billion, or $146 billion more than the shortfall at this point last year. Part of the deficit increase in 2025 also arises from the postponement of some tax deadlines from 2023 to 2024 (described below), which boosted receipts in 2024.
Outlays in the first four months of fiscal year 2025 were $2.4 trillion, CBO estimates, $317 billion more than during the same period last year. If not for the timing shifts discussed above, outlays so far in fiscal year 2025 would have been $157 billion (or 7 percent) greater than outlays during the same four months in fiscal year 2024. The discussion below reflects adjustments to exclude the effects of those timing shifts.
Maxine Waters is an unhappy girl along with most Democrats about Trump and Musk looking into USAID.
Biden is out and so are the crazy job preferences of his administration (e.g., green energy). There is a new sheriff in town (Donald Trump).
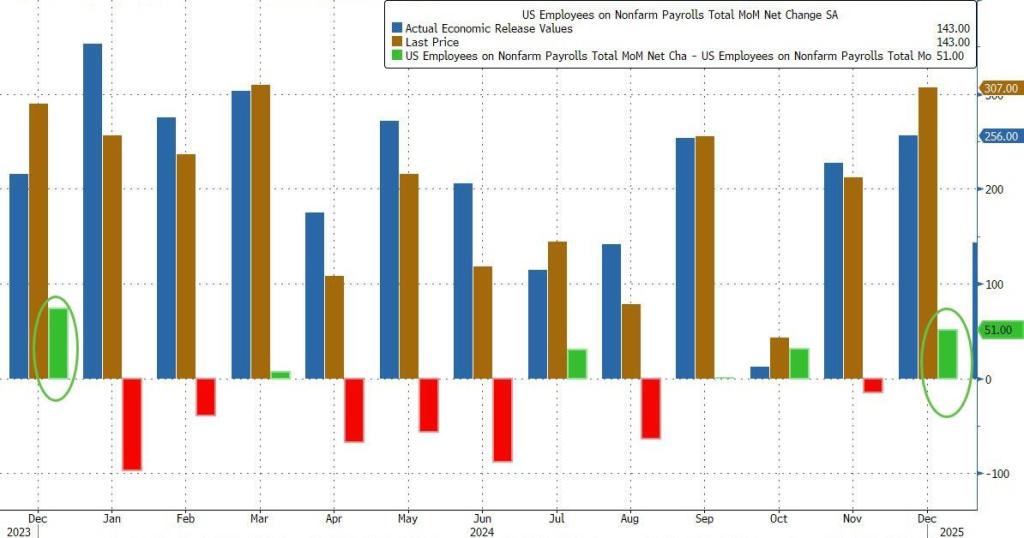
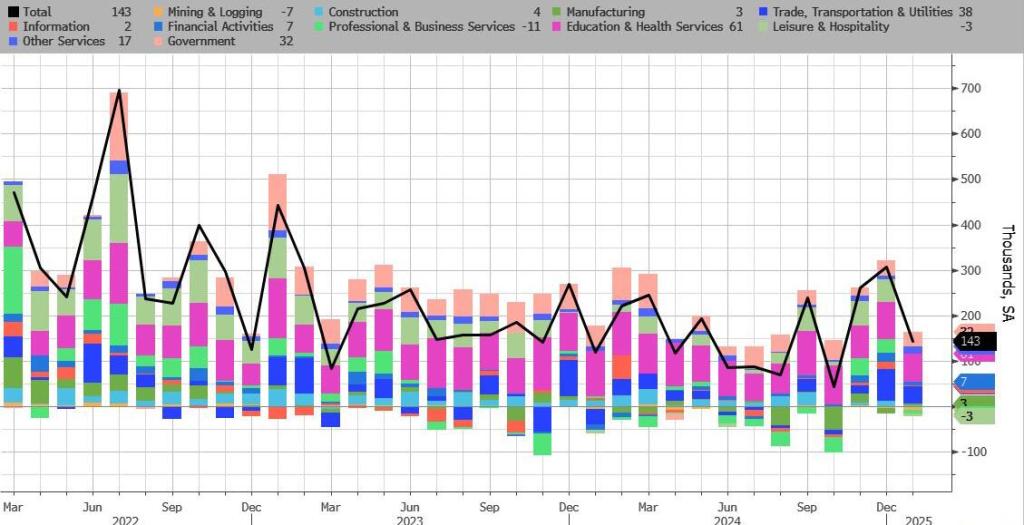
Here’s what the BLS reported in Trump’s first official jobs report since he returned to the White House: total payrolls printed at 143K.
down sharply from an upward revised 307K (256K originally) and missing estimates of 175K.
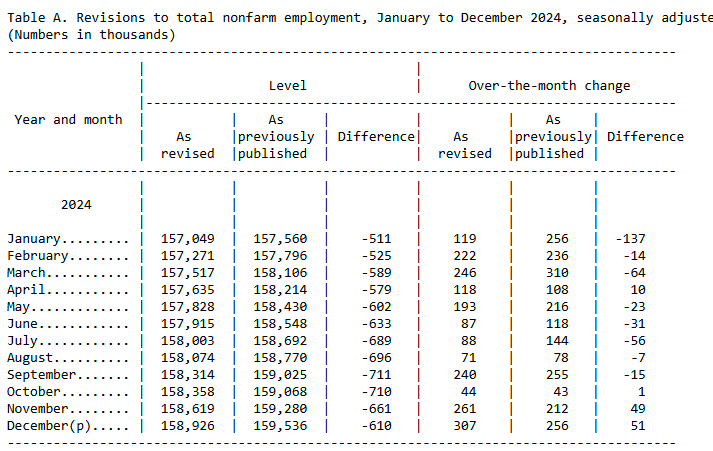
Looking further back, the change in total nonfarm payroll employment for November was revised up by 49,000, from +212,000 to +261,000, and when adding the +51,000 revision to December employment in November and December combined is 100,000 higher than previously reported
But while the sequential change in the Establishment survey was notable, what was far more remarkable was the Household survey where we saw massive population related revisions (discussed last night), which pushed the civilian labor force higher by 2.2 million to 170.744 million, while the number of employed workers also increased by over 2.2 million to 163.895 million. As a result, the Household survey has finally caught up to Establishment survey.
Oh we’ve got trouble in (Potomac) river city … with a capital P and that rhymes with D and that stands for DOGE. But can DOGE (Department of Government Efficiency
In 2025, $9.2 TRILLION of US debt will either mature or need to be refinanced. The US now holds $36.2 trillion worth of government debt, meaning 25.4% of the total is set to mature.
The total debt owed by the free-spending Federal government stands at $36+ trillion and growing. The DOGE clock stands at $64 billion and hopefully keeps growing.
No, its not 1903. Its 2025 and Dayton Ohio is the third most affordable city in the USA.
Ohio, the cradle of American Presidents (McKinley, Grant, Taft, Benjamin Harrison, Hayes, Garfield, Harding), is also home to 4 of the most affordable cities in the USA, according to The Virtual Capitalist.
As expected, the Trump Administration levied tariffs against Canada, Mexico, China, etc. The short-term result? Gold is stable, Bitcoin fell. Or as Gene Autry sang, “South of the Border (Down Mexico Way)”.
The stock market? Down -1.53%.
And then we have the doom porn about Mexico’s “impending” collapse. The Peso is declining, and Senator Chuck Schumer is getting hysterical about Mexican exports to the USA for Super Bowl Sunday. He incorrectly claimed that most beer is imported from Mexico and avacados for guacamole. Avacados are also grown in the USA, Peru, etc.
Bear in mind that Mexico is like California where the Left holds a supermajority. Hence, Mexico employs destructive economic policies (it could only be worse if California Governor Gavin Newsom was President of Mexico. But Mexico’s impending collapse is years in the making and Trump’s tariffs were only the last nudge over the cliff. Mexico COULD try to get control over the drug and human trafficking cartels, stop illegal immigration and stop the flow of fentanyl.
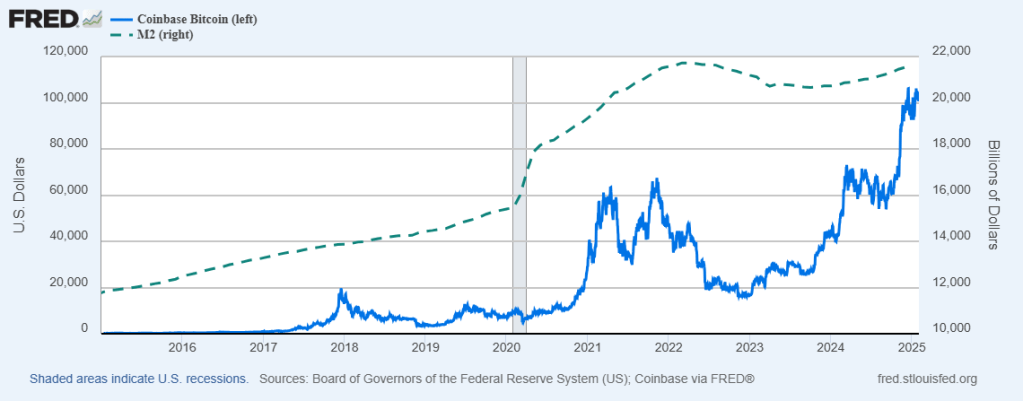
Nobel prize winner in economics, Gene Fama, said recently that cryptocurrencies will eventually be worthless. Well Gene, not if The Federal Reserve and other central banks keep printing money.
Global M2 money supply is at $97T and increasing. And with the increase in global M2, bitcoin and other cryptos are likely to keep rising.
On the US side, M2 Money has increased 12.7% under reckless spending Joe Biden while Bitcoin has increased 249%.
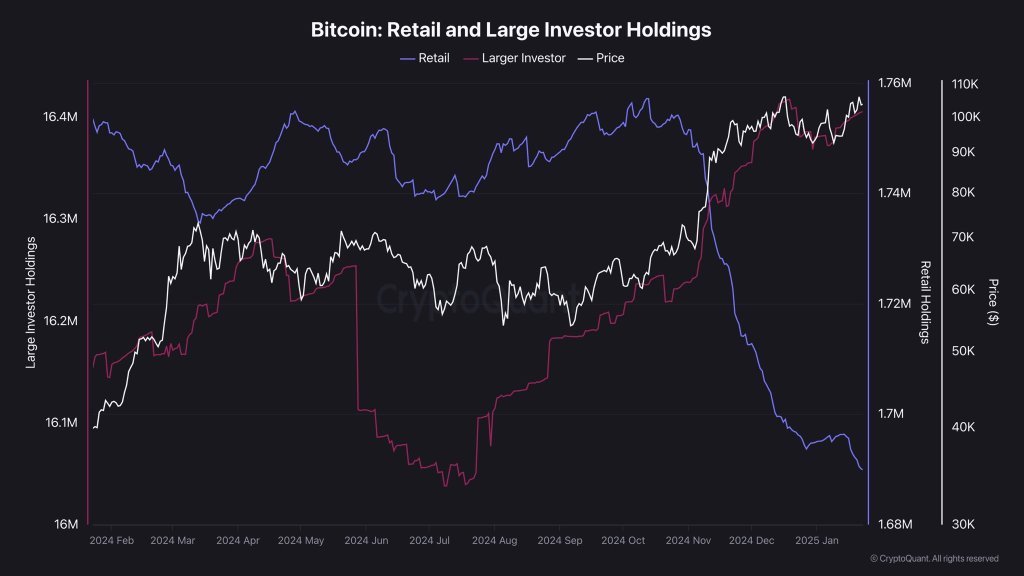
Retail investor holdings have declined while large investor holdings as Bitcoin increases in price.
On a different note, the Philadelphia Eagles will be playing the Kansas City Swifties next Sunday.
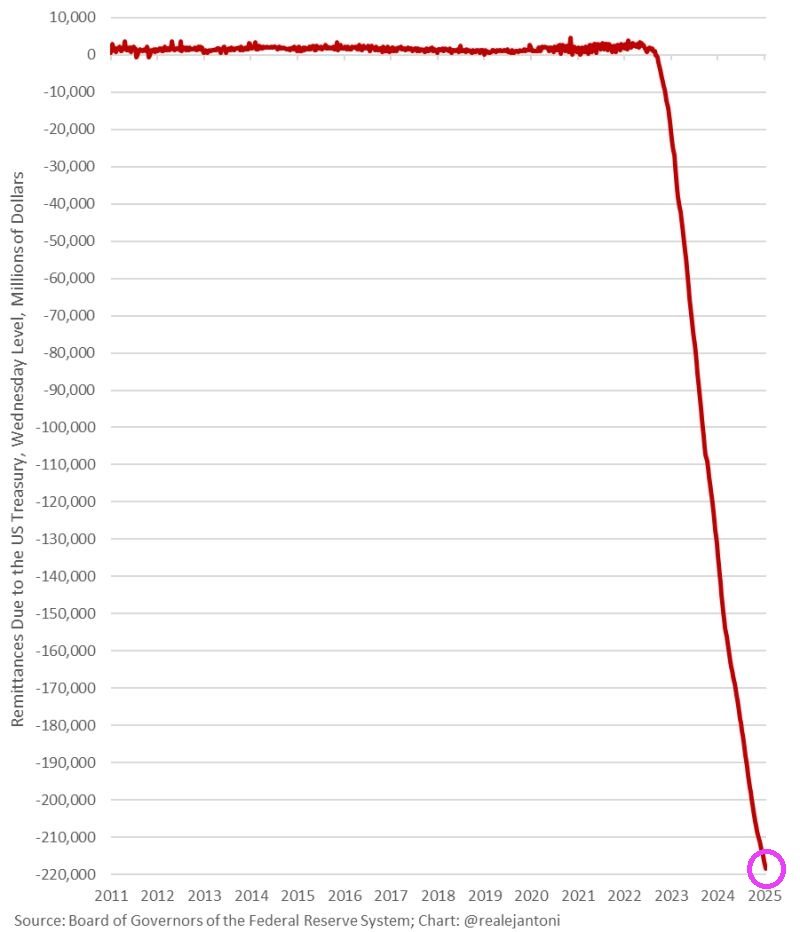
The Federal Reserve (aka, The Green Slime) represents the Spirit of Washington DC. A glutenous pig spending trillions it doesn’t have on insane policies. And The Fed ends up funding the insane spending and racking up massive losses.
Trump is inheriting a Federal Reserve w/ not only unprecedented losses of $218 billion, but it’s still losing money; the Fed won’t send the Treasury a dime for the entirety of Trump’s term; that’s never happened since the inception of the Fed – another challenge for Trump.


You must be logged in to post a comment.