DOGE is working: in Q1, US debt funding needs were $2BN less than the Treasury forecast in February, and in Q2 the Treasury is expected to need $53 billion less than it forecast 3 months ago.
The result?


Confounded Interest – Anthony B. Sanders
Financial Markets And Real Estate
DOGE is working: in Q1, US debt funding needs were $2BN less than the Treasury forecast in February, and in Q2 the Treasury is expected to need $53 billion less than it forecast 3 months ago.
The result?
Washington DC is loaded with good ol’ boys. Willing to cut deals with anyone for a slice of financial pie. Like “10% For The Big Guy” Joe Biden.
Money flowing into Treasury funds hit its highest since 2017, by far.

And with the massive expansion of The Fed’s balance sheet with a) the financial crisis and b) Covid crisis, The Fed still has a staggering amount of bonds on its balance sheet, making it vulnerable to interest rate increases.

Like what has happened in 2023 and 2024 under Biden. A fine mess!

Sail away. We are all prisoners of the theft by DC politicians.
We are still suffering from Biden’s horrible economic policies. 10% Joe had a heart of fool’s gold.
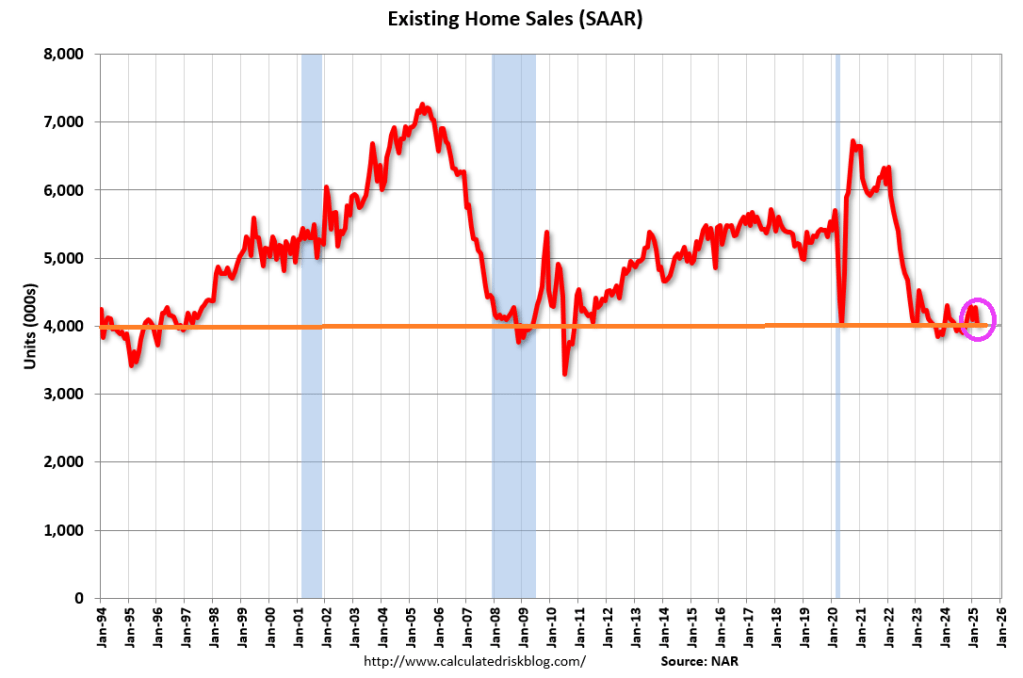
Existing-home sales descended in March, according to the National Association of REALTORS®. Sales slid in all four major U.S. regions. Year-over-year, sales dropped in the Midwest and South, increased in the West and were unchanged in the Northeast.
Total existing-home sales – completed transactions that include single-family homes, townhomes, condominiums and co-ops – fell 5.9% from February to a seasonally adjusted annual rate of 4.02 million in March. Year-over-year, sales drew back 2.4% (down from 4.12 million in March 2024).
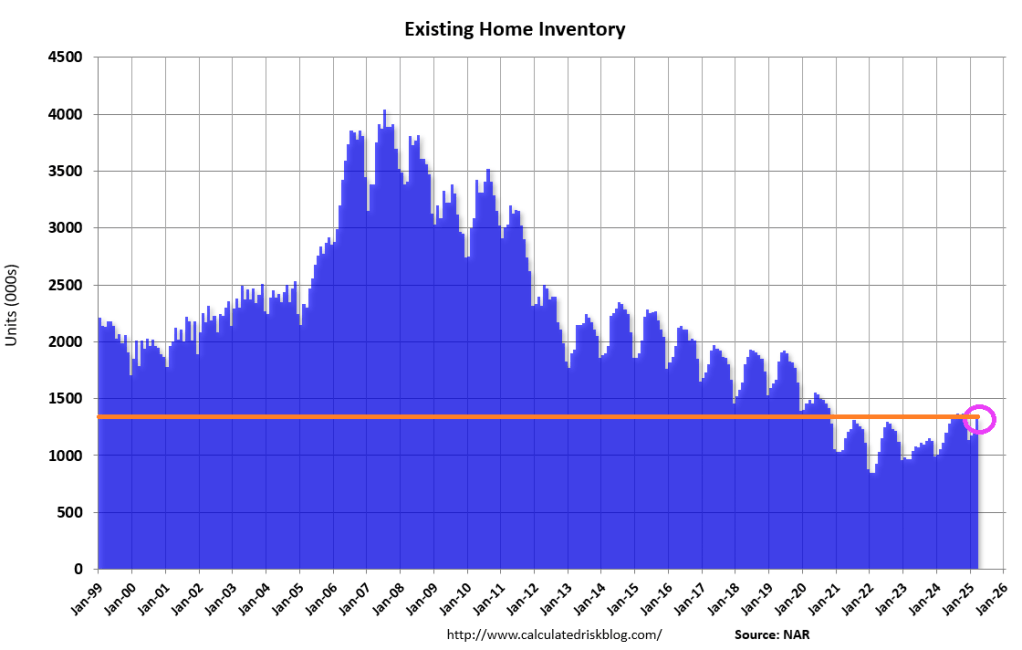
Total housing inventory registered at the end of March was 1.33 million units, up 8.1% from February and 19.8% from one year ago (1.11 million). Unsold inventory sits at a 4.0-month supply at the current sales pace, up from 3.5 months in February and 3.2 months in March 2024.
Fed Chair Jerome Powell is apparently waiting for the tariff “war” to settle down before he pushes for interest rate cuts. Meanwhile, rising mortgage rates are hurting consumers and the mortgage industry.
Mortgage applications decreased 12.7 percent from one week earlier, according to data from the Mortgage Bankers Association’s (MBA) Weekly Mortgage Applications Survey for the week ending April 18, 2025.
The Market Composite Index, a measure of mortgage loan application volume, decreased 12.7 percent on a seasonally adjusted basis from one week earlier. On an unadjusted basis, the Index decreased 11 percent compared with the previous week. The seasonally adjusted Purchase Index decreased 7 percent from one week earlier. The unadjusted Purchase Index decreased 6 percent compared with the previous week and was 6 percent higher than the same week one year ago.

The Refinance Index decreased 20 percent from the previous week and was 43 percent higher than the same week one year ago.

Overall mortgage application activity declined last week, as rates increased to their highest level in two months. The 30-year fixed rate rose for the second straight week to 6.9 percent, an almost 30-basis-point increase over two weeks.
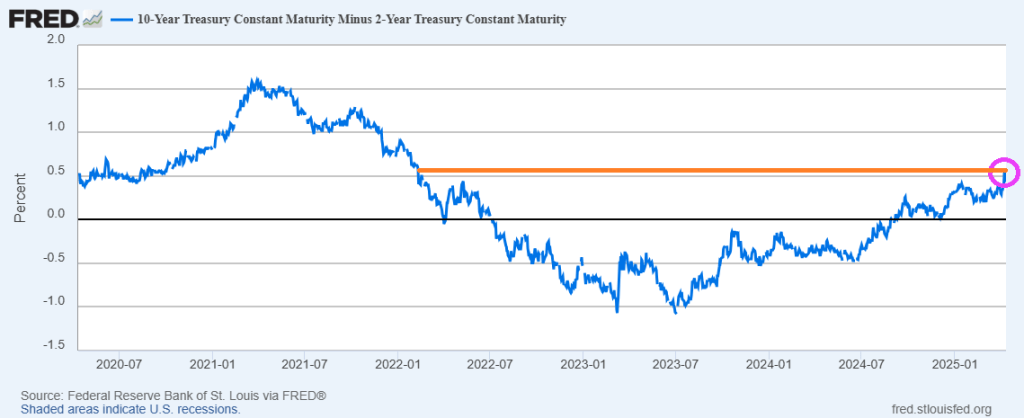
The 10Y-2Y Treasury yield curve is steepening.

Fed Chair Jerome Powell. Nyuk, Nyuk, Nyuk!

Adjustable-rate mortgages (ARMs) have climbed to the highest origination volume share since 2008 as the yield curve steepens and bank lending demand picks up. The majority of ARM lending goes to high credit borrowers with jumbo-sized loans, which many banks see as a good fit to keep in their portfolios as they are seen to have relatively limited credit and interest-rate risk.

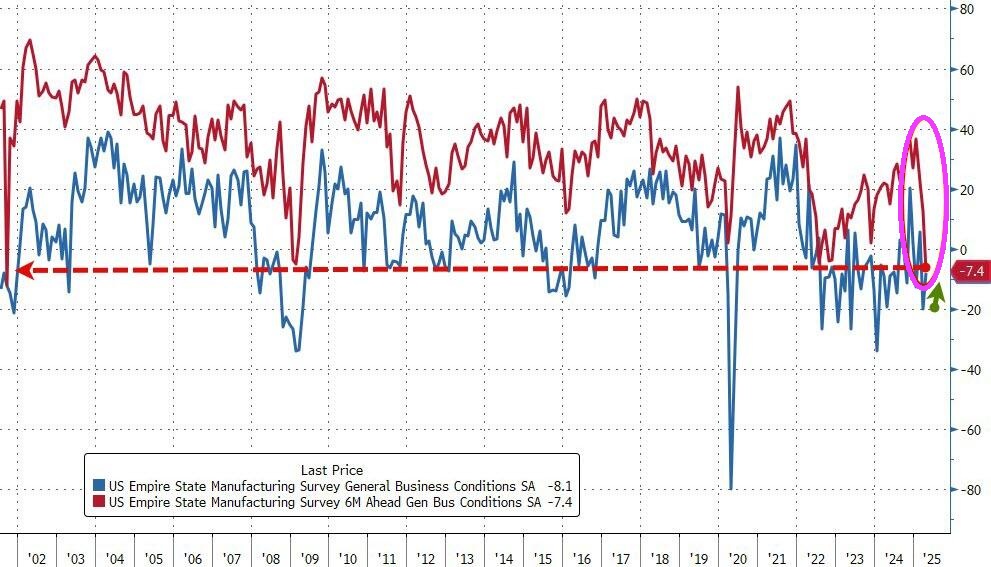
The Emperor is actually China’s Xi Jinping! Causing the Empire Fed Manufacturing index to decline.
Despite the slump in ‘soft’ survey data, analysts expected Empire Fed Manufacturing to bounce back from March’s tumble to one year lows and they were right with the headline index rising from -20.0 to -8.1 (considerably better than the -13.5), but still negative. However, while current conditions jumped, expectations plunged to the lowest since 9/11/.


Obama/Biden/Harris/Schumer/Pelosi have let the US be the punks for China. Trump is simply trying to level the playing field and China’s Xie doesn’t like the new equilibrium.
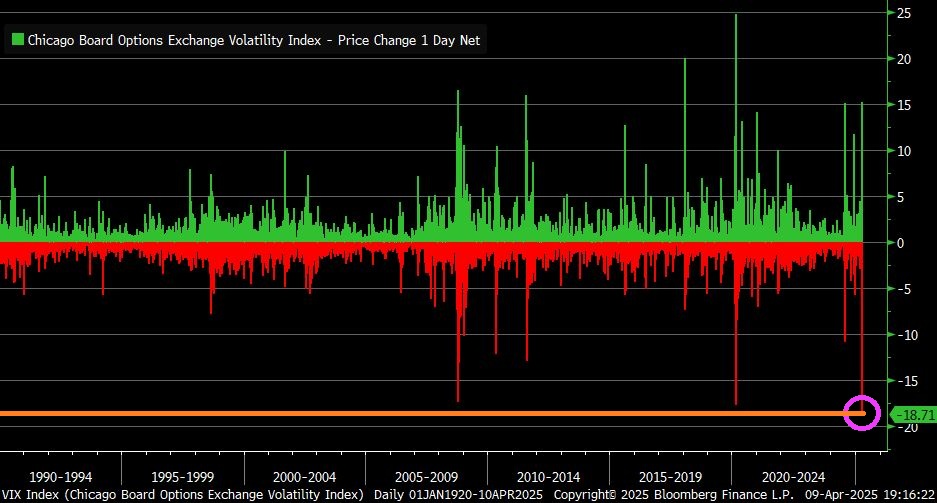
VIX Index fell by 18.7 points yesterday … largest one-day decline in history.
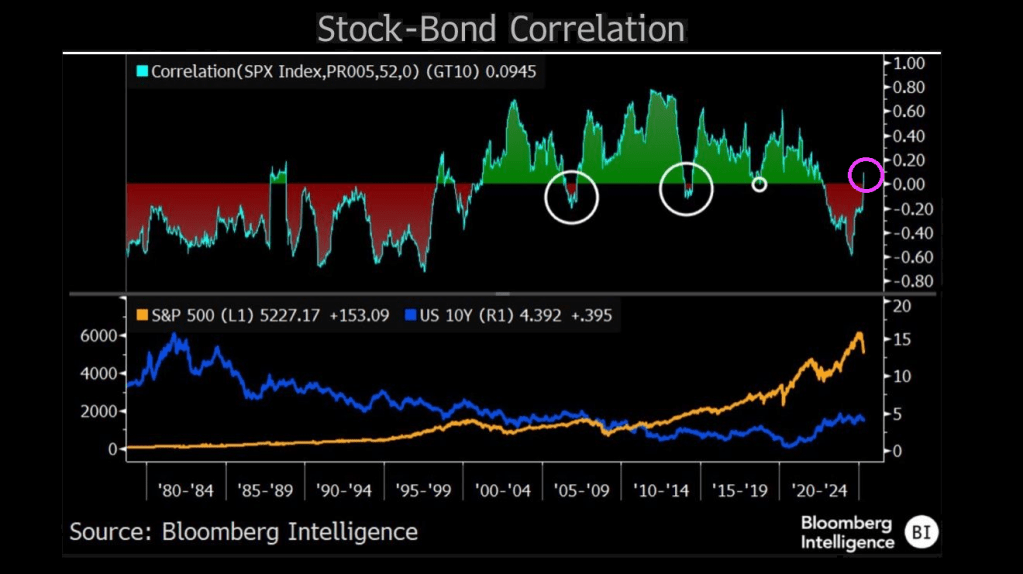
The correlation between stock prices and bond yields has returned to positive territory — hinting at a period of distress in equities and a regime shift in equity and bond markets where recession fears, rather than inflation, may be starting to drive direction of both. The correlation between the two asset classes was positive for the better part of 20 years prior to the pandemic, suggesting equities trended in the direction of yields as inflation mostly coincided with growth. Stocks held a negative correlation to yields throughout most of the 1980s and 1990s, when inflation hurt stocks — and that phenomenon returned for the 2022-24 bear market and recovery period.
Notably, major stock corrections occurred each time the correlation jumped out of its primary regime.
China’s Xi flashes a Hitler salute!

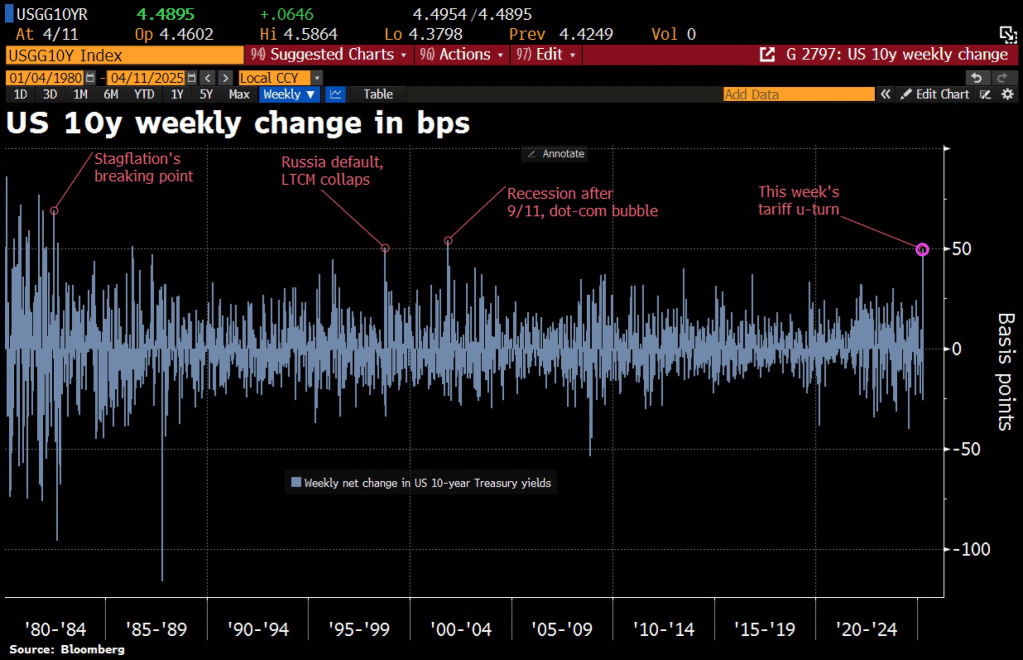
Thunderstruck! The tariff kerfuffle between the Trump Administration and China is causing turbulence in the Treasury market. The 10-year Treasury rate is soaring with China’s counterpunching.
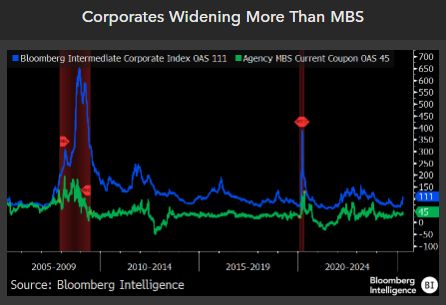
MBS spreads are widening.
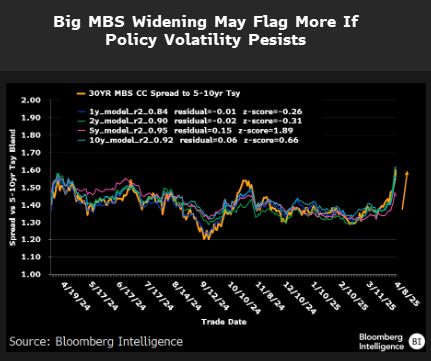
Along with volatility.
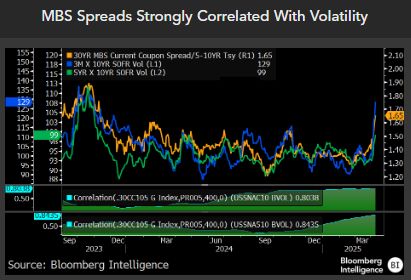
But corporate spreads are widening more than MBS spreads.
The 10Y-2Y yield curve has risen to the highest level since the early days of “China Joe” Biden.
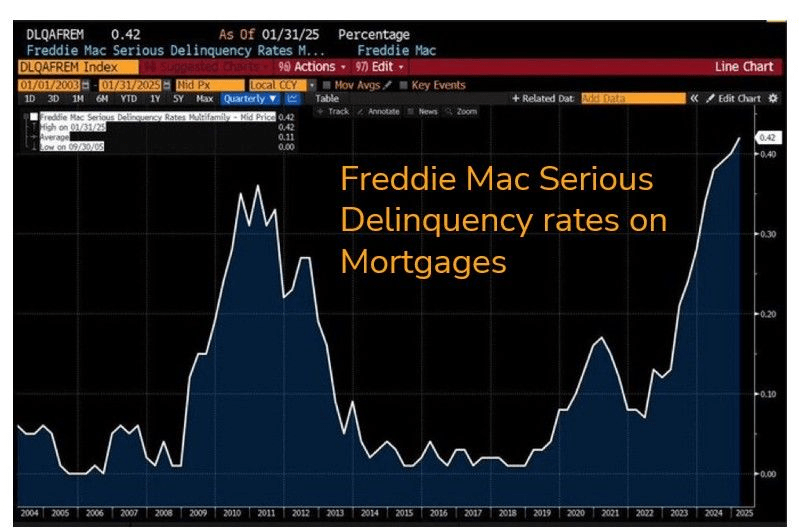
On a related note, Freddie Mac serious delinquency rates on mortgages is now the highest since the financial crisis.
Hello Hello pre-Biden inflation levels!
Having dipped lower in the previous month (following a few straight months of re-acceleration), expectations were for both headline and core measures to continue trending lower on a YoY basis… and they were.
Headline CPI FELL 0.1% MoM (vs +0.1% exp), which dragged the YoY CPI to +2.4%, matching the September lows…
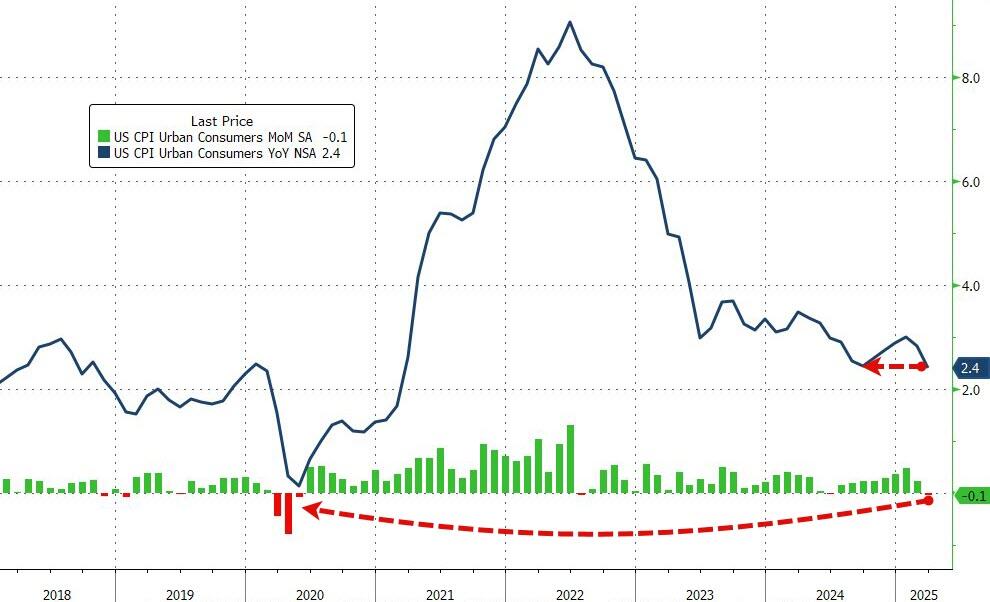
That is the weakest MoM print since May 2020.
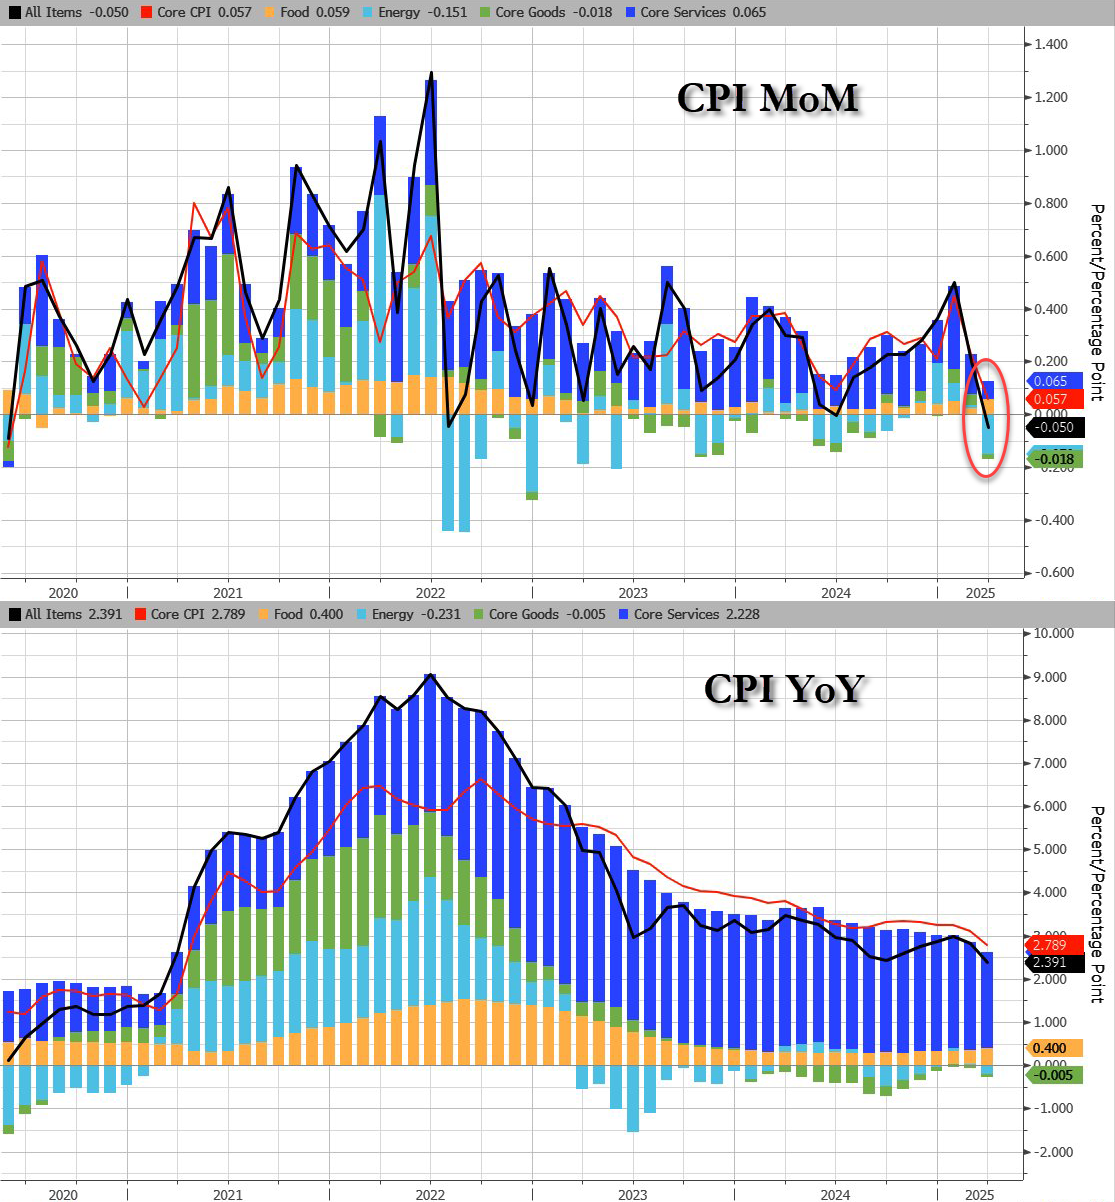
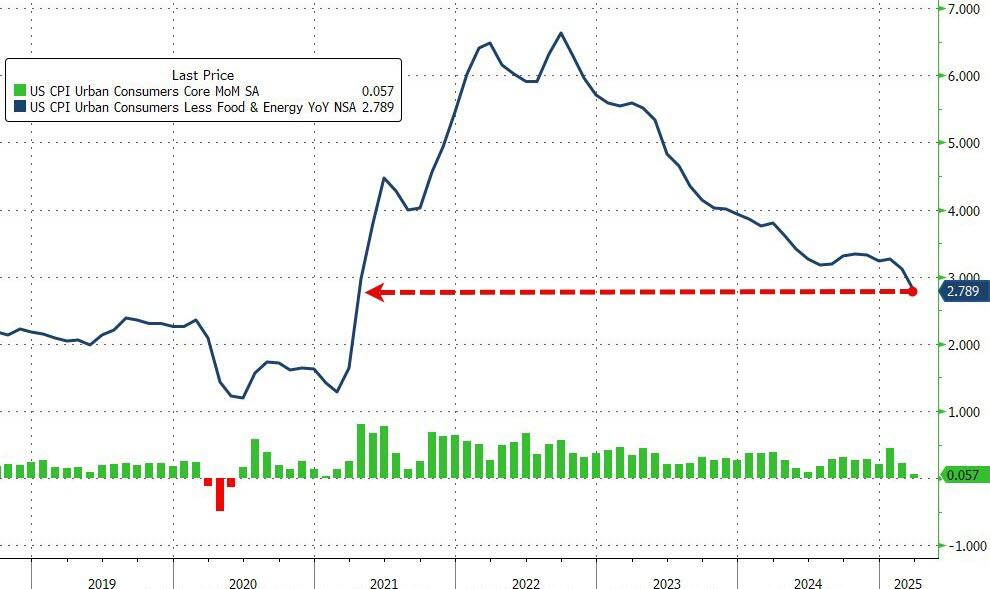
Core CPI also printed cooler than expected (+0.1% MoM vs +0.3% MoM exp), pulling the YoY print down t0 +2.8% YoY – the lowest since March 2021…
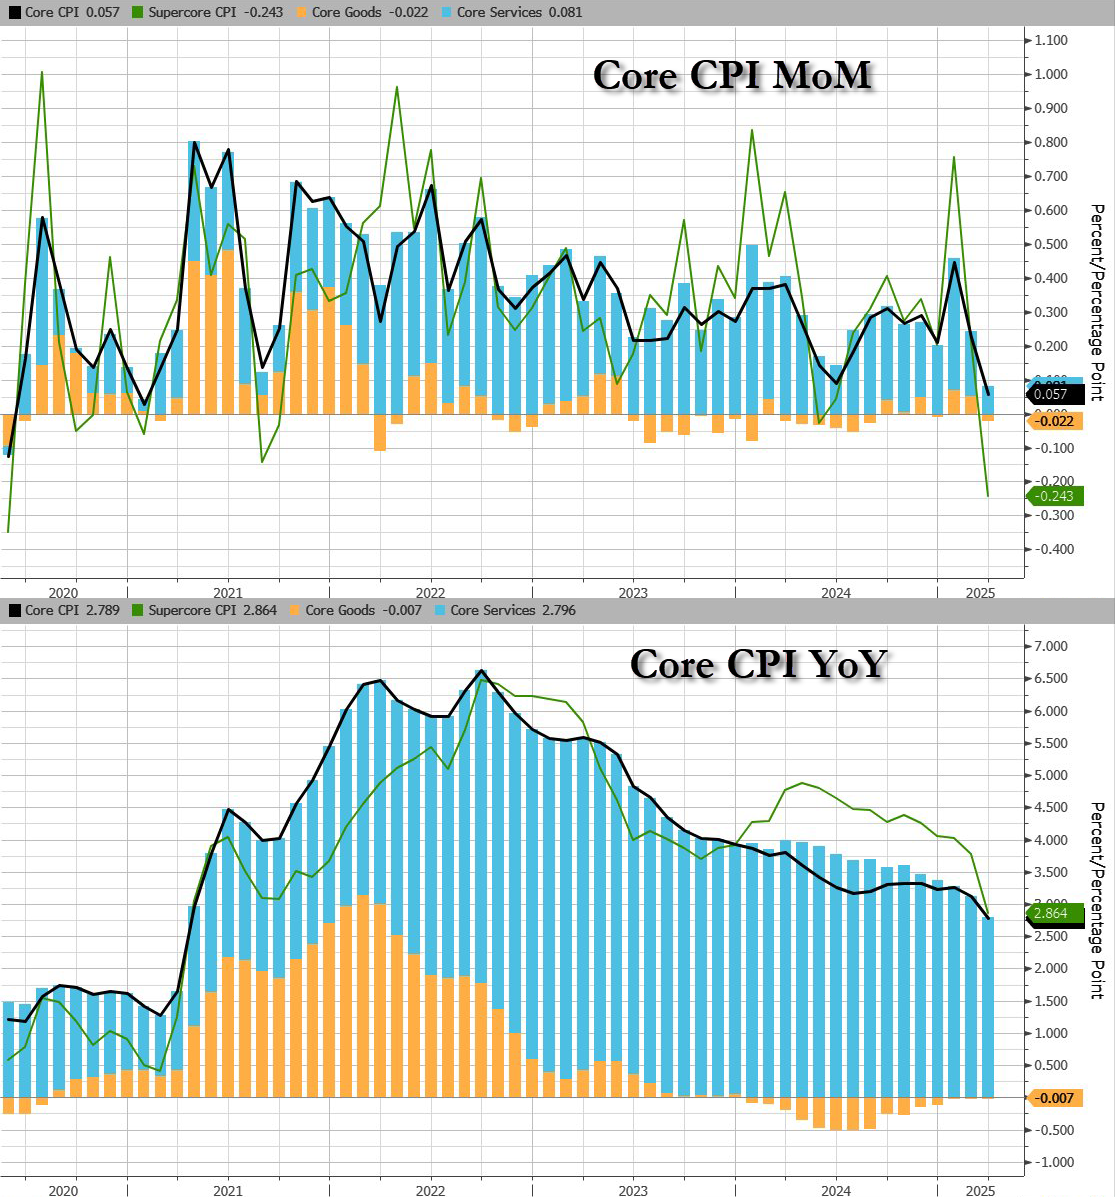
Services inflation tumbled…
Headline:
Core CPI:
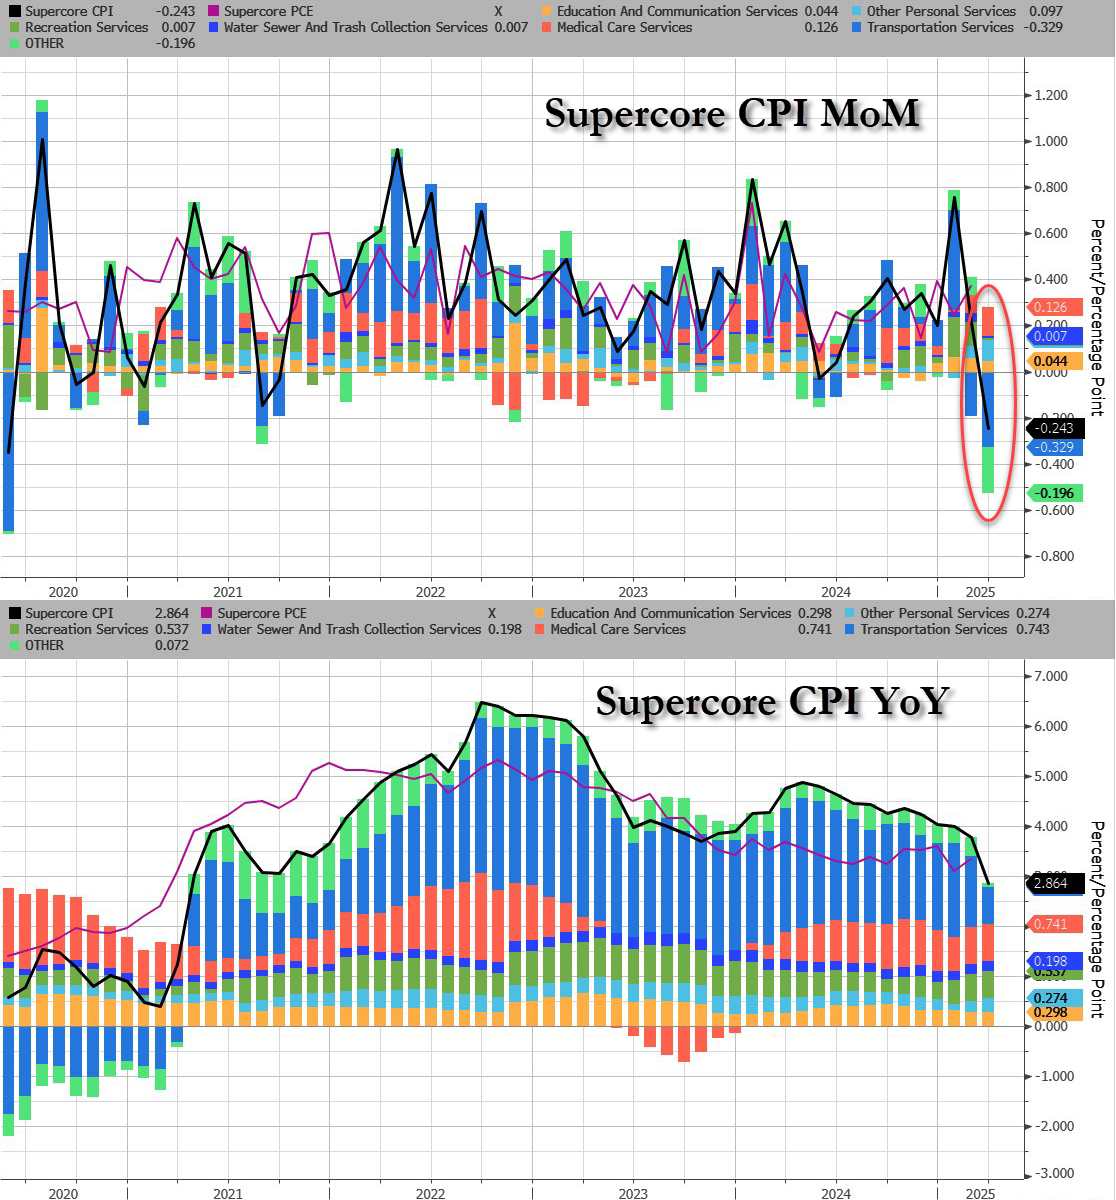
Core CPI details (MoM increase):
Core CPI details (YoY increase):
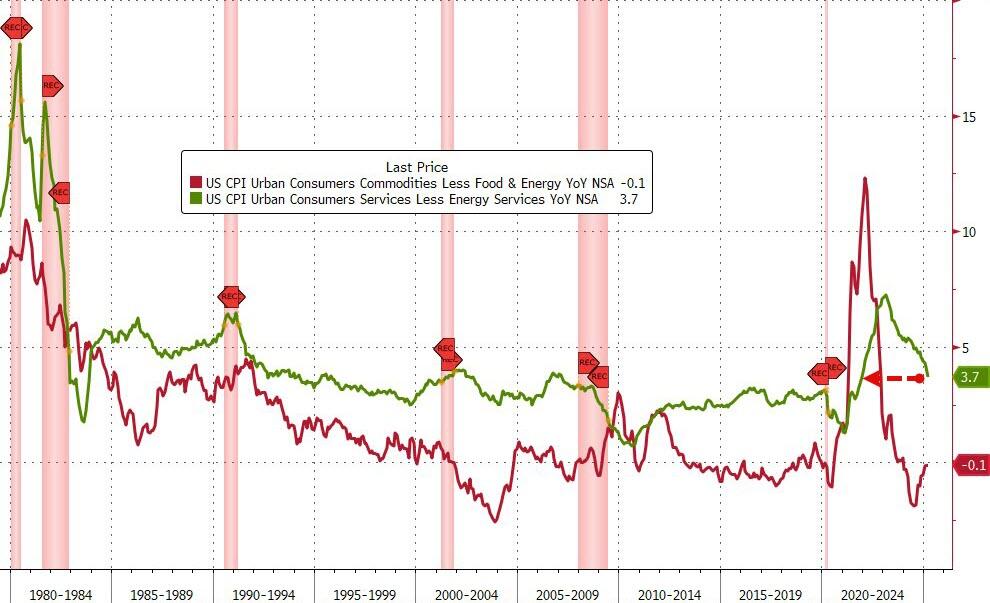
While goods inflation is flat (zero-ish), services cost inflation is fading fast…
Shelter and Rent inflation is slowing fast:

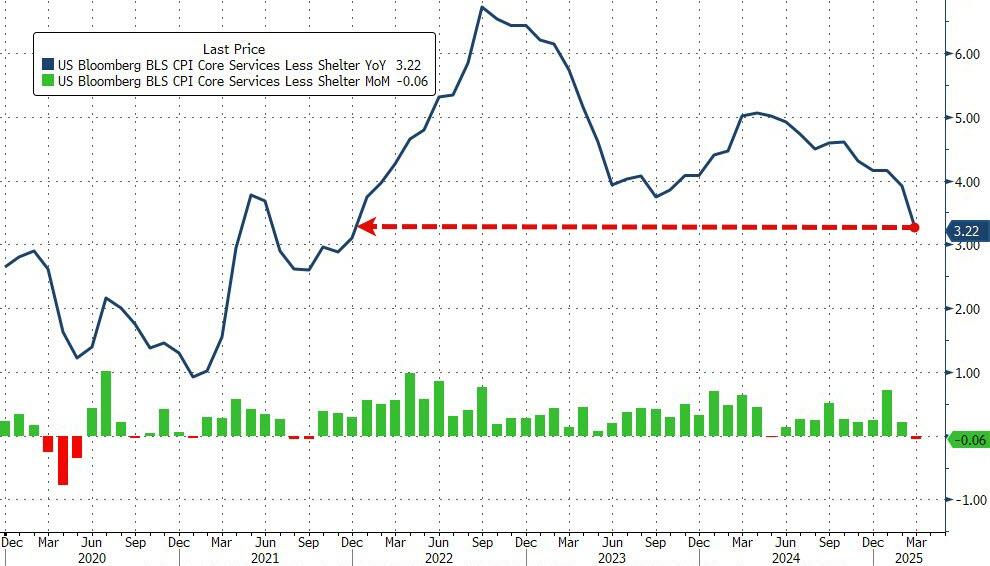
The so-called SuperCore CPI – Services Ex-Shelter – dropped 0.1% MoM dragging it down to +3.22% YoY – the lowest since Dec 2021…
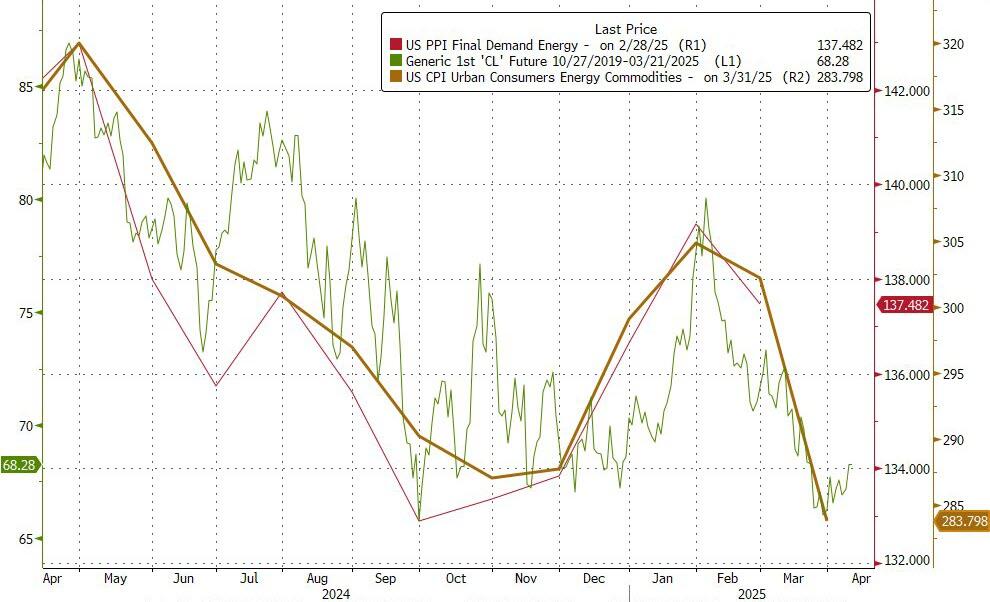
Drill Baby Drill (and tariffs recession fears) have dragged energy prices lower and pulled CPI lower with it…
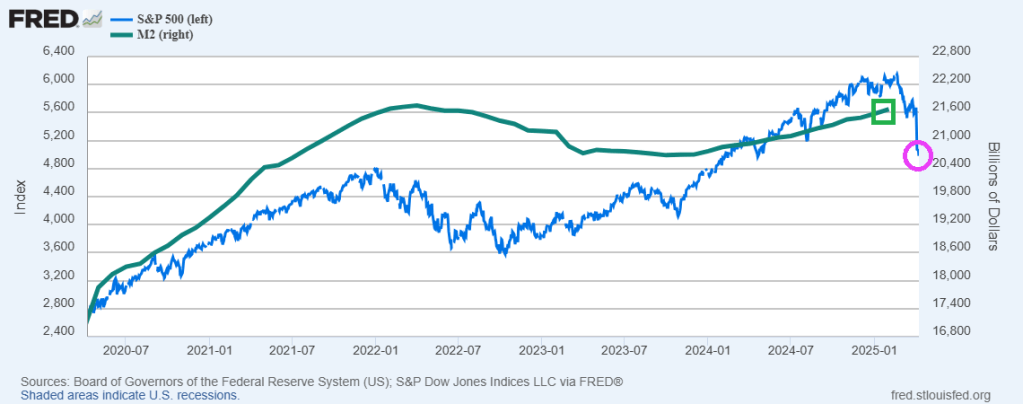
The Federal Reserve has created massive asset bubbles in financial markets. And the “tariff war” between the US and China. Since April 8, 2020, the S&P 500 index is up 81% while The Federal Reserve has printed a staggering amount of money as M2 Money is up 27.4% over the same period.
So, it is not surprising (except to Barstool Sports’ Dave Portnoy) that the stock market has declined with China’s childish petulance over Trump’s tariffs. While Trump levied a 104% tariff on Chinese goods, China counterattacked with a 84% tariff on US goods.

You must be logged in to post a comment.