Options imply a +/-1.1% move in S&P 500 for the 18-Sept FOMC meeting; this compares to an average of +/-1.2% move priced into SPX ahead of FOMC meetings since the beginning of 2022.
Arguably, this is an unusually important FOMC meeting due to the expected start of a cutting cycle.
On average, the S&P 500 has moved +/-1.3% during FOMC events since the beginning of 2022, coming above options implied moves.
In the July FOMC meeting the index moved +/-1.6% vs. an options implied expectations for a +/-1.1% move.
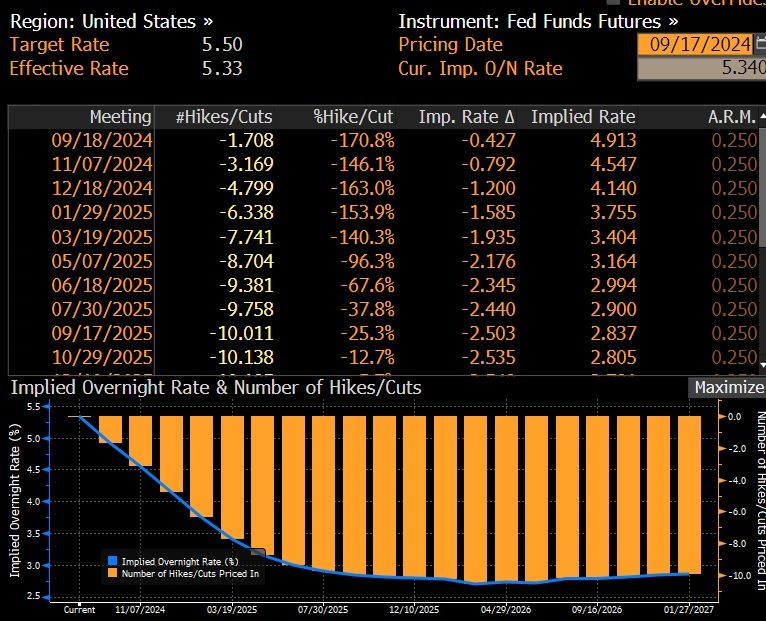
Goldman’s economists expect the September FOMC meeting to be the start of the Fed easing cycle with a 25bp rate cut followed by two consecutive 25bp rate cuts in November and December, and an eventual terminal rate of 3.25-3.5%.
They see differing asset performances around the start of the easing cycle depending on what motivated the Fed cuts.
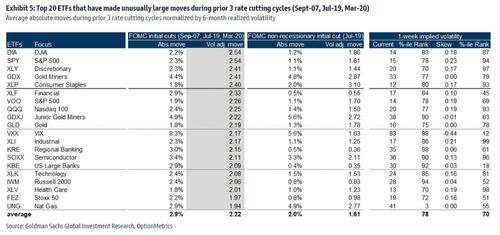
Goldman analyzed moves across stocks and ETFs during the first Fed rate cut in the prior 3 Fed easing cycles (18-Sep-2007, 31-Jul-2019 & 3-Mar-2020).
Rate cuts during the 2007 and 2020 easing cycles were associated with a recession while the 2019 cut was due to a growth scare.
In the tables below are the top 20 names that saw unusual moves during the prior 3 Fed easing cycles and for the 2019 cycle separately.
Financials and Tech were major movers during the beginning of the prior 3 Fed easing cycles while the 2019 cycle also saw unusual moves in Consumer Staples.
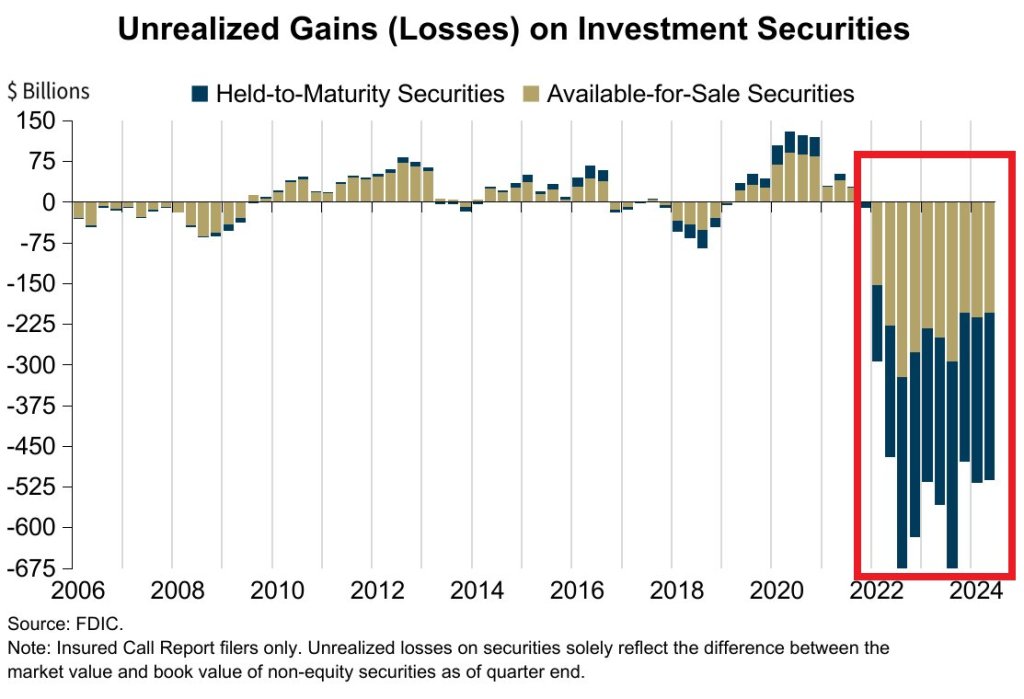
Q2 marks the 11th STRAIGHT quarter of unrealized losses on investment securities for banks, a streak never seen before. The number of banks on the FDIC Problem Bank List increased to 66 and represents 1.5% of total.
This is in addition to price Increases over last 4 years… CPI Medical Care: +7.8% CPI Apparel: +12.7% CPI Used Cars: +18.3% CPI New Cars: +20.5% CPI Food at home: +21.4% CPI Shelter: +23.4% CPI Food away from home: +25.4% CPI Electricity: +29.8% CPI Gas Utilities: +34.9% CPI Transportation: +38.8% US Home Prices: +48.0% CPI Auto Insurance: +52.4% CPI Gasoline: +53.5% CPI Fuel Oil: +54.9%
Don’t spill the wine, its too expensive under Biden/Harris/Powell.
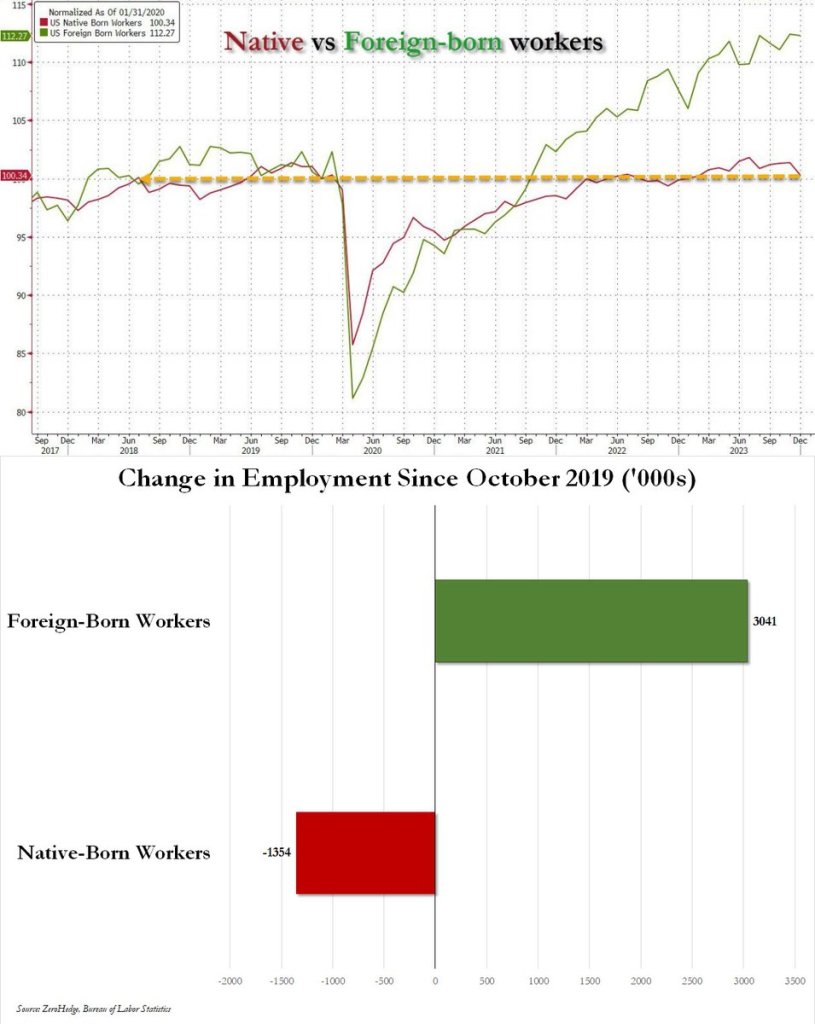
Since October 2019, native-born US workers have lost 1.4 million jobs; over the same period foreign-born workers have gained 3 million jobs.
Ay ay ay ay, ay ay ay ay!
The last three monthly jobs reports show aggregate job gains of 340K. Of that total 172K are accounted for by Health Care and Social Assistance and 60K by Government. Manufacturing jobs have shrunk by 34K; Professional and Business services, a 16k decline.
Biden/Harris have alliowed the US to be invaded. Under Harris, the new US national anthem will be Jesusita en Chihuahua.
2023 and early 2024 saw numerous months where BLS reported jobs added increasing by 200k or more. but after May 2024, jobs added have been slowing,
In August 2024, US nonfarm payrolls rose by 142K, with job gains in construction and healthcare. The unemployment rate held at 4.2%, and the labor force participation rate remained steady at 62.7%. Average hourly earnings increased by 0.4% to $35.21.
2,358 jobs were added in August. This is considerably below the average jobs added since April 2021 of 5,254 jobs added monthly.
Both previous months were revised sharply lower, so once again expect the August print to suffer the same fate. Specifically, the BLS said that the payroll print for June was revised down by 61,000, from +179,000 to +118,000, and the change for July was revised down by 25,000, from +114,000 to +89,000. With these revisions, employment in June and July combined is 86,000 lower than previously reported It also means that 4 consecutive job prints have been revised lower, and 6 of the past 7.
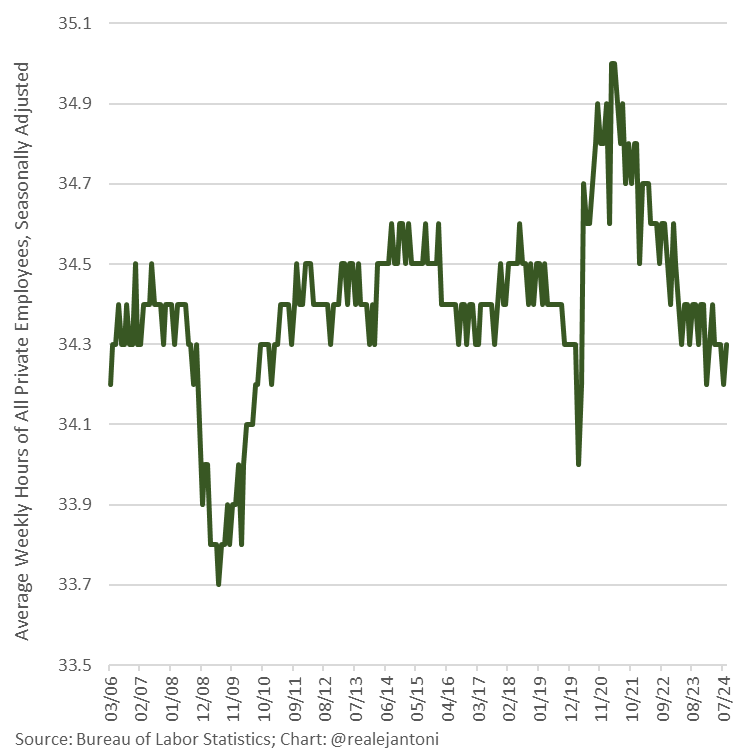
Weekly hours worked remains below pre-pandemic average; a fraction of an hour per week may not sound like much, but multiply that by over 150 million people and 52 weeks per year, and that’s a significant difference in man-hours worked and aggregate income.
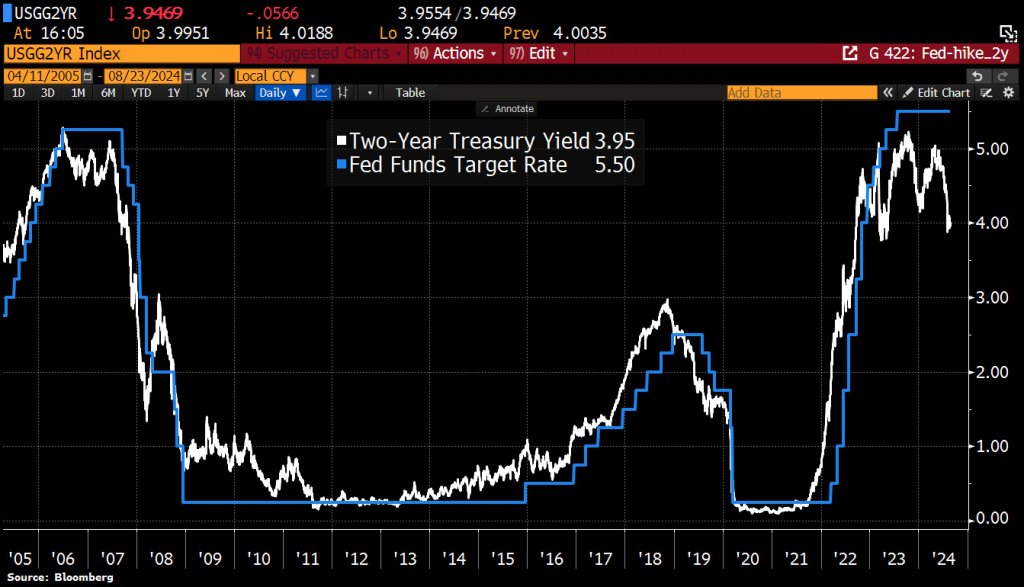
US 2y yields plunge to 3.95% as Fed’s Powell says ‘time has come’ to cut interest rates. Says Fed doesn’t seek, welcome further cooling in labor market.
Of course, there is a Presidential election in 60 days and The Fed doesn’t want the Orange Man to win. Instead, they want the Green Gal to win (Kamala Harris). Here is Green Gal (Harris) with Green Porker (Walz).
The US government now pays out on average $3bn in interest expenses per day…If the Fed cuts interest rates by 1%-point and the entire yield curve declines by 1%-point, then daily interest expenses will decline from $3bn per day to $2.5bn per day.
Even worse, unfunded Federal liabilities total $219 trillion while total US assets total only $213 trillion. In other words, if China (for example) forced us to pay off our unfunded liabilities like Social Security, Medicare, etc., we couldn’t.
Notice how NO politician ever discusses The Federal goverment spending LESS money. Particularly not Joe “The fool on the hill” Biden or Kamala “Word salad Kammie” Harris.
The Biden/Harris illiusionomics was built on false hoods.
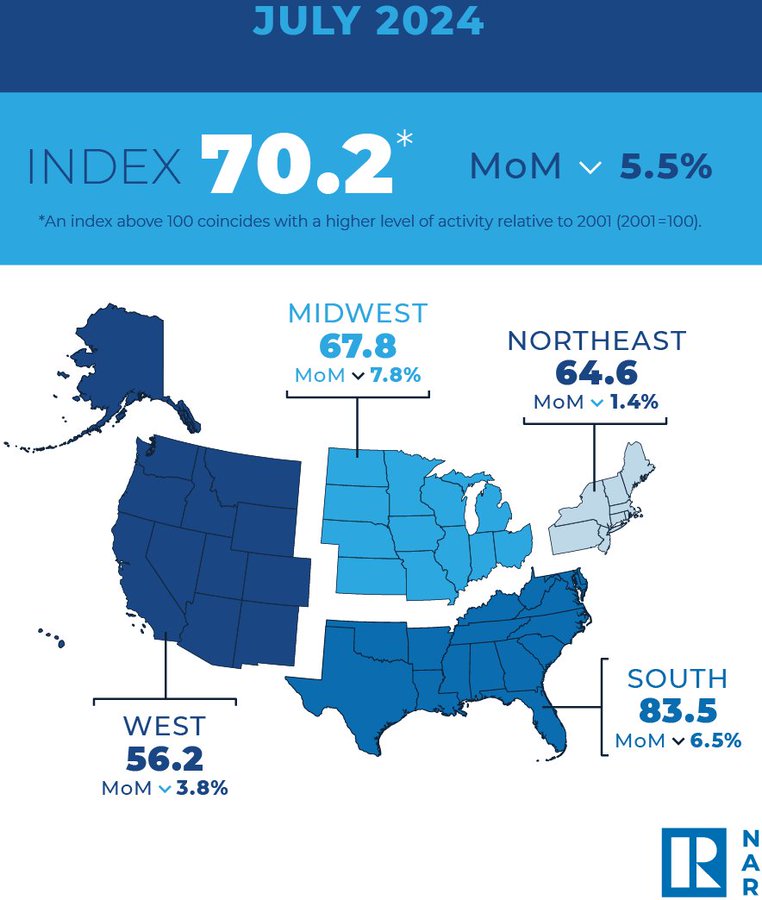
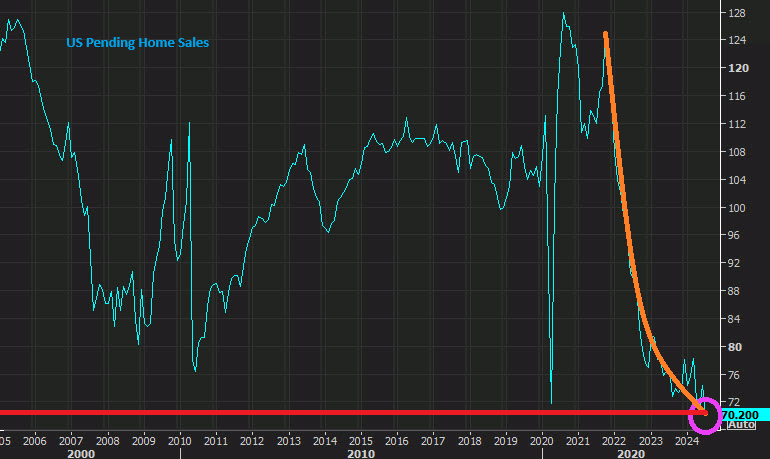
Look at pending home sales, now the LOWEST in history. The midwest led the decline in PHS at -7.8%.
Why? One reason is the illusion of a growing economy … that wasn’t growing organically. It was just Biden/Harris doling out trillions in handouts. Trillions of dollars in annual “consumer spending” is actually just government handouts being spent by people – it’s increased every month this year:


You must be logged in to post a comment.