Fear? The Omicron Variant Isn’t Scaring Treasury Investors (Treasury And US Dollar Swaps Curves Calm After Friday’s Flattening)

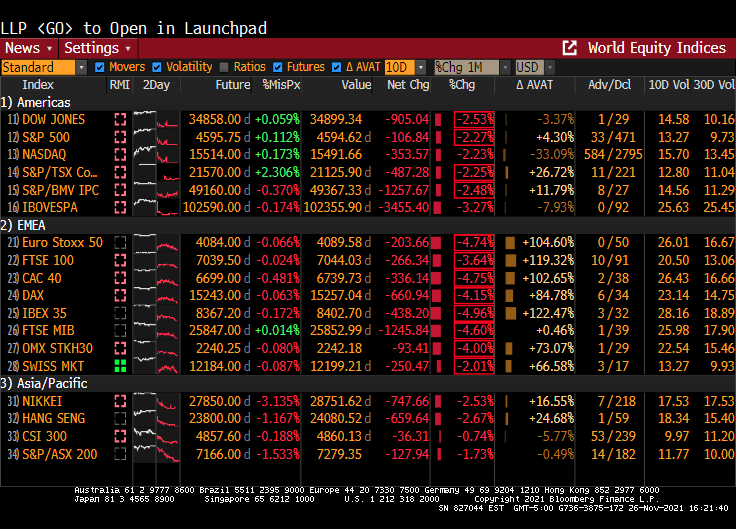
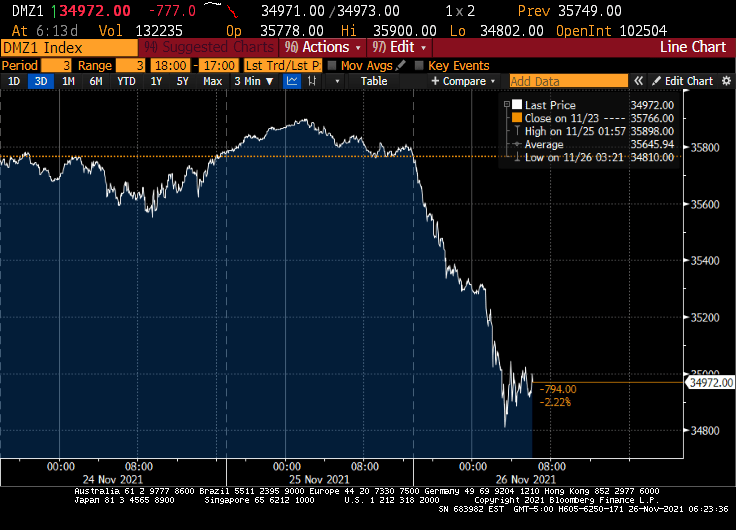
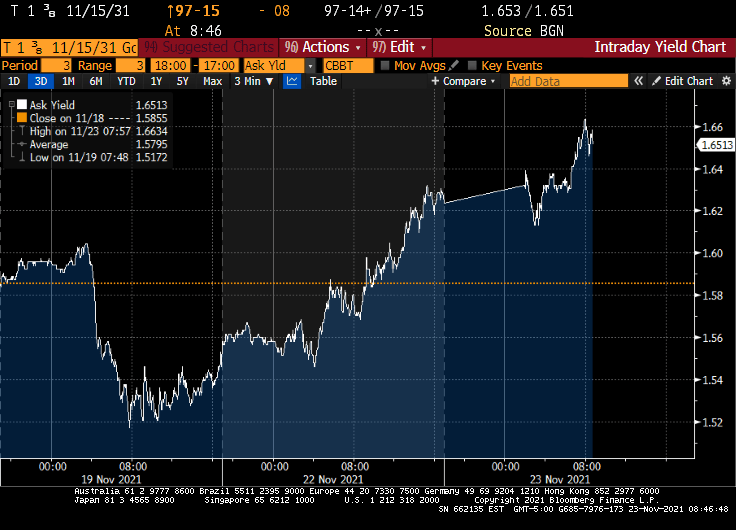
The latest scare hitting financial markets is the Omicron Variant (or Oh! Macron! Variant in France). While it caused an initial decline in global equity markets {Dow fell 900 points on early reports on Omicron), the Treasury market has been relatively unscathed.

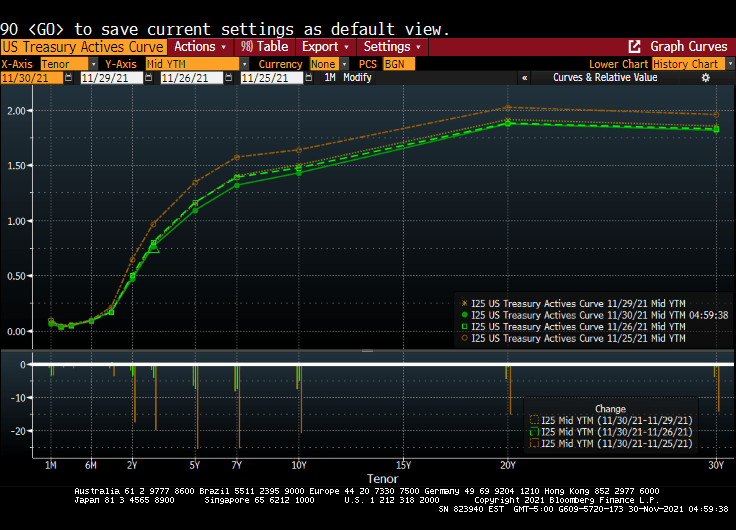
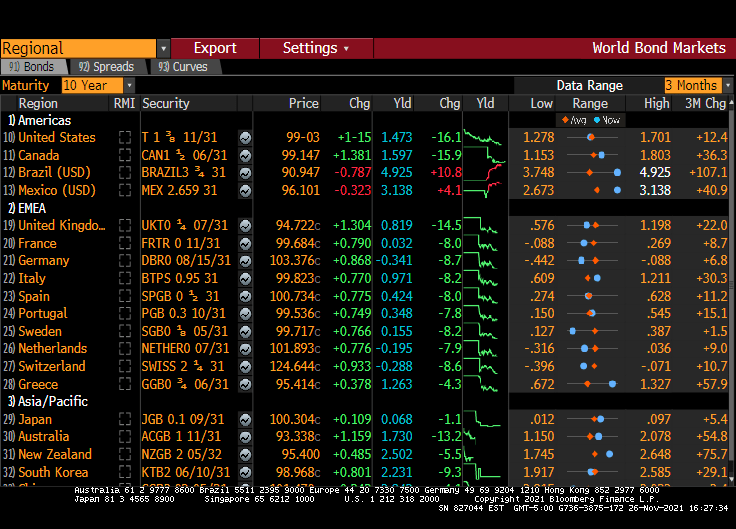
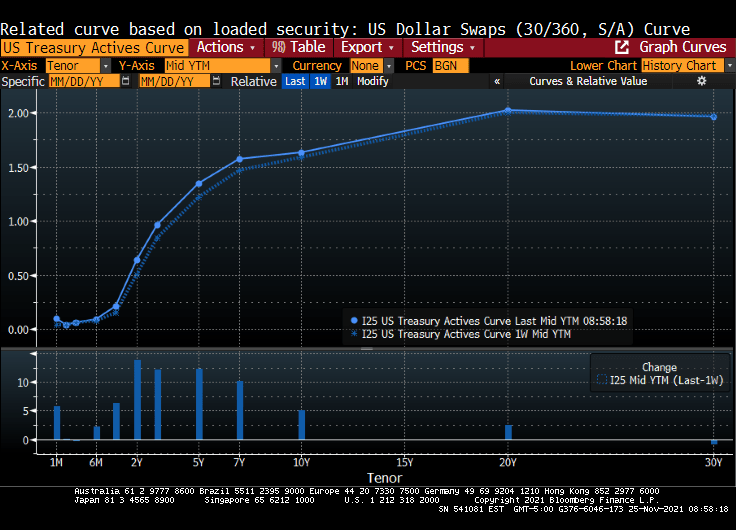
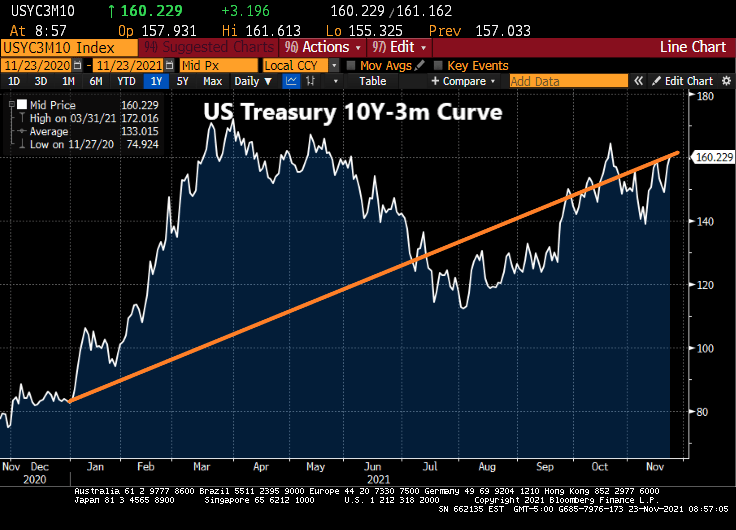
For example, the US Treasury Actives curve dropped last Friday (the orange line represents the Wednesday before Thanksgiving), while the remaining three lines represent last Friday, Monday and Tuesdays (today). In other words, the US Treasury Actives curve has been quiet so far this week after Friday’s flattening.

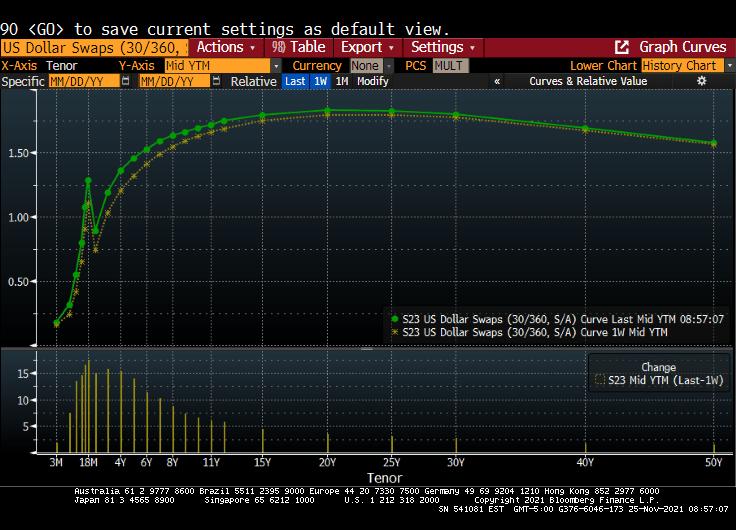
The US Dollar Swaps curve shows the same dynamics. The dark blue line is last Wednesday, while the remaining lines are last Friday, this Monday and today. Not a lot happening after the initial Omicron fear factor was priced in.

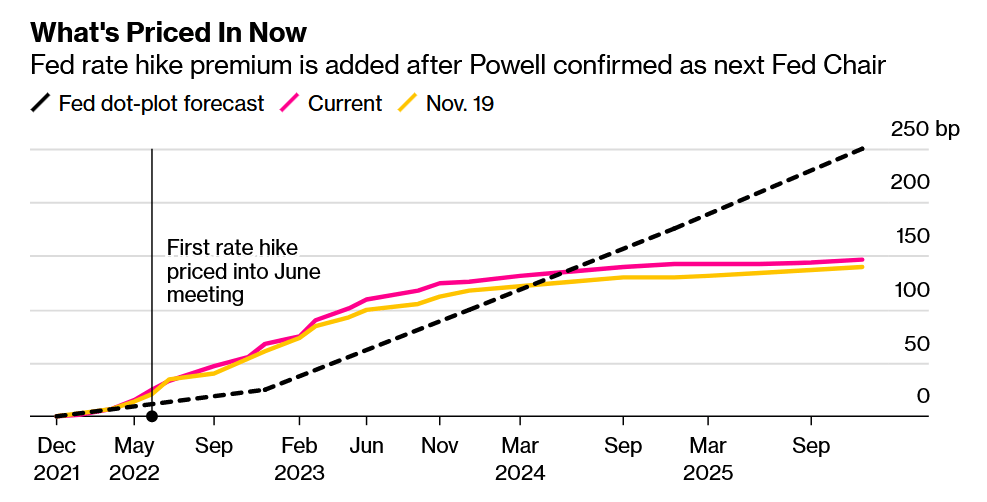
Federal Reserve Chairman Jerome Powell believes that the omicron variant of Covid-19 and a recent uptick in coronavirus cases pose a threat to the U.S. economy and muddle an already-uncertain inflation outlook.

“The recent rise in COVID-19 cases and the emergence of the Omicron variant pose downside risks to employment and economic activity and increased uncertainty for inflation,” Powell said in remarks he plans to deliver to Senate lawmakers on Tuesday. “Greater concerns about the virus could reduce people’s willingness to work in person, which would slow progress in the labor market and intensify supply-chain disruptions.”

Do I detect FEAR in Powell’s voice? The odds of rate increases for next year just fell to one rate increase at the September 2022 meeting.

On the equity side, it seems to be all about whether The Fed will withdraw its support. Back in early 2018, then Fed Chair Janet Yellen and the FOMC started to shrink the Fed balance sheet (green line). This resulted in the “Smart Money Index” declining. The S&P 500 index received a jolt with the Fed stimulus around the COVID outbreak and have taken off like a jackrabbit. Despite the Smart Money Flow index being lower than in 2017.

The VIX and VVIX are elevated showing fear in the equity markets. But much less than when COVID broke out in March 2020. Each spike in VVIX (or the volatility of VIX) is likely when Dr. Anthony Fauci opened his mouth.

So, is Omicron the “planet killer” or just another mild flu-like outbreak? The data is pointing towards the latter, but FEAR may cause it to be a bigger deal than is warranted.

How The Banking Crisis And Covid Lockdowns Killed Money Velocity (Death Of King Dollar)

I have written numerous times about nothing has been the same since the housing bubble burst and ensuing financial crisis of 2008. The crisis led to bank bailouts (TARP) and banking legislation (Dodd-Frank) giving The Federal Reserve even more power. And then the COVID lockdowns led to even MORE power for The Fed. And a horrid decline in money velocity (the ability of printing money to increase economic growth … or GDP).

But let’s take one step backwards. One the causes of the housing bubble that burst was President Clinton’s infamous National Homeownership Strategy that encouraged “partners” with the Federal government to soften underwriting standards for mortgage lending, particularly for minority households. The intent was to increase the homeownership rate in the US and it worked! Too well. Along with increasing the homeownership rate came rising home prices, culminating with home price growth reaching 14.5% YoY in September 2005. Only to start slowing to a crash.

Of course, the housing bubble was associated with no/low documentation and subprime mortgage lending. But the relaxing of underwriting standards by the National Homeownership Strategy helped fuel the no/low doc and subprime lending crisis. But weakening underwriting standards to increase homeownership rates is a dangerous strategy.

Note the surge in M1 Money Velocity (GDP/M1) starting in 1994. M1 Velocity grew until Q4 2007, then crashed along with home prices. The second and more sudden crash in M1 Velocity occurred with the COVID outbreak in March 2020 and the ensuing economic lockdowns and the intervention of The Federal Reserve in terms of money printing. M1 Money surged 173% from October 2008 to February 2020 and then another 369% from March 2020 to today. THAT is a Fed Storm Surge!!

M2, the broader definition of money, has not grown as rapidly as M1, but it still grew at an alarming rate. Atlanta Fed President Raphael Bostic blamed inflation on COVID but not The Fed’s insane money printing or government lockdowns. C’mon man!

Finally, the banking crisis (and TARP bailouts) along with COVID have made consumer purchasing power of King Dollar even worse.

Be careful of government strategies to make housing more “affordable” because they seem to make housing more expensive and can help crash the financial system.

Bitcoin Retreats 20% From All-Time High as Risk Assets Slump (Dow Retreats Almost 1,000 Points, Gold Advances)

It has been a grim Friday. The Dow fell 900 points, 10Y Treasury yields fell 16.1 basis points and West Texas Crude fell to $68.17.

Bitcoin tumbled 20% from record highs notched earlier this month as a new variant of the coronavirus spurred traders to dump risk assets across the globe.

The world’s largest cryptocurrency fell as much as 8.9% to $53,624 on Friday during London trading hours. Ethereum, the second-largest digital currency, dropped more than 12%, while the wider Bloomberg Galaxy Crypto Index declined as much as 7.5%.  On the other hand, gold rose as cryptos fell, then retreated as cryptos rebounded.

A new variant identified in southern Africa spurred liquidations across markets, with European stocks falling the most since July and emerging markets also slumping.

The Dow is down around 900 points … and look at Europe!

The 10-year Treasury yield is down 16.1 basis points. Most of Europe is down around 8-9 basis points while the UK is down 14.5 BPS.

And West Texas Intermediate crude futures are down to 68.17 from 78.39. No Jen Paski, this isn’t due to Cousin Eddie (Biden) releasing the Strategic Petroleum Reserve (SPR).

Maybe it was all the tryptophan released by eating turkey.

A day to remember.

Post-Thanksgiving Indigestion: Inflation And Another COVID Scares Spooking Markets (Dow Futures Down 777 Pts, US Treasury 10Y Yield Down 11 BPS, Oil Drops 7%)

Thanksgiving has come and gone. But Americans have a lot to be scared about: inflation (turkey prices were up 24% according to the Farm Bureau and a new COVID outbreak B.1.1.529 — has been identified in South Africa.

Gut-wrenching inflation is already priced in, but yet another COVID outbreak (and the possibility of more economic shutdowns, more vax mandates and more stern lectures from Anthony Fauci) are spooking markets.

Down Futures are down 777 as I write this note.

The 10-year Treasury yield is down 11.2 basis points.

And West Texas Intermediate crude prices are down 6.62%.

Joe Biden: “Save the neck for me Clark!”

Treasuries Curve Flattens Sharply After Data Dump, Fed Minutes (Market Update)

Its Thanksgiving in the USA! Confession: I don’t like turkey. Prime rib with horseradish sauce? You bet!!

Anyway, Treasuries ended mixed Wednesday with the yield curve sharply flatter after a raft of U.S. economic data and minutes of the November FOMC meeting bolstered expectations for an earlier start to Fed rate increases. Two- and 5-year yields reached YTD highs, and 5s30s spread reached narrowest since March 2020. 

Over the past week, the Treasury actives curve rose 13.85 basis points at the 2 year tenor.

Yields ended richer by ~6bp across long-end of the curve, while front-end cheapened almost 3bp; 2s10s flattened more than 5bp, 5s30s more than 6bp; 10-year yields shed ~3bp to ~1.635%
Release of Nov. 2-3 FOMC meeting minutes drew minimal market reaction, as flatter curve held its shape.

The US Dollar Swaps curve rose from the previous week as well.


Minutes said participants considered elevated inflation as likely transitory, “but judged that inflation pressures could take longer to subside than they had previously assessed”

Earlier, front-end and belly sold off after a heavy slate of U.S. economic data including the lowest initial jobless claims tally since 1969

Also during U.S. morning, Fed’s Daly said she would support accelerated tapering of asset purchases, which added to pressure across front-end Treasuries

Subsequently, eurodollars traded heavy over the session as rate-hike premium continued to ramp up in 2022 and 2023; overnight index swaps showed 30% chance of a March hike, while around three hikes — or 75bp — were priced in by the end of next year

Wishing you a happy Thanksgiving! In my dreams!

Renter Misery Index At 17.42% With Traditional Misery Index At 10.80% (Biden Says $5 TRILLION “Build Back Better Boondoggle” Will Relieve Inflation Over 10 Years)

Renters in the US are getting clobbered by inflation.

The US Zillow Rent Index All Homes YoY + CPI YoY is one measure of renter misery.

The classic misery index (CPI YoY + U-3 unemployment rate) is 10.80%.

Then there is inflation in food prices, gasoline, heating oil, natural gas, etc.

While Biden is releasing the Strategic Petroleum Reserves (SPR) in order to mitigate the problem that he created by terminating the energy pipelines and oil/natural gas drilling permits in the name of “Going Green!” But on the announcement of tapping the SPR, crude oil futures actually rose.

But never fear! Biden claims that his $5 TRILLION Build Back Better Boondoggle (BBBB) will ease inflation … over 10 years. And he claims that “17 Nobel Prize winners in economics have said that my plan will “ease inflationary pressures.”” I sincerely doubt that any of them actually read the 2,500 page BBBB. Rather, they likely just read the White House talking points and said “Hey, that sounds good!” Mo money, less problems?

Here is Joe Biden breaking the legs of America’s renters. Or is that multi-millionaire Nancy Pelosi?

Biden Picks Powell Over Brainard, 10-Year Treasury Yields Rise (10Y-3M Treasury Curve Rose From 83 BPS At End Of 2020 To 160 BPS Today)

President Biden nominated Jerome Powell for a second term as Fed Chair and nominated Lael Brainard as Deputy Chair to replace Richard Clarida. The US House of Overlords (aka, the US Senate) will hold hearings on the nominees (with Elizabeth Warren opposing Powell and supporting Brainard’s nomination).

Treasury yields jumped and U.S. index futures signaled a continued selloff in technology shares as traders pruned bets for a dovish-for-longer Federal Reserve after the renomination of Jerome Powell as its chair.

Contracts on the Nasdaq 100 Index fell 0.3% after Monday’s last-hour selloff in technology stocks. The subgroup was the worst performer in Europe Tuesday, sending the region’s benchmark to a three-week low. A currency crisis deepened in Turkey, with the lira weakening past 13 per U.S. dollar. Zoom Video Communications Inc. lost 9% in premarket trading on slowing growth.

Investors are reducing expectations for a deeper dovish stance by the Fed after Powell was selected for a second term. The chair himself sought to strike a balance in his policy approach saying the central bank would use tools at its disposal to support the economy as well as to prevent inflation from becoming entrenched. 

Fed rate hike premium is added after Powell confirmed as next Fed Chair:

Change in Fed’s interest-rate target implied by overnight index swaps and eurodollar futures.

Fed Bank of Atlanta President Raphael Bostic said Monday the U.S. central bank may need to speed up the removal of monetary stimulus and allow for an earlier-than-planned increase in interest rates.

Translation: Markets are pricing in MORE hawkish Powell over uber-dove Brainard. The 10-year Treasury yield has risen from 1.52% to 1.65%

And the 10Y-3M Treasury curve has risen from 83 basis points at the beginning of 2021 to 160 basis points today. I will this the Biden Inflation Effect (BIE).

Let’s see if Powell & Company deliver on removing the excessive stimulus from the market, particularly with midterm elections approaching.

Misery! Inflation Overwhelms Improvements In Unemployment (Misery Index Above 10)

The Misery Index, inflation plus unemployment, is over 10% at 10.80%.

Unemployment has been steadily declining since the COVID shutdowns of 2020. The real culprit has been rapidly rising since COVID as well. At this point, inflation improvements (that The Fed is chasing) have been overwhelmed by inflation (which is being caused by The Fed’s monetary policy and Federal policies).

Powell has said that he is not going to raise rates until unemployment has improved, but risk more explosive inflation in striving to improve unemployment.

How I feel about Biden announcing Powell’s reappointment and uber-dove Brainard appointment as Deputy Fed Chair.

Home Sales Rose 0.8% MoM In October As Investors Rushed Into The Market (Inventory Remains Thin, Median Price +13.1% YoY)

Fools rush in … or at least investors rush into the US housing market. Investors made up 17% of existing home purchases in October.

Inventory of homes remains depressed and with investors picking up 17% of homes for sale, the median price of existing homes rose to 13.1% YoY.

While existing home sales rose 0.8% MoM, they fell -5.79% on a YoY basis as M2 Money slowed.

It is lonesome town for inventory. But it will be a poor little fool for those buying into this thin inventory market if home prices correct.

President Biden has decided to nominate Fed Chair Jerome Powell for a second term in an effort not to rock the boat. Lael Brainard is nominated for Deputy Chair.

Bernie’s & Biden’s Build Back Better Bill Balloons To $5 TRILLION From $2.4 TRILLION (More Than Biden’s Quote Of $0)

To quote Gomer Pyle USMC, “Surprise, surprise, surprise!”

The humongous spending bill awaiting Joe Manchin to sign off on it will cost almost double what the CBO said it would. Why? Because spending programs in Washington DC never get cancelled, they only grow.

The Committee For A Responsible Federal Budget estimates that the true cost of Build Back Better is $4.91 TRILLION, up from the stated $2.39 TRILLION. Once they assumed that the programs don’t sunset and get extended.

According to their analysis,

“We estimate the House Build Back Better Act includes roughly $2.4 trillion of spending and tax cuts along with roughly $2.2 trillion of offsets.However, the bill relies on a number of sunsets and expirations to keep the official cost down. If the plan’s temporary policies were made permanent, we find the cost would increase by as much as $2.5 trillion.As a result, the gross cost of the bill would more than double from $2.4 trillion to $4.9 trillion.

The Build Back Better Act relies on a number of arbitrary sunsets and expirations to lower the official cost of the bill. These include extending the American Rescue Plan’s Child Tax Credit (CTC) increase and Earned Income Tax Credit (EITC) expansion for a year, setting universal pre-K and child care subsidies to expire after six years, making the Affordable Care Act (ACA) expansions available through 2025, delaying the requirement that businesses amortize research and experimentation (R&E) costs until 2026, and setting several other provisions – from targeted tax credits to school lunch programs – to expire prematurely.

Excluding changes to the state and local tax (SALT) deduction, we estimate the Build Back Better Act would cost $2.1 trillion as written. We estimate making all of these temporary policies permanent would cost roughly $2.2 trillion, more than doubling the gross cost of the bill to $4.3 trillion through 2031.”

When asked about the Center for a Responsible Budget saying the bill could be twice as expensive, Manchin replies “it’s concerning. Sure. It’s concerning.”

Surprise, surprise, surprise! And it is certainly more expensive than the estimate Biden gave: $0.