Hey, I thought the vaccine mandates and masks were supposed to stop COVID and its mutations in its tracks!
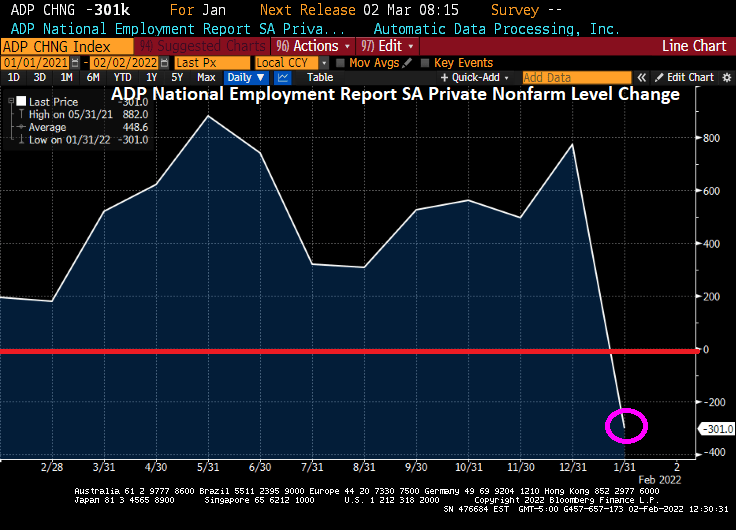
Instead, Omicron has taken a much bigger bite out of the labor market than expected, data from payroll processing firm ADP indicated Wednesday.
The number of workers on private payrolls fell by 301,000 in January, falling far short of expectations for growth of 225,000 jobs.
This was the first decline in payrolls reported by ADP since 2020.
The leisure and hospitality sector shed 154,000 jobs. Trade, transportation, and utilities dropped 62,000 workers. Other services saw payrolls decline by 23,000. Health and education jobs fell by 15,000. Information technology jobs fell by 8,000 and financial services sank by 9,000.
Manufacturers cut 21,000 positions. Construction declined by 10,000. Mining and natural resources added 4,000.
All told, the services sector’s payrolls fell by 274,000 and the goods-producing sector’s payrolls dropped by 27,000.
The Department of Labor will report the official count for January jobs on Friday. It is expected to show that jobs grew by around 170,000 but that may be an underestimate of the impact of omicron.
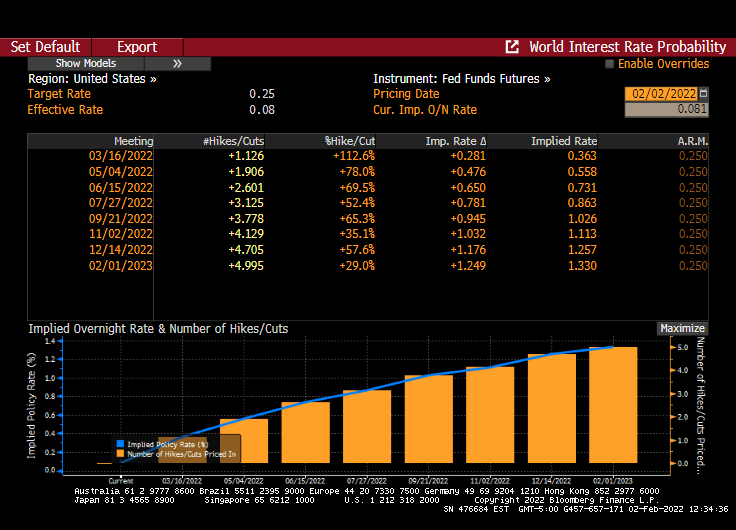
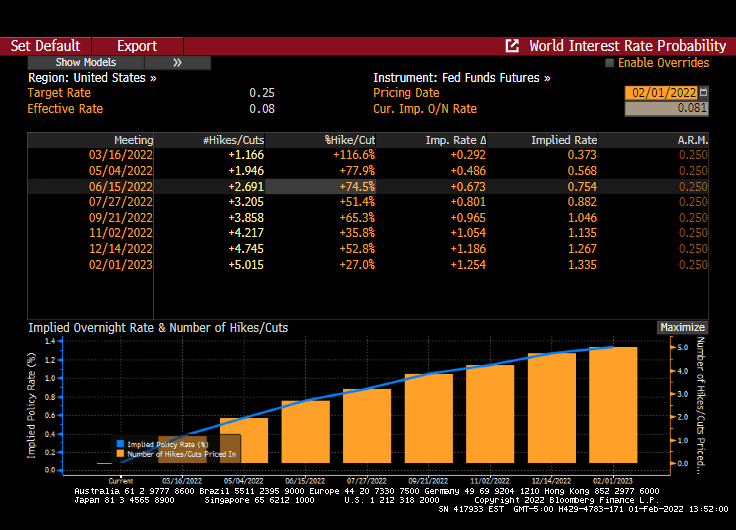
Since Omicron can be readily blamed for ADP report, it doesn’t look like it has affected the implied probability of 5 rate hikes over the next year.
(Bloomberg) — The White House is lowering expectations for this week’s U.S. jobs report, saying that brief absences of workers due to omicron could overstate the number of unemployed people for last month.
Several White House officials have teed up Friday’s report with warnings, saying that the week when surveys were taken for the January payroll numbers was the height of illness absences in the aftermath of the holidays.
Brian Deese, the director of President Joe Biden’s National Economic Council, said the numbers could be “confusing” as Covid illnesses are recorded as job losses.
“We expect that that will have an impact on the numbers,” Deese told MSNBC on Tuesday. “We never put too much weight on any individual month; this will particularly be true in this month, because of the likely effect of the short-term absences from omicron.”
Biden has repeatedly touted employment data as an indicator of a robust economic rebound, and highlighted the tumbling jobless rate to blunt criticisms about overheated inflation. Friday’s report may still show historically low unemployment, which is based on a separate survey from the one for payrolls and counts temporary, unpaid sick leave differently.
LaborSecretary Marty Walsh and White House Press Secretary Jen Psaki have also delivered warnings that the official January jobs gain may be poor.
If a worker was out “and did not receive paid leave, they are counted as having lost their job,” Psaki said Monday. Nearly 9 million people missed work due to illness in January, when the data were being collected, she said.
“So we just wanted to kind of prepare, you know, people to understand how the data is taken,” she said. “As a result, the month’s jobs report may show job losses in large part because workers were out sick from omicron.”
Economists expect nonfarm payrolls to rise by 150,000 for January — the weakest reading since the end of 2020. The U.S. unemployment rate is seen remaining unchanged, at 3.9%, according to the median estimate of forecasts compiled by Bloomberg.
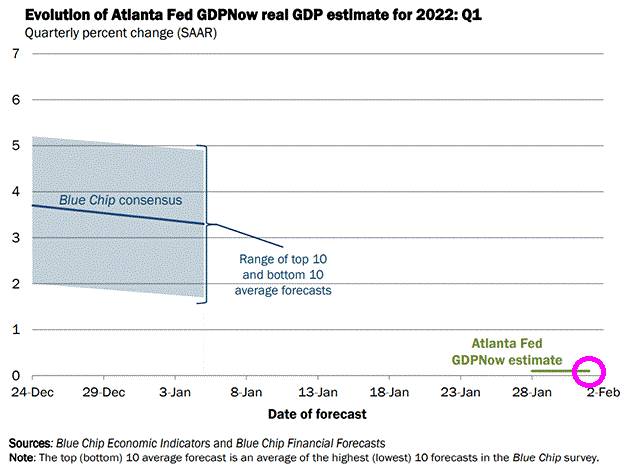
So, are Dreese and Psaki saying that US GDP will roar back … from 0.1% … if Omicron fades away? And that all the fiscal and monetary stimulypto are going to cease creating problems??
Despite the fear of Omicron in the upcoming jobs report, there are still 5 rate hikes on the horizon to combat inflation … created by the Biden Administration and Federal Reserve as they combated COVID with massive fiscal and monetary stimulus.
But don’t worry, the Biden Administration ordered rapid test kits from China … and they have arrived!
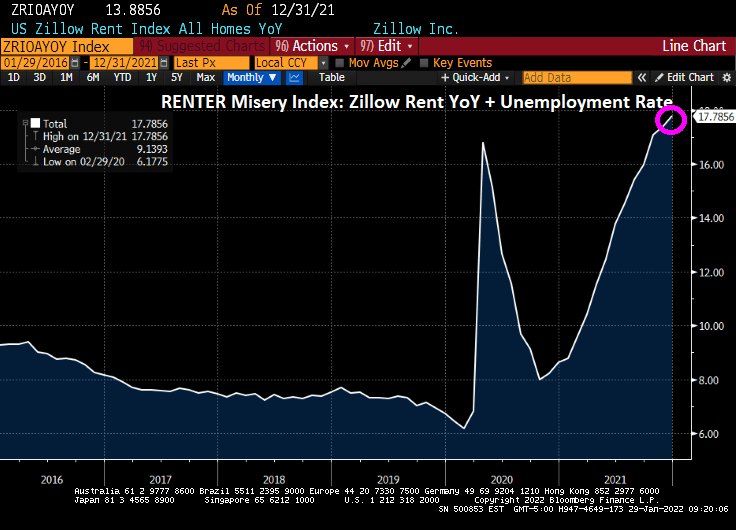
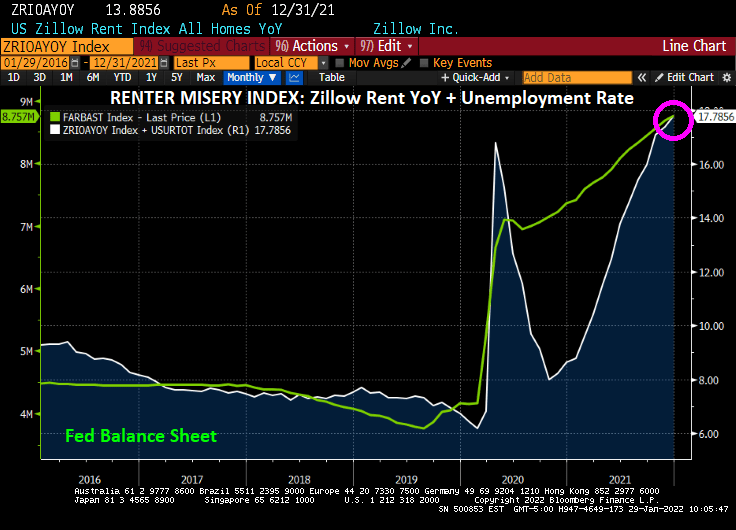
The misery index is traditionally inflation rate plus U-3 unemployment rate. The RENTER misery index is the Zillow Rent Index YoY + U-3 unemployment rate to demonstrate the hardship of renters because of soaring home prices.
Notice that because of rising home prices, the Renter misery index has overwhelmed the improvement in unemployment.
As I typically do, I will now include The Fed’s balance sheet (as a proxy for Fed stimulus and supporting Federal government expenditures). Yes, you can see that The Fed and Federal government are responsible for our modern day “Grapes of Wrath.”
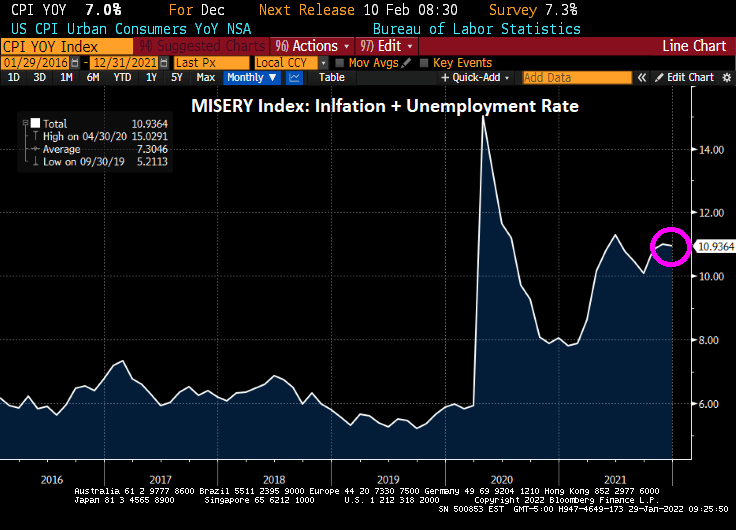
If we look at the TRADITIONAL misery index, we see that misery remains above 10 (it was below 6 prior to the COVID outbreak in early 2020).
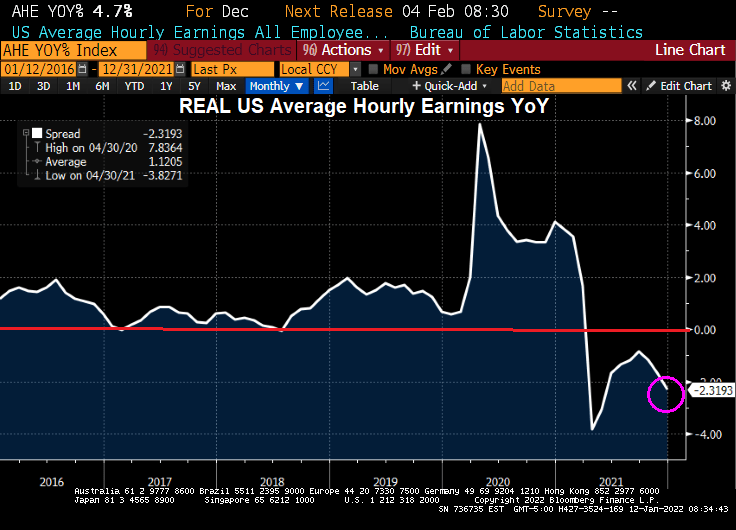
Remember that the REAL average hourly earning growth of Americans is NEGATIVE. Gains in wage growth more than offset by inflation.
I won’t even mention how inflation is crushing retirees since Social Security and pension plans rarely adequately compensate retirees for inflation.
Now for the really bad news. 81-year old senior, House Speaker Nancy Pelosi, has announced that she is running for Congress yet again from leftist-stronghold San Francisco. Although she has an expensive home in Georgetown and a beautiful vineyard in Napa Valley. Pelosi’s vineyard only sells grapes to other wine makers. Not bad for a career civil servant!
I really wanted Pelosi to produce a wine called “The Grapes of Wrath” in honor of her insider trading and massive wasteful spending of taxpayer money that has helped generate inflation, rampant government debt growth and hurting retirees and hourly workers.
The Case-Shiller National home price index “slowed” to 18.81% YoY in November as The Fed continues its monetary stimulypto. Notice that The Fed is easing even when there is limited inventory available. Result? Hideous home price inflation.
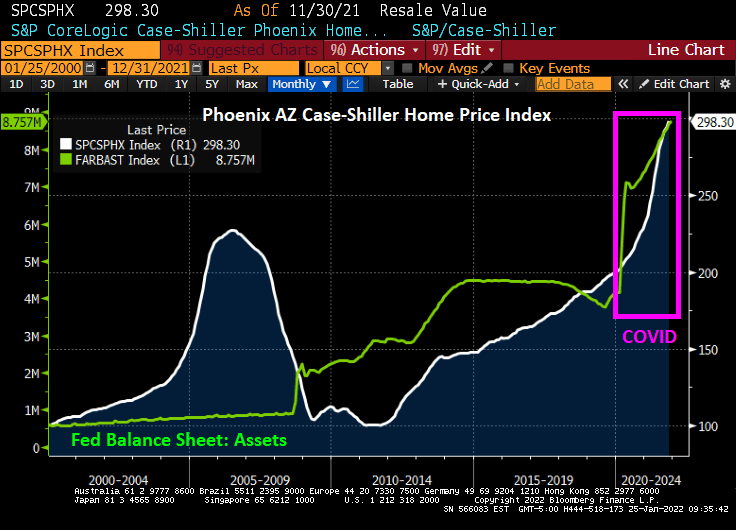
Which metro area is growing the fastest, making housing even more unaffordable for renters? Phoenix AZ is growing at a 32.2% YoY clip while Washington DC is the slowest growing metro area at 11.1% YoY. The second faster growing metro area in Tampa FLA.
Phoenix AZ is growing at the fastest rate in the nation as The Fed still has its monetary stimulus at FULL SPEED AHEAD.
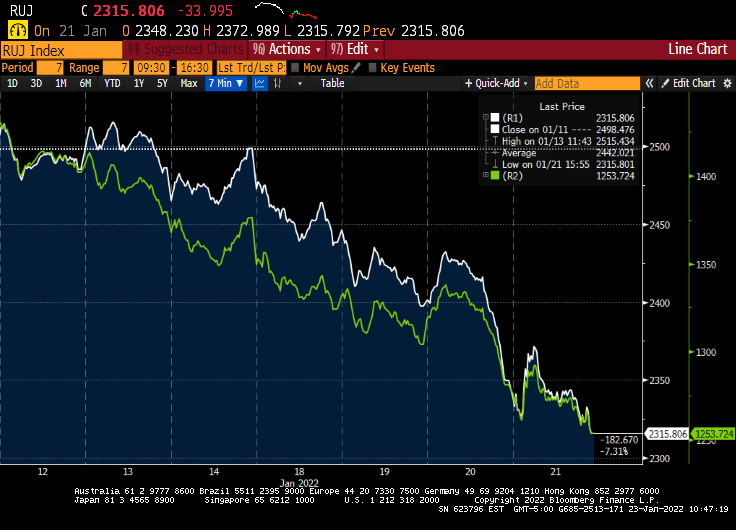
It has been a tough 7 days for Bitcoin, Ethereum and the NASDAQ composite index as The Fed is anticipated to raise their target rate AND engage in quantitative tightening.
While the NASDAQ composite index has been deflating over past 7 days, Bitcoin and Ethereum plunged in recent days. What is going on??
The Russell 2000 value (white) and growth (green) indices are both deflating.
With regards to anticipated Fed rate increases, Fed Funds Futures are signaling almost 4 rate hikes in 2022 and 4 by the February 2023 meeting.
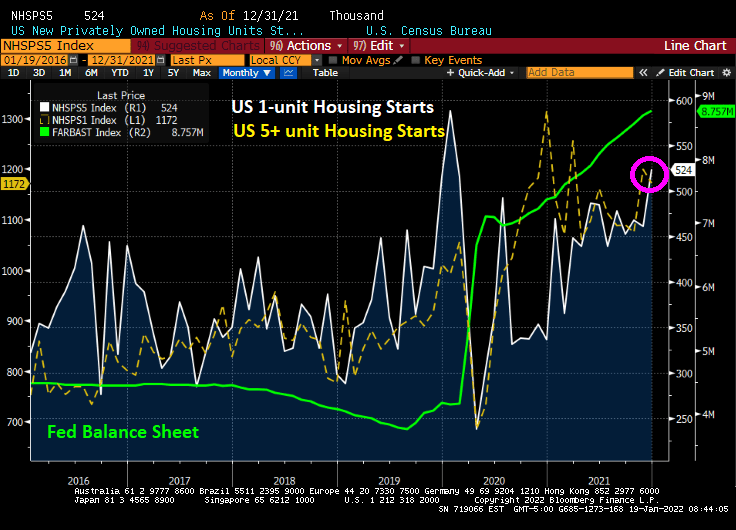
Then we have the massive increase in The Fed’s balance sheet after COVID struck in early 2020. Now, with the S&P 500 skyrocketing (until 7 days ago), why is The Fed buying sooooo much Agency MBS??
Now we have people like JPMC’s Jaime Dimon speculating about 7 rates increases in 2022 and other bankers speculating about a faster than expected withdrawal of the The Fed’s monetary stimulus in the form of asset purchases, we have to anticipate what the result will be in markets.
Like what will happen to housing starts if and when the stimulus is removed.
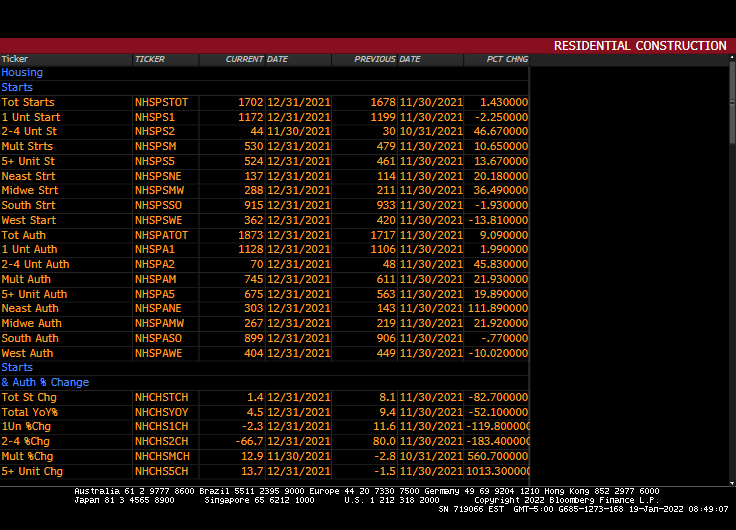
Today, we saw 1-unit housing starts fall 2.25% from November to December, but multifamily (5+ unit) starts rise 13.7%.
Of course, home price growth of near 20% YoY combined with declining REAL hourly earnings points to more multifamily housing and less single-family detached housing.
Here is the rest of the story, as Paul Harvey used to say. 5+ unit permits are up 19.9% in December while 1-unit permits are up 1.99%.
Well, Omicron is hitting hard. Not the virus itself, but governments’ reaction to the virus. The NY Empire Manufacturing Index has tanked into negative territory.
New orders are down 5%.
On the energy front, West Texas Intermediate Crude Oil futures are up 79% since January 1, 2021 while regular gasoline prices are up “only” 50% over the same period.
How about inflation and the Treasury yield curve? Inflation has soared to 40-year highs under Biden as energy prices (WTI Crude Futures) have soared 79%.
Container ships are still backed-up at LA and Long Beach ports. I thought Mayor Pete was supposed to fix the port congestion problem!
If you look at the following chart, you can see multifamily (5+ unit) starts remain elevated (pink box) which is not surprising given that home prices at growing at 19.1% YoY nationally (orange circle) and REAL hourly earnings have declined (yellow triangle) thanks to reemergence of inflation after 40 years.
Then we have the humming dragon, rising mortgage rates, that will reduce housing affordability even further.
Start with the UMich Buying Conditions for Houses. It “rose” to 83. Unfortunately, 100 is the baseline and any number below 100 is bad. The reason? The massive increase in US home prices since 2020.
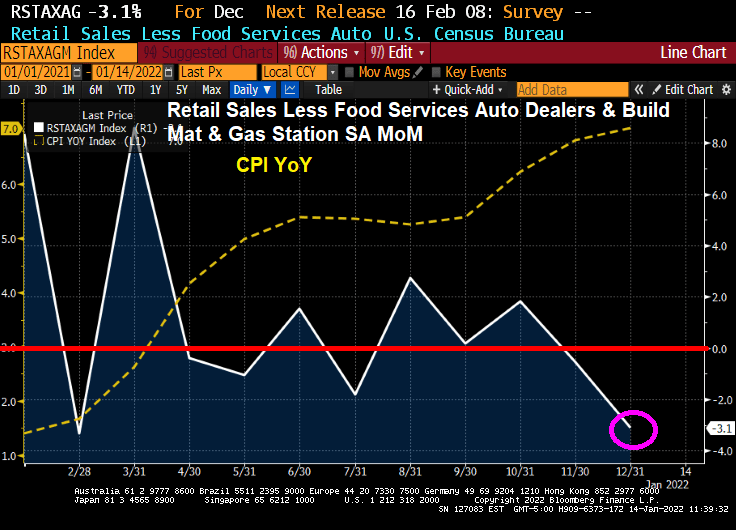
But retail sales are hurting thanks to higher prices. Retail sales less food services and auto are DOWN 3.1% MoM.
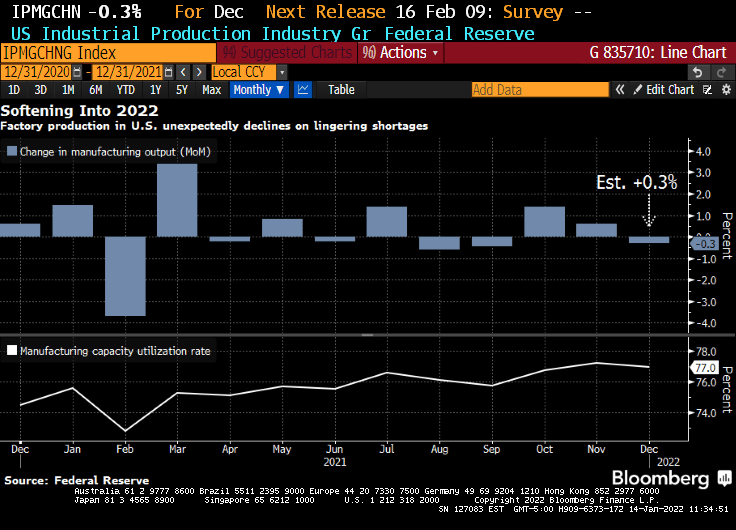
Meanwhile, US industrial production fell to -0.3%.
Mortgage rates in the U.S. rose for a third straight week, reaching the highest point in almost two years.
The average for a 30-year loan was 3.45%, up from 3.22% last week and the highest since March 2020, Freddie Mac said in a statement Thursday.
Rates tracked a jump in yields for 10-year Treasuries, which climbed to levels not seen since early 2020, before the pandemic roiled financial markets. Signs point to borrowing costs rising further as the job market improves and the Federal Reserve steps up its efforts to tame inflation.
That would increase the burden on homebuyers who are already stretching to afford a purchase. Rates for 30-year mortgages tumbled to a record low of 2.65% a little more than a year ago.
Cheap loans have helped fuel a housing rally that’s still running hot even as home prices soar out of reach for many Americans.
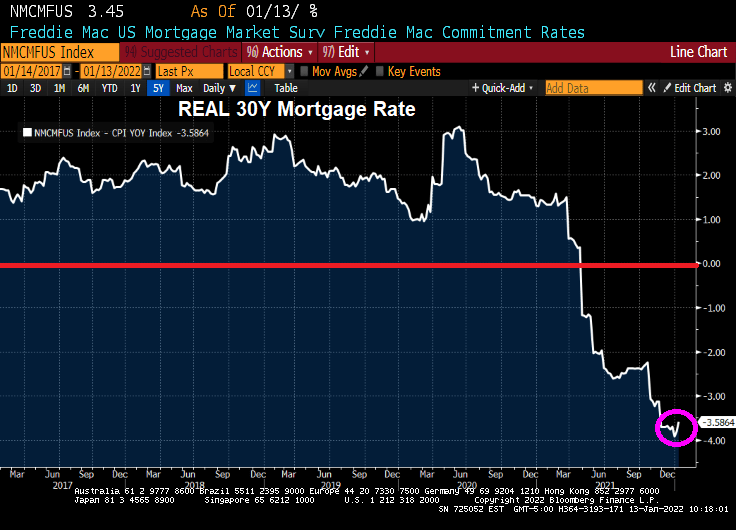
But wait! The REAL 30-year mortgage rate (nominal 30-year rate – CPI YoY) is -3.59%.
Lael Brainard, Biden’s nominee to be Vice Chairman of The Federal Reserve, has been one of the “inflation is transitory” crowd. US Senator Toomey is questioning Brainard in today’s hearing. From Toomey’s opening statement:
Last year, Governor Brainard repeatedly insisted that inflation was transitory. We have now had nine consecutive months where inflation has been more than two times the Fed’s 2% target. That makes it pretty clear that inflation is not transitory. Yesterday’s CPI release of 7.0%—the highest in 40 years—confirms that.
Inflation is a tax that is eroding Americans’ paychecks every day. Even though wages are growing, inflation is growing faster and causing workers to fall further and further behind.
At least the REAL mortgage rate is negative!
I hope Senator Toomey shows Brainard this chart of “transitory” negative wage growth.
Negative wage growth and negative REAL mortgage rates. What a total mess!





















You must be logged in to post a comment.