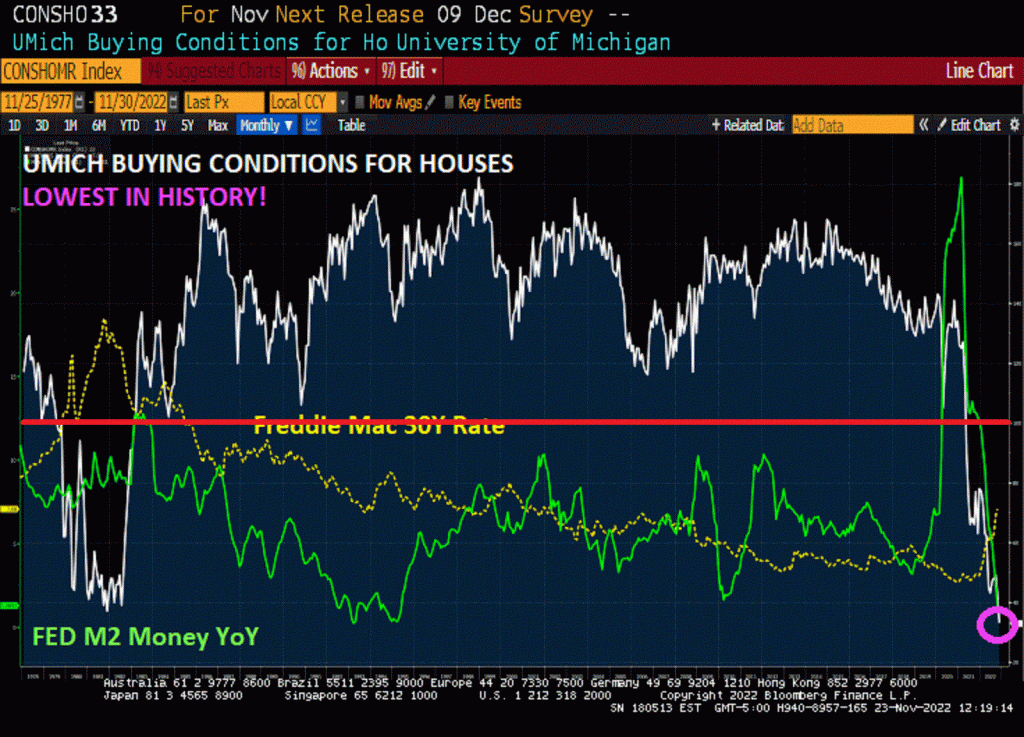
November’s consumer sentiment survey from University of Michigan is one for the books. It printed at 33.0, the lowest in the history of the survey that goes back to 1977.
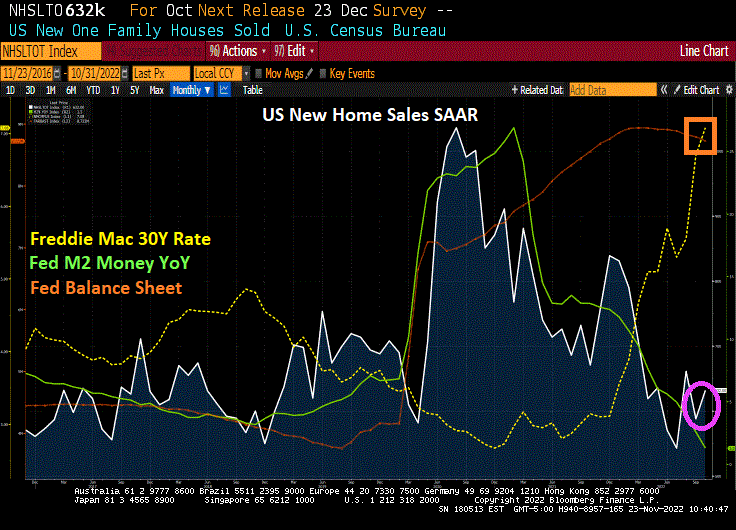
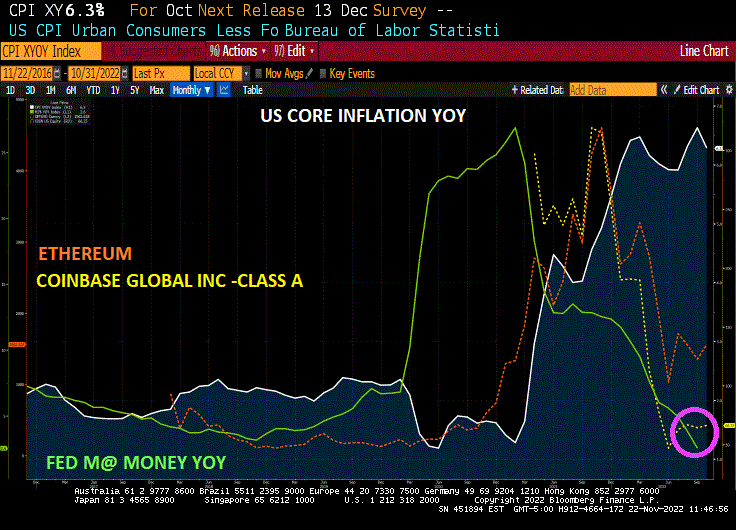
This chart shows how The Fed and Federal government threw trillions at the Covid economic shutdowns and the aftermath (green line).
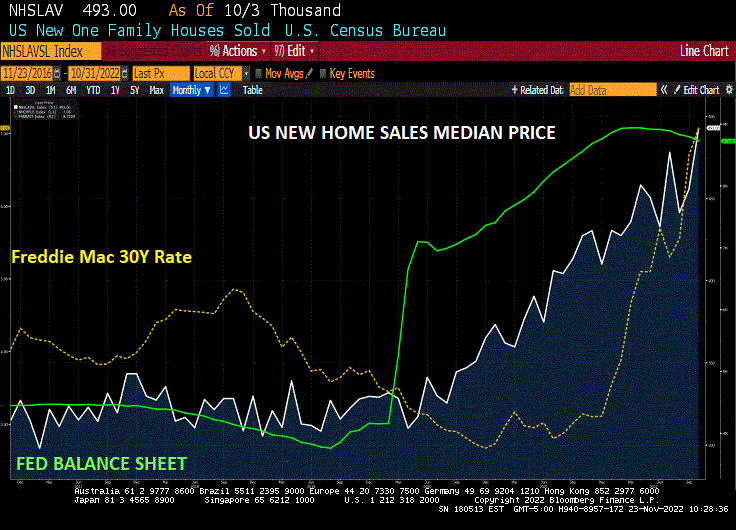
Not surprisingly, the median price of new home sales are up 8.2% MoM (since September).
The Fed’s minutes for their last FOMC meeting will be out at 2pm EST. Let’s see if they discuss WHY they haven’t reduced their balance sheet by much which is contributing to asset bubbles.
Here is The Fed’s Dots plot from the September meeting. I get the impression that The Fed thinks that their target rate will be coming down in 2024 and after.
The global economic slowdown has one nice unintended consequence: as the 10-year Treasury yield softens, mortgage rates decline.
US mortgage rates retreated sharply for a second week, hitting a two-month low and providing a bit of traction for the beleaguered housing market.
The contract rate on a 30-year fixed mortgage decreased 23 basis points to 6.67% in the week ended Nov. 18, according to Mortgage Bankers Association data released Wednesday.
Rates have plunged nearly a half percentage point in the past two weeks, the most since 2008, as recession concerns mount, inflation shows signs of cooling and a number of Federal Reserve officials say it may soon be appropriate to slow the pace of monetary tightening.
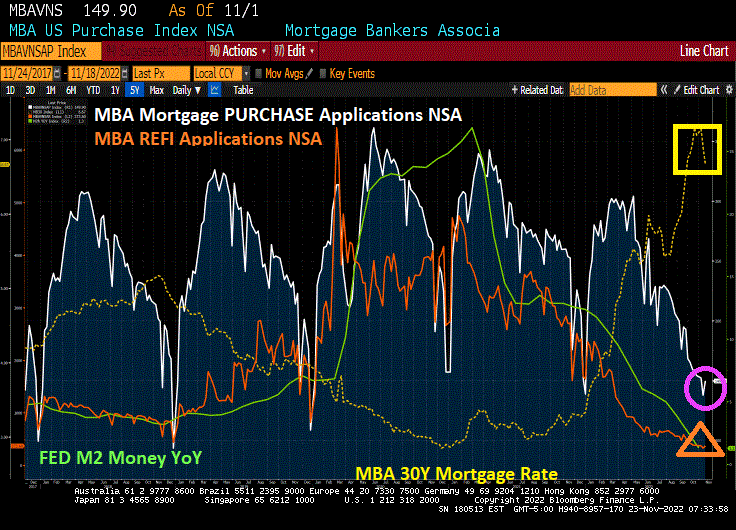
The slide in borrowing costs helped stir demand as the group’s index of applications to buy a home climbed 2.8%. That marked the third-straight increase since the gauge stumbled to the weakest level since 2015.
The pickup in demand allowed the overall measure of mortgage applications, which includes refinancing, to rise for a second week, but it still remains depressed. The index of refinancing activity edged up from a 22-year low.
The Refinance Index increased 2 percent from the previous week and was 86 percent lower than the same week one year ago.The unadjusted Purchase Index increased 9 percent compared with the previous week and was 41 percent lower than the same week one year ago.
But you need an electron microscope to see the increase in both purchase and refi apps.
One indicator of a slowing global economy is the decline of FANG (Facebook, Amazon, Netflix, Google) with declining liquidity.
The US economy is in “The Deep.” Deep into yield curve inversion, that is.
The US Treasury 10Y-2Y yield curve swam deeper into inversion at -75 basis points. The deepest inversion since just before The Great Recession and housing market crash.
During the Covid crisis of 2020 (red box). consumer credit declined and households were saving. But following the end of US Covid economic shutdowns, we saw inflation soaring to 40-year highs as Biden declared war on fossil fuels and a Pelsoi-led Congress went on an epic spending spree. But with soaring inflation, came a decline in personal savings and soaring consumer credit outstanding in an attempt to cope with Bidenflation.
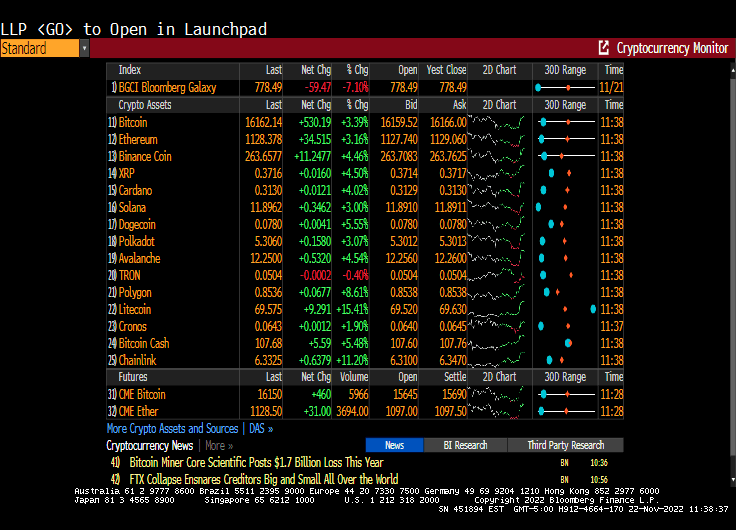
Meanwhile, in the crypto universe, CNBC’s Jim Cramer and ARK’s Cathie Wood are going big for cryptos. With Wood buying Bitcoin and Cramer touting Coinbase.
Hmmm.
But at least Litecoin and the others are up today. Likely because Cramer and Wood are touting cryptos with “buy the dip!” strategy.
And on the Sam Bankman-Fried fiasco front, I am watching the deflection of wrongdoing from SBF to his girlfriend and now the co-CEO of Alameda Research, Sam Trabucco.
Bloomberg: He has a degree from MIT and cut his teeth as a trader at Susquehanna International Group. Yet the former co-head of Alameda Research made it clear that poker and black-jack tables were where he honed the gambler’s instincts he applied to cryptocurrency trading.
“I may or may not be banned from 3 casinos for this,” Sam Trabucco once tweeted about counting cards at black jack tables.
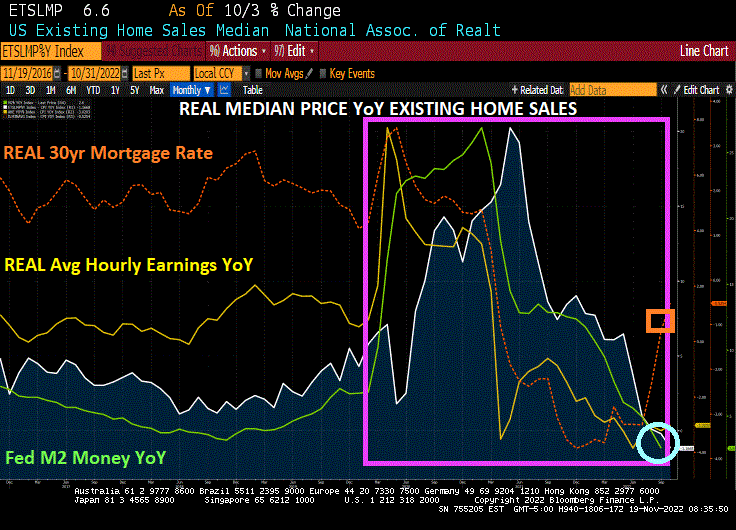
The US housing market is slowing, to be sure. Yesterday’s existing home sales (EHS) report revealed that US EHS were down -28.43% YoY and the median price of EHS slowed to 6.6% YoY.
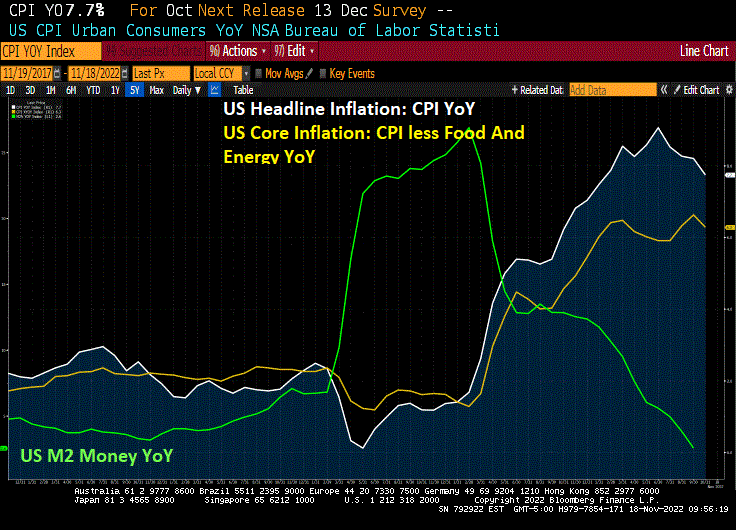
But that is just the surface of the EHS report for October. Once I removed inflation (CPI YoY) from the numbers, we are left with REAL median price of EHS growth of -1.17% and REAL average hourly earnings YoY of -3.0% YoY. The REAL 30-year mortgage rate is -5.25%. That reveals how horrible inflation is in the US.
It is important to note that EHS numbers are lower in October than they were before Covid stimulypto (my name for the massive spending spree by Congress and massive injection of monetary stimulus by The Fed. Even the REAL 30-year mortgage rate is negative at -0.5254%.
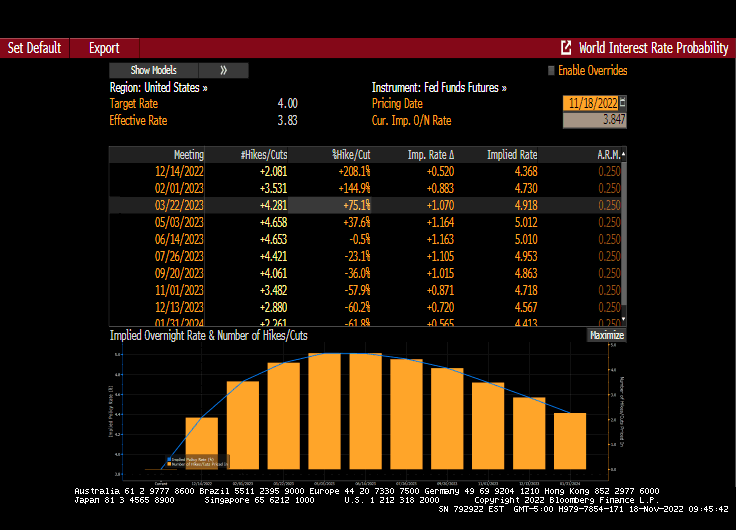
There is another Fed Open Market Committee (FOMC) meeting on December 14th and everyone is interested in what The Fed will do. Or how much will The Fed raises rates?
Recent inflation numbers are still terrible (for the US, that is). But slowing, giving Fed officials reason to slow down the pace of rate increases.
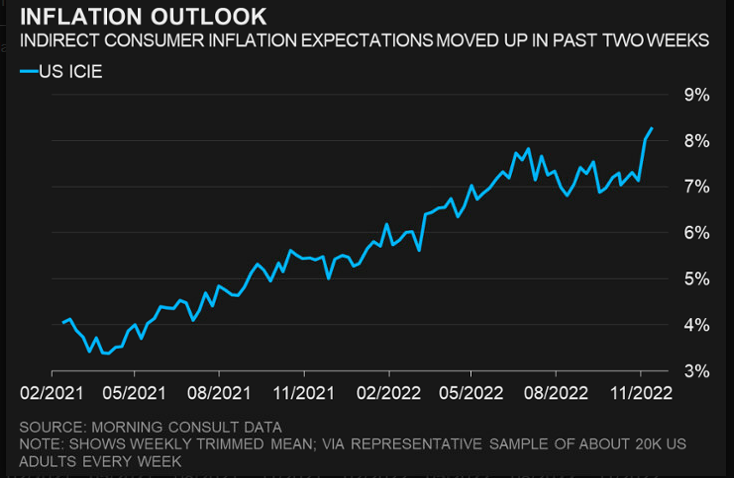
But now the Cleveland Fed has introduced a new inflation measure: Indirect Consumer Inflation Expectation index. And unfortunately it shows that consumers expectations for inflation is actually rising rapidly over the past two weeks to over 8%.
I have stopped listening to the various Fed Presidents (like Collins, Bostic and Bullard) babbling about what The Fed will do like so many bobbleheads in a car. I like Fed Funds Futures data. And it is showing a rate increase at the December 14th meeting of 52 basis points (that is, 50 basis points will some investors betting on 75 basis points).
So, consumers think inflation is hotter than the CPI data indicates.
As of today, the US Treasury 10yr-2yr yield curve is the most inverted since 1981 at -70 basis points.
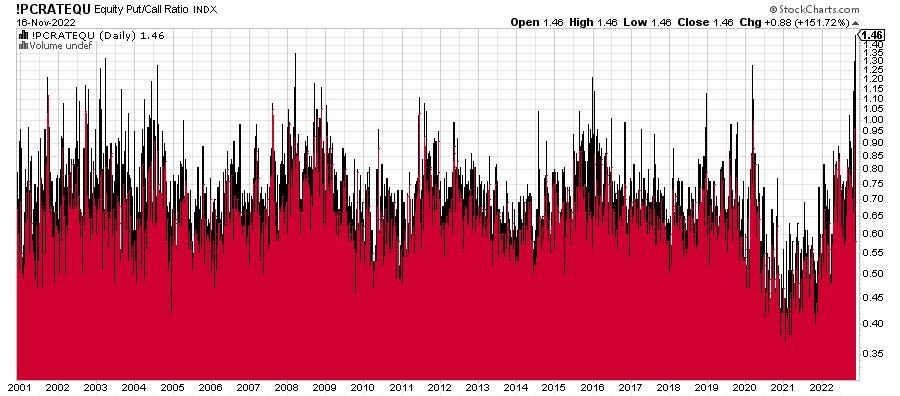
Meanwhile, equity put/call ratio from CBOE spiked yesterday to highest since 1997.
I am disappointed that The New York Times cancelled their $2,400 event to listen to Sam The Sham Bankman-Fried, Vlad “Show my your money!” Zelensky, Larry “The Big Fink” Fink and Janet “We never saw it coming” Yellen. I would have loved to do the New York Times job for them and ask hard questions to Sam The Sham and Zelensky about money laundering.
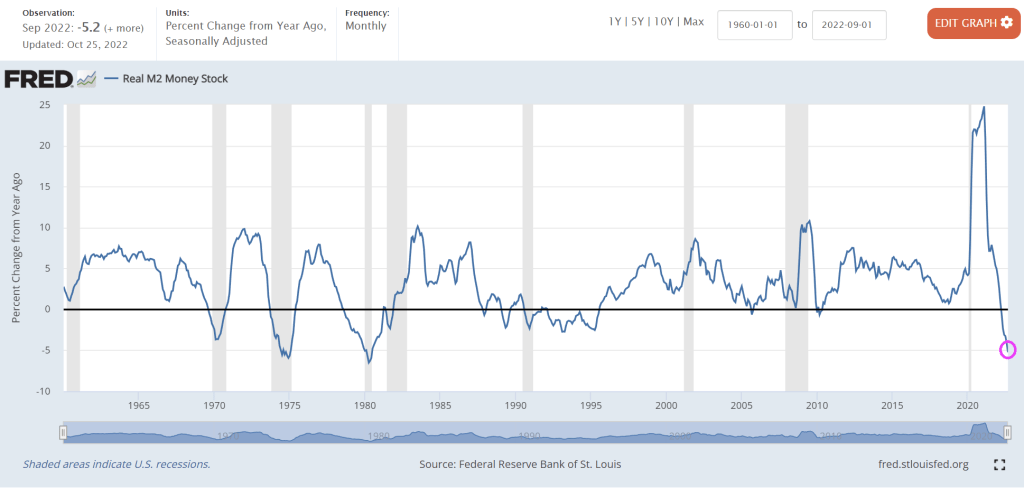
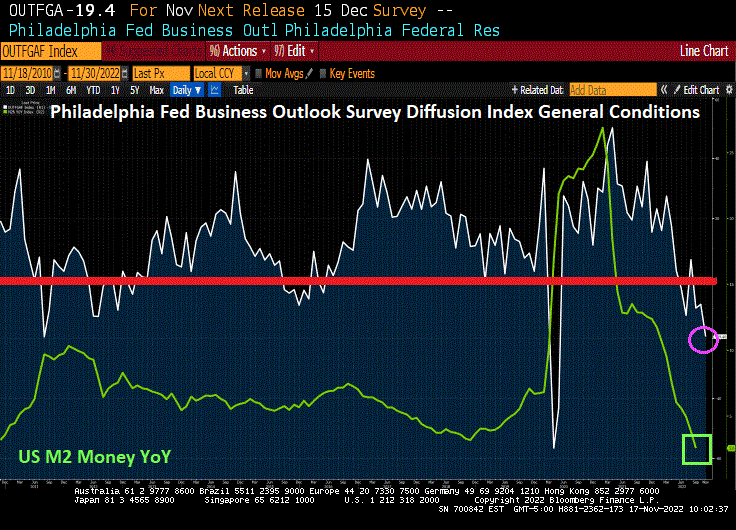
The Philadelphia Fed’s Business Outlook plunged to 1-9.40% YoY, the worst since 2012. Notice how the Philly Phed Plunge is related to M2 Money growth YoY.













You must be logged in to post a comment.