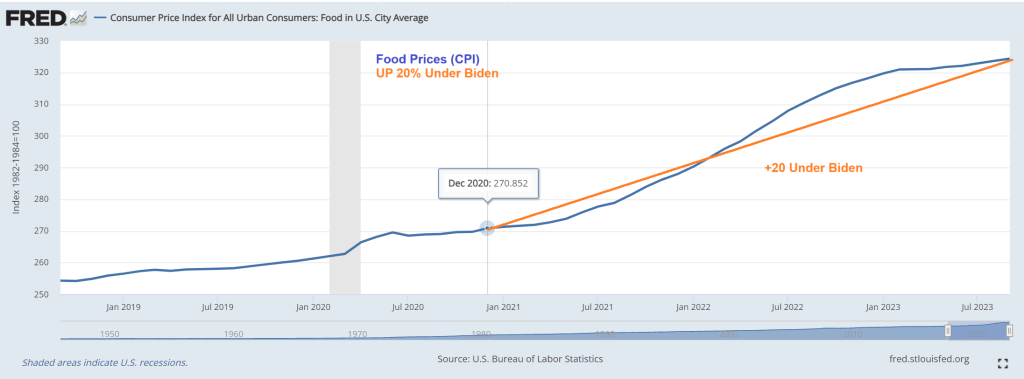
First, food prices are up 20% since December 2020. Talk about destruction of middle class wealth!
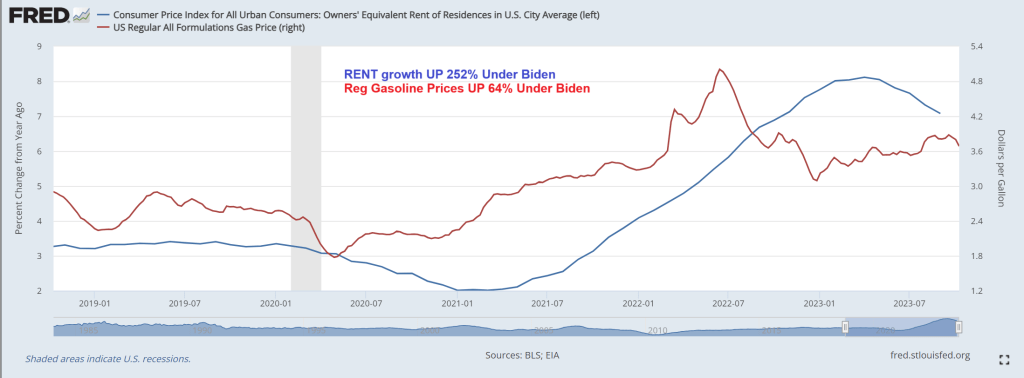
That is in addition to gasoline prices are up 64% under Biden while rent growth is up 252%. Well, Biden waived through millions of illegal immigrants and rent had to rise. Biden and Washington DC’s broken borders is Livin’ La Vida Loco.
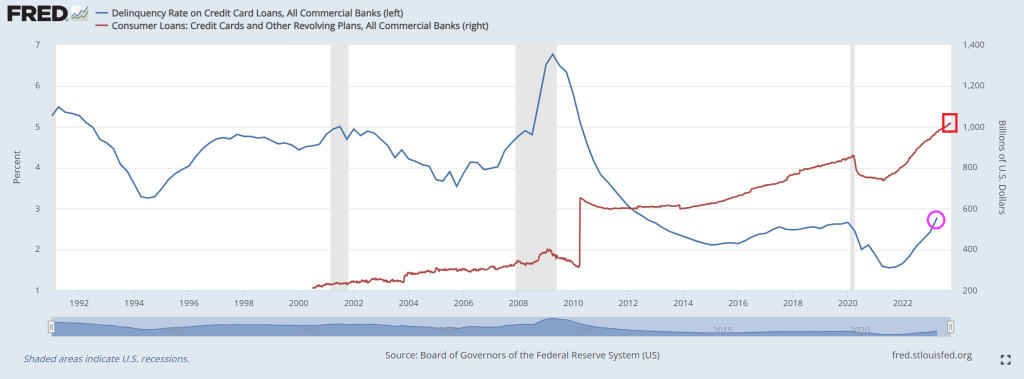
To cope with inflation (that Paul Krugman claims is over but the last inflation report showed that the tinders of inflation are hard to extinguish), consumers have turned to credit cards to survive. In fact, credit cards have expanded 38% since April 2021 despite rapidly rising interest rates. And credit card delinquency rates are rising and are now above Covid-era economic shutdown levels.
Now you know why the Mortgage Bankers Association, Home Builders and Realtors send a letter to Fed Chair Powell asking for rate hikes to cease. Mortgage rates are UP 165% under Biden.
But on to the demand side of mortgage finance.
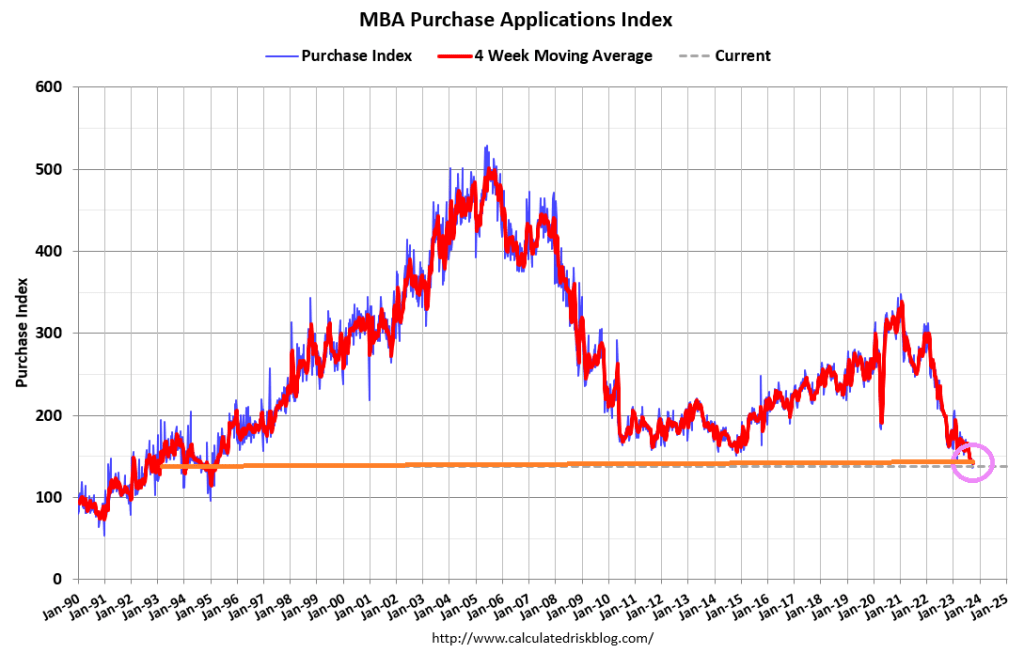
Mortgage applications increased 0.6 percent from one week earlier, according to data from the Mortgage Bankers Association’s (MBA) Weekly Mortgage Applications Survey for the week ending October 6, 2023.
The Market Composite Index, a measure of mortgage loan application volume, increased 0.6 percent on a seasonally adjusted basis from one week earlier. On an unadjusted basis, the Index increased 1 percent compared with the previous week. The Refinance Index increased 0.3 percent from the previous week and was 9 percent lower than the same week one year ago. The seasonally adjusted Purchase Index increased 1 percent from one week earlier. The unadjusted Purchase Index increased 1 percent compared with the previous week and was19 percent lower than the same week one year ago.
Joe Biden, who has always been a compulsive liar but at least sounded cognicent, is now babbling and whispering that Bidenomics works. But for who?
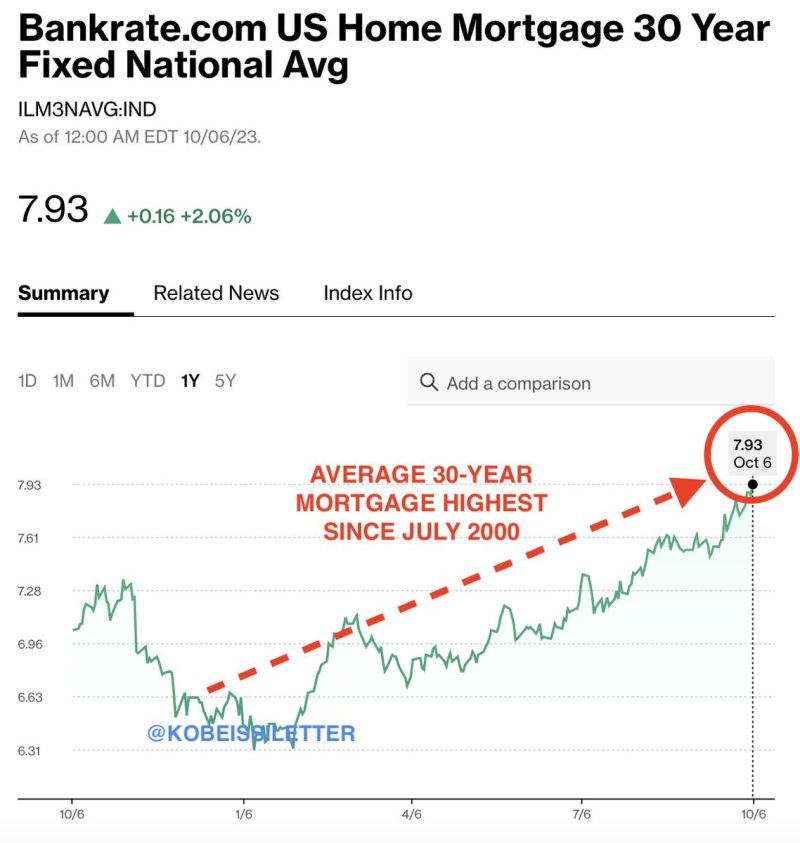
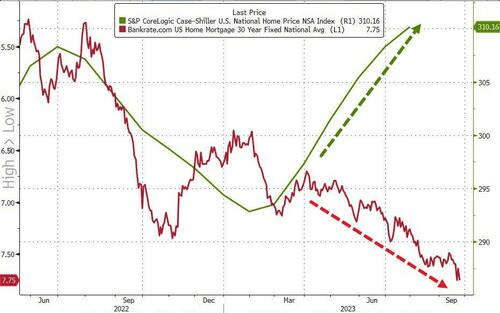
Clearly not for first time homebuyers or people looking to move. Bankrate’s 30-year mortgage rate is up to almost 8%, the highest since July 2000 and Willy Slick Clinton. That is a 176% increase in mortgage rates under the most inept “Economic Sheriff” in history.
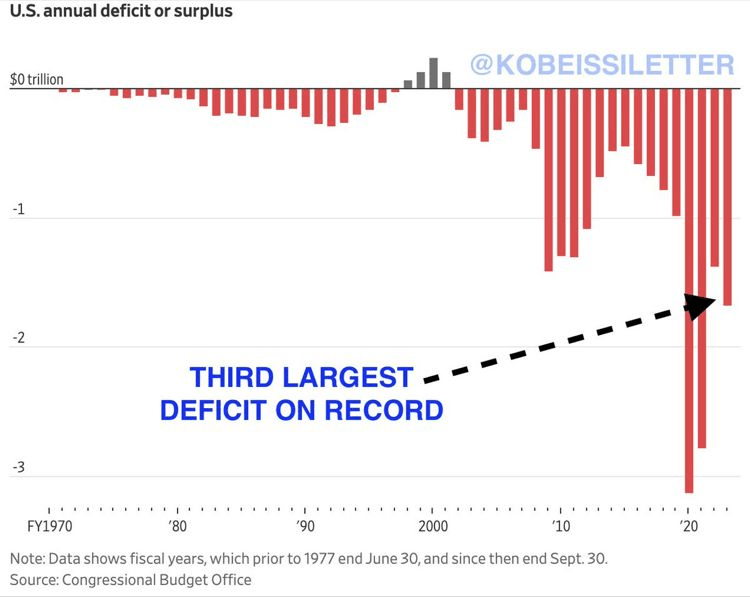
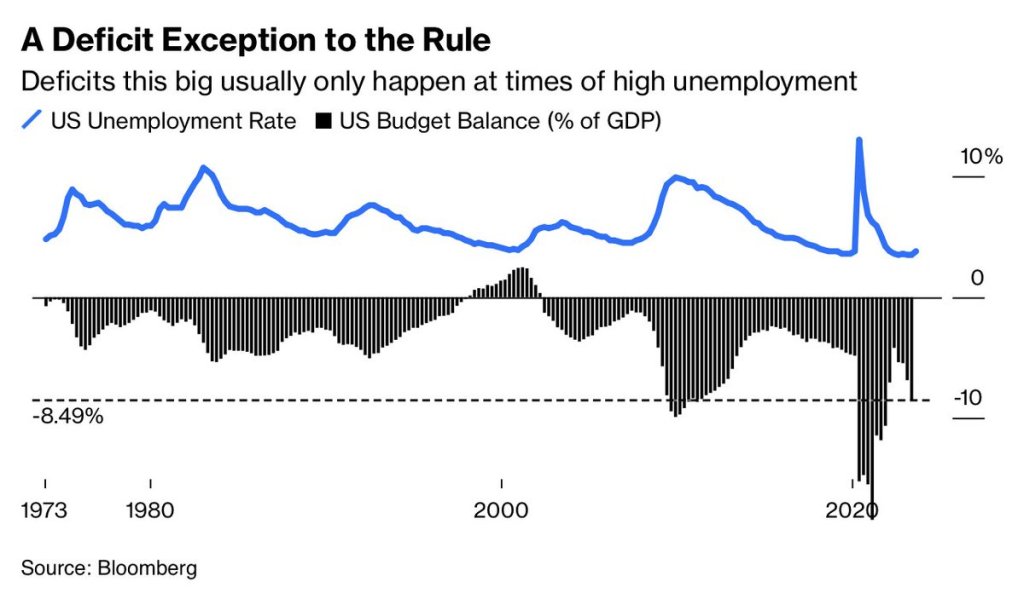
Deficits? Deficits (which Biden makes outlandish claims) are usually only this big at times of HIGH unemployment and recessions. So, are the staggering deficits under Biden a precursor to a hard landing (recession)? Don’t listen to what Biden or KJP say!!!
Biden’s outlandish claims that he single handedly reduced the deficit by the most in history is, well, typical Biden bloviating. Actually, tax receipts soared after Covid lockdowns ended. Period. Now that stimulus is wearing out, deficits are climbing again.
The Market Composite Index, a measure of mortgage loan application volume, decreased 6.0 percent on a seasonally adjusted basis from one week earlier. On an unadjusted basis, the Index decreased 6 percent compared with the previous week. The Refinance Index decreased 7 percent from the previous week and was 11 percent lower than the same week one year ago. The seasonally adjusted Purchase Index decreased 6 percent from one week earlier. The unadjusted Purchase Index decreased 6 percent compared with the previous week and was 22 percent lower than the same week one year ago.
The purchase market slowed to the lowest level of activity since 1995, as the rapid rise in rates pushed an increasing number of potential homebuyers out of the market. ARM loan applications picked up over the week and the ARM share increased to 8 percent, as some borrowers searched for ways to lower their payments.
The US 30-Year Mortgage Rate Tops 7.5% for First Time Since 2000.
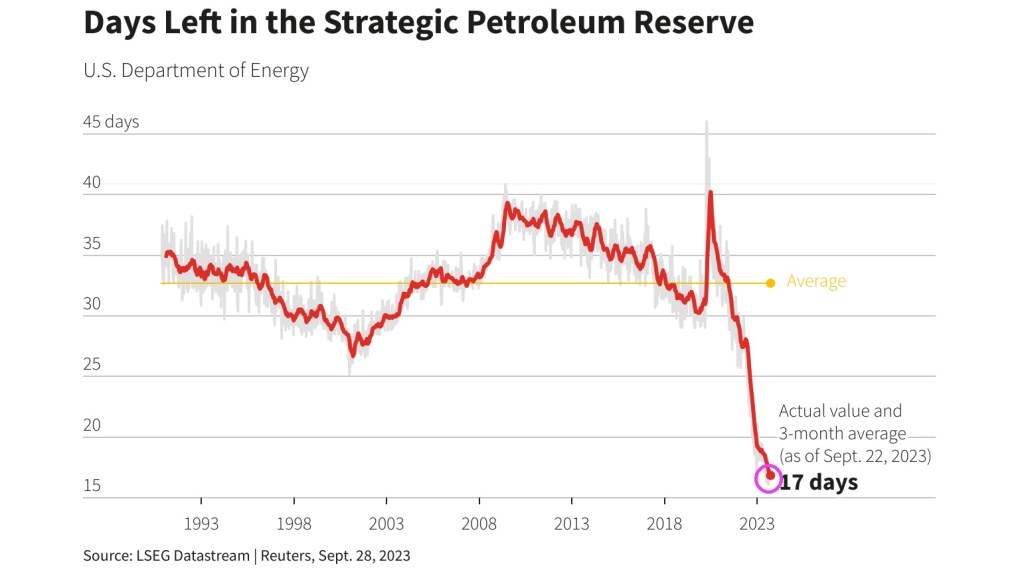
On the energy front, where we are represented by former Michigan governnor Jennifer Granholm and former South Bend Indiana mayor Pete Buttigieg, we see that the Strategic Petroleum Reserve is down to only 17 days left.
Fear the talking Fed! Various Fed Presidents are talking this week and when they do. WATCH OUT!
The latest fear mongering will be … inflation is persistent and they might have to keeep raising rates.
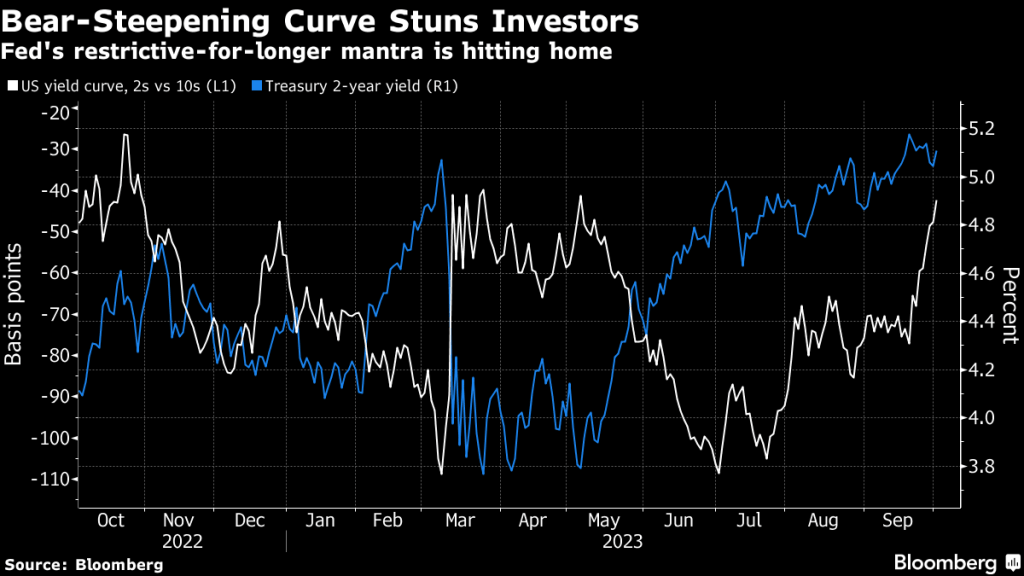
The two-year Treasury remains above 5% and the 10Y-2Y T-Curve remains inverted.
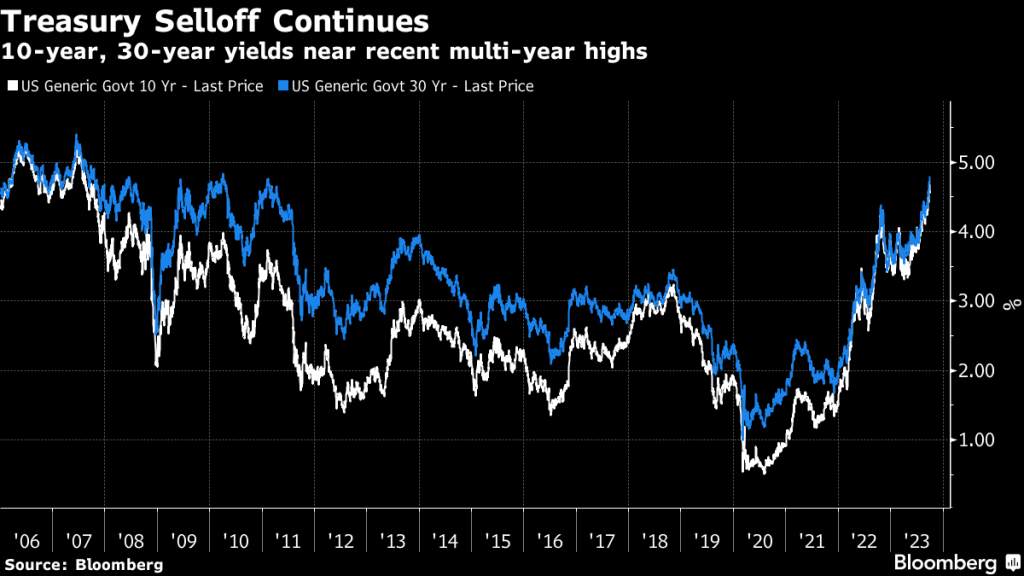
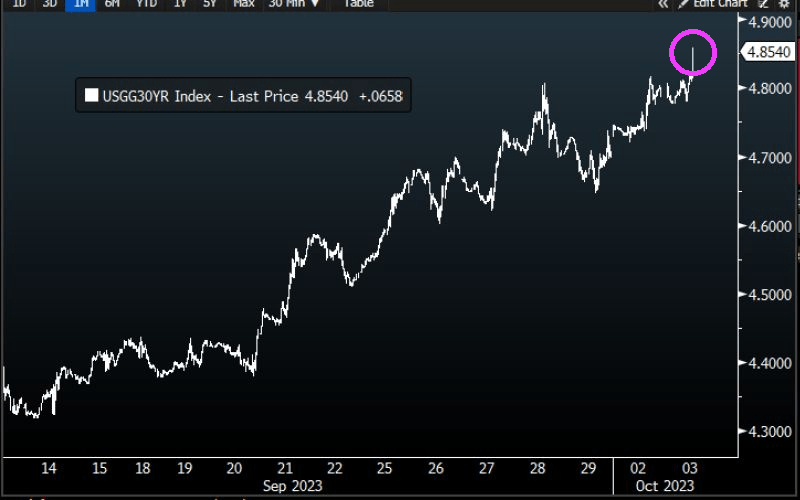
Treasury 30-year yield rose to 4.856%, HIGHEST SINCE 2007.
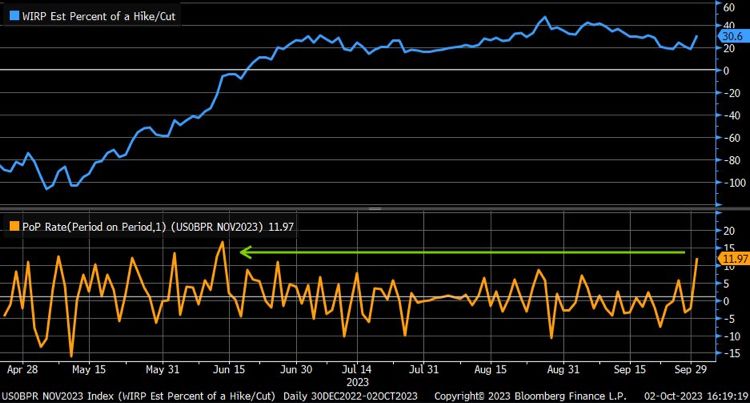
The likelhood of another Fed rate hike is growing.
While inflation is cooling (but still elevated), The Fed could choose to rate hikes again.
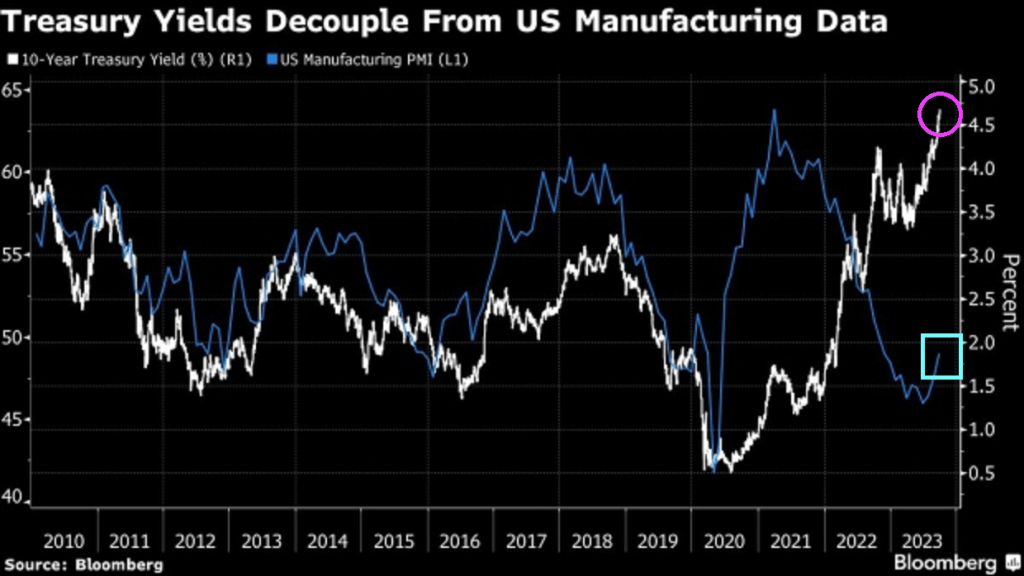
Treaury yields have decoupled from US manufacturing data.
Best picture of Lael Brainard, Director of the National Economic Council of the United States and former Federal Reserve member and talking head. Or screaming head.
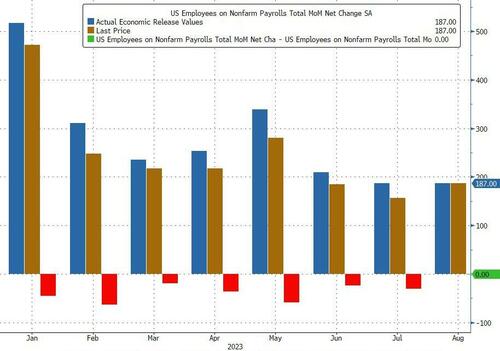
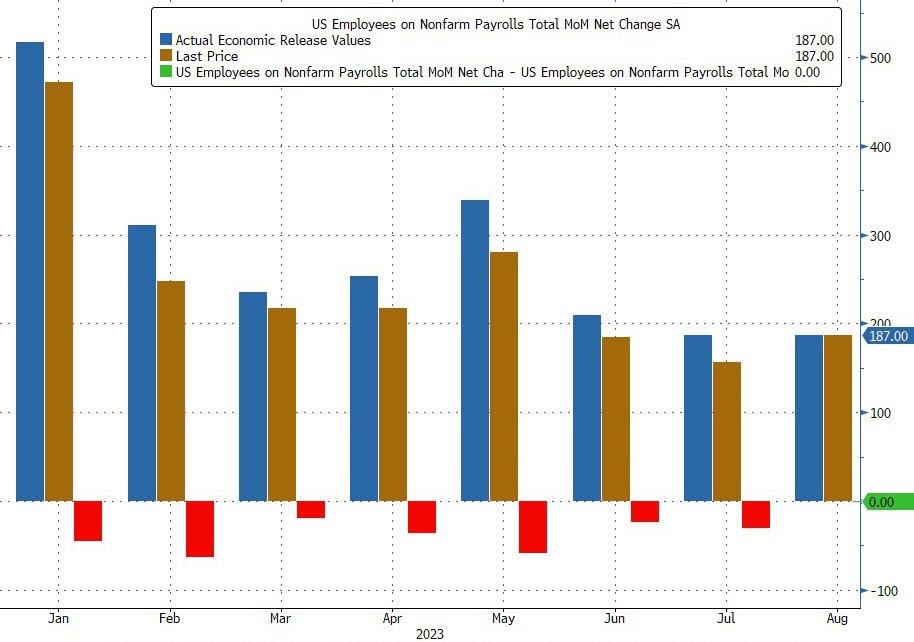
That has certainly been the case with US labor data, where as we first reported last month, every single monthly payrolls print in 2023 has been revised lower (see chart below), a 12-sigma probability and virtually impossible unless there was political pressure to massage the data higher initially and then revise it lower when nobody is looking.
But the BLS is not done: as we reported last week, besides the now traditional one-month lookback revisions the ridiculously high monthly payrolls prints accumulated over the past year will also be slowly but surely revised gradually lower at annual benchmark revisions for years to come. As Morgan Stanley chief US economist Ellen Zentner explained (full note available to pro subscribers)…
Payrolls get revised too, and we expect a downward revision. Payrolls have an annual benchmark revision that is published in February each year. The revision adjusts the level of payrolls through March of the prior year. For example, a new revision will be published in Feb-24, adjusting payroll levels from April-22 to Mar-23. And a preliminary estimation of the upcoming revision points to a decrease in payroll YoY% growth rates of -0.2pp.
But while downward payroll revisions under Bidenomics are as certain as death and taxes, what we wanted to discuss here are the just as striking downward revisions to US consumption which hit this morning alongside the comprehensive once every-five-years historical revisions to GDP. As a reminder:
Today’s release presents results from the comprehensive update of the National Economic Accounts (NEAs), which include the National Income and Product Accounts (NIPAs) and the Industry Economic Accounts (IEAs). The update includes revised statistics for GDP, GDP by industry, GDI, and their major components. Current-dollar measures of GDP and related components are revised from the first quarter of 2013 through the first quarter of 2023. GDI and selected income components are revised from the first quarter of 1979 through the first quarter of 2023.
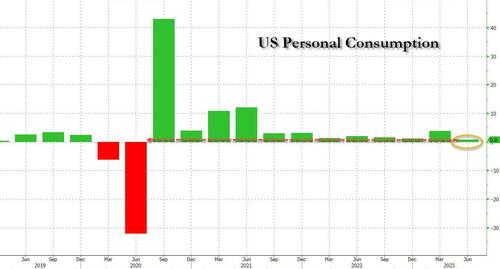
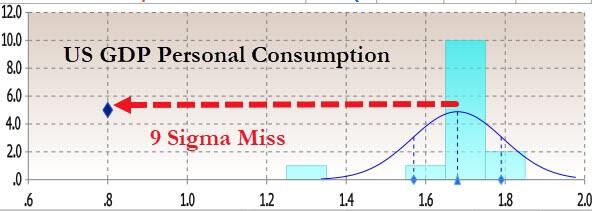
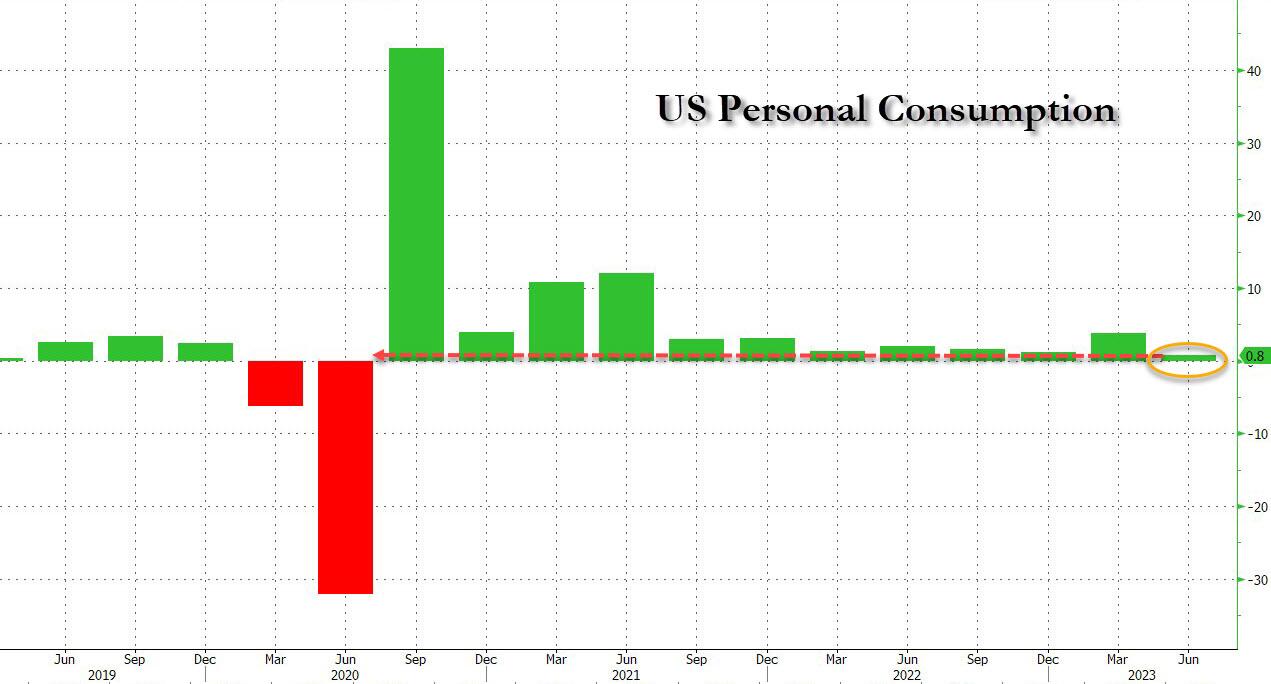
Earlier today we already noted the disaster that was Q2 Personal Consumption: instead of the 1.7% unchanged print from the second estimate of Q2 GDP, the final number was a dire 0.8%, a 9-sigma miss to estimates…
… and the worst quarterly increase since the Covid collapse in Q2 2020.
But what about other historical data? After all today’s revision impacted all data from Q1 2013? Therein, as the bard says, lies the rub.
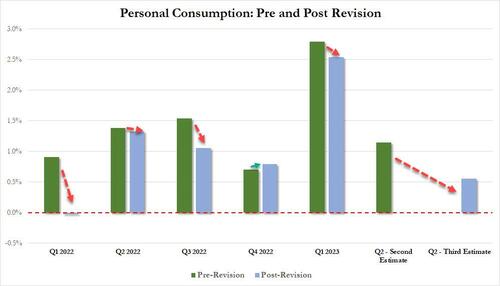
Let’s start with personal consumption, and compare the latest post-revision current data (link) with the most comprehensive pre-revision data as of last month (link). It should come as no surprise to anyone that with the (slight) exception of just Q4 2022, personal consumption in every single quarter since the start of 2022 – when the Fed aggressively started tightening and hiked rates by the most since Volcker – has been revised lower, and in some cases dramatically so.
Bloomberg also picks up on the GDP revision and looking at revisions to the historical data, writes that “the pandemic contraction is seen as being a bit less severe than previously thought: GDP is now reckoned to have dropped at a 28% annual clip in the second quarter of 2020, instead by 29.9%, as the government shut down swathes of the economy to fight the spread of the virus. But the recovery since then has been somewhat slower, according to the update. Growth last year was revised to 1.9% from 2.1%.” And of all GDP components, consumption was the weakest.
So not only was the Fed hiking at a time when personal consumption would grow much less period to period than previously expected, but the US economy was generally weaker than previously expected (as discussed here).
There’s more.
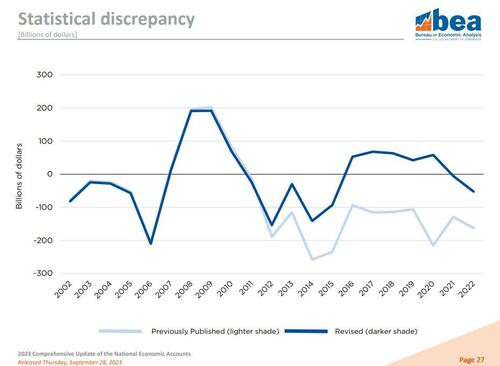
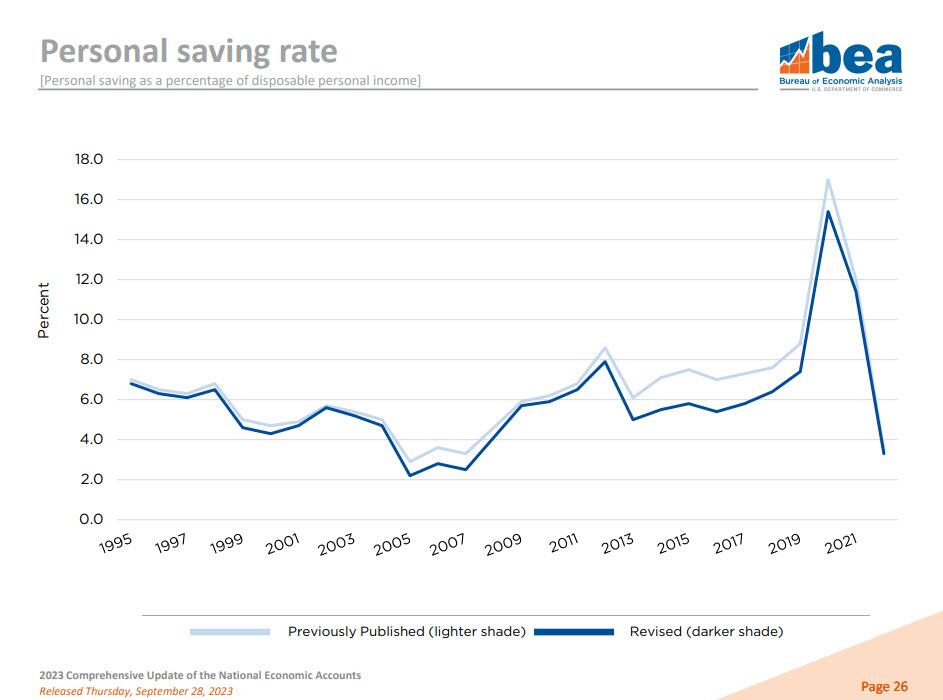
When looking at the composition of the US household’s income statement – the summary of economic accounts – we find just what we had expected: US savings were in fact far lower than previously expected.
… and indeed as the BEA chart below shows, Americans stashed away an average 8.3% of their disposable income annually from 2017 through 2022, down from a previously estimated 9.4%.
The reduction stems from an accounting adjustment that lowered personal income from mutual funds and real estate investment trusts. Additionally, as Bloomberg notes, much of the reduction in personal savings seen in the revised data occurred prior to the pandemic, so its implications for how much extra cash Americans may feel they still have now is not clear cut.
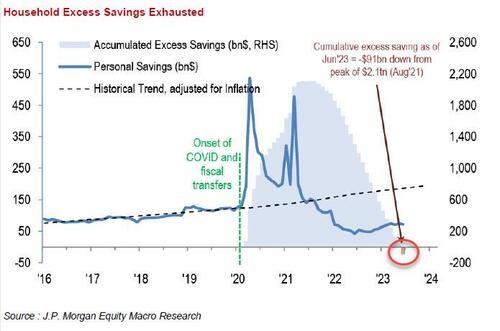
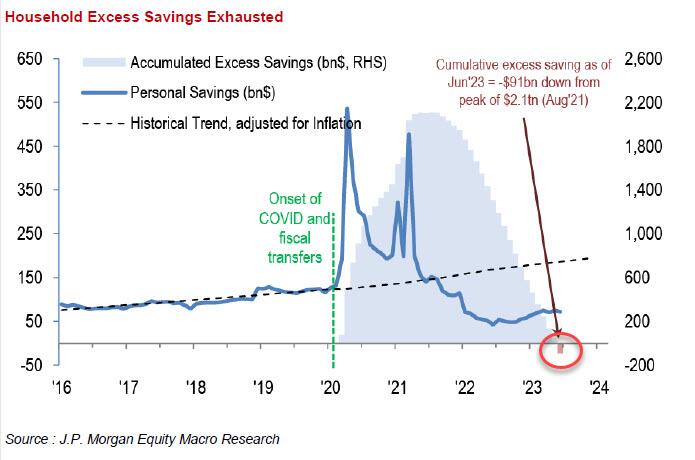
Whatever the reason for the statistical adjustment, however, one can say goodbye to even the faintest speculation that US households have any excess savings left… why they don’t, of course, because even when using the previous methodology which artificially inflated total savings, JPM calculated that excess savings had already run out…
… which means that if Q3 GDP was bad and consumption was “revised” sharply lower (odd how economic data is never revised higher under Joe BIden), Q4 – when savings are virtually non-existant – and where we also get the i) return of student loan payments; ii) the UAW strike; iii) the government shutdown and iv) oil at almost $100 and gasoline at one year highs, is about to fall off a cliff.
Yes, Bidenomics is a form of Brawdo, the economic mutilator!
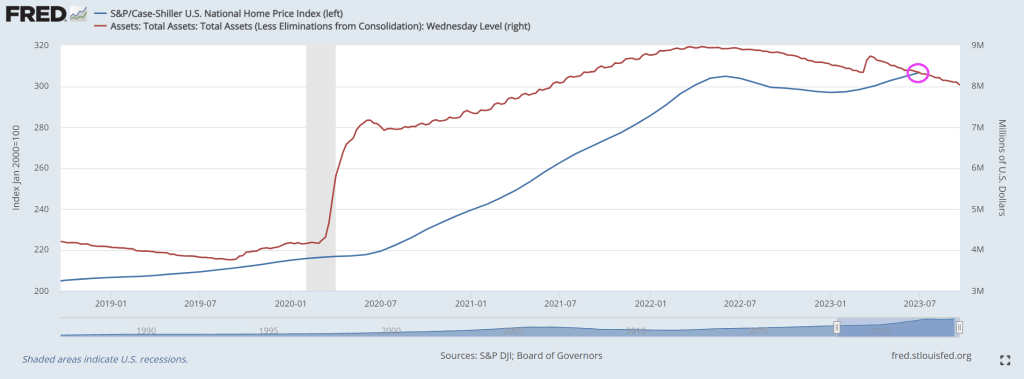
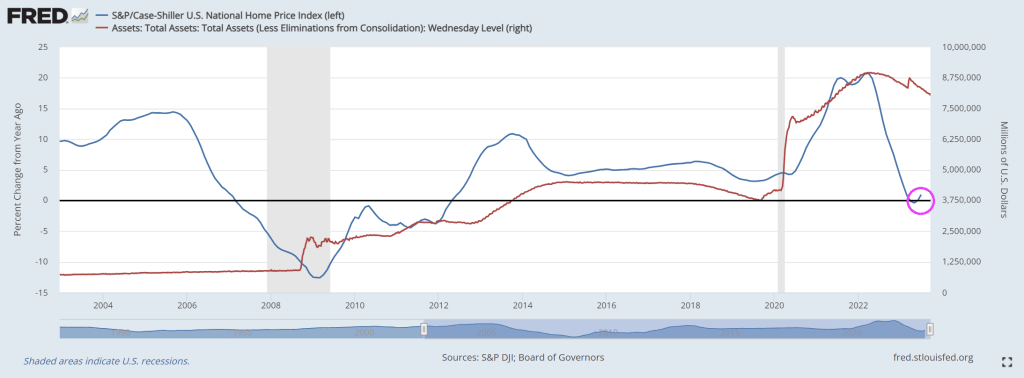
Thanks to rampant Federal spending and overstimulus by The Federal Reserve, US housing prices are simply unaffordable for many. Particularly since the Covid epidemic (Wuhan China Flu).
Yes, home prices grew in July despite rising mortgage rates. As CS Lewis wrote “That Hideous Strength” but this is about how The Fed doesn’t understand what they have done.
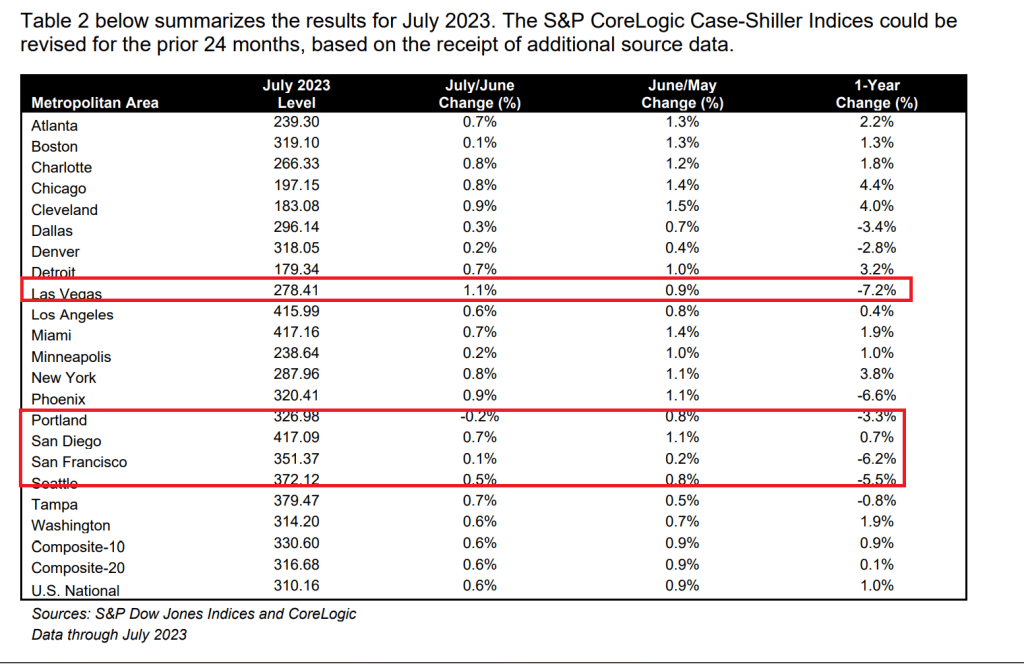
At the metro level, Las Vegas leads in YoY price declines at -7.2%. In a close second is San Francisco at -6.2%. Portland and Seattle also declined.
Here is Screamin’ Joe Biden. You know Biden is lying when he gets angry.
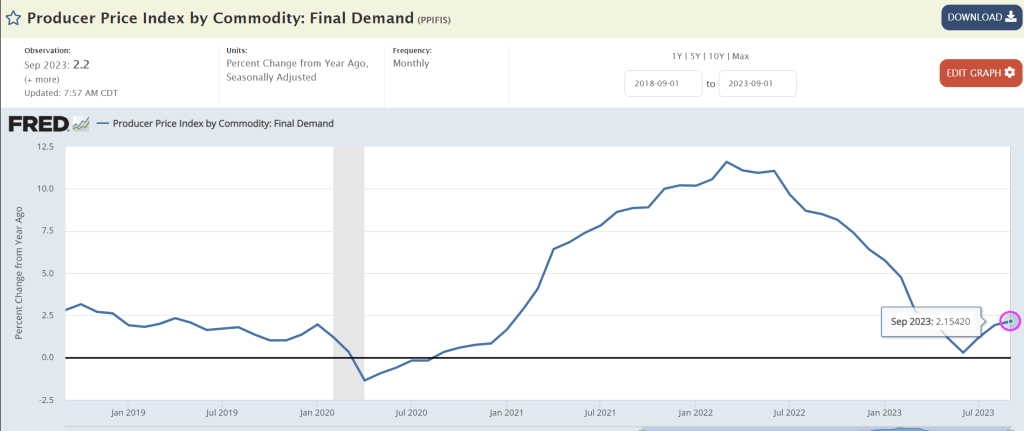
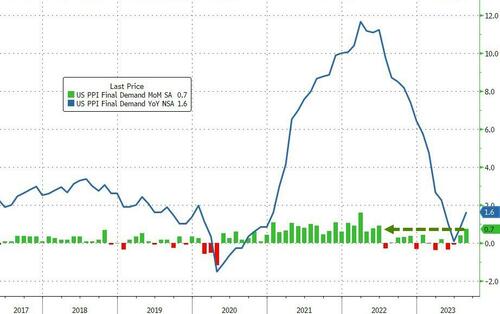
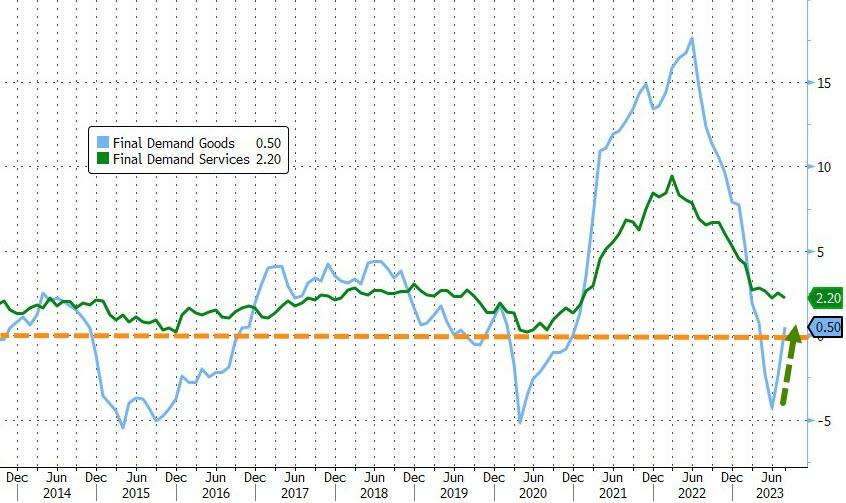
Producer Prices rose 0.7% MoM in August (up from +0.3% in July and hotter than the +0.4% exp). That is the hottest PPI since June 2022, and pushed YoY prices up 1.6%…
Source: Bloomberg
Goods prices are reaccelerating fast, now back into inflation YoY (as Services cost growth slowed only modestly)…
Source: Bloomberg
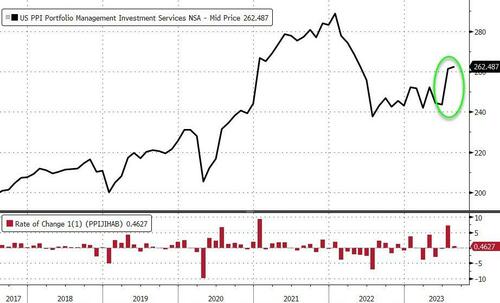
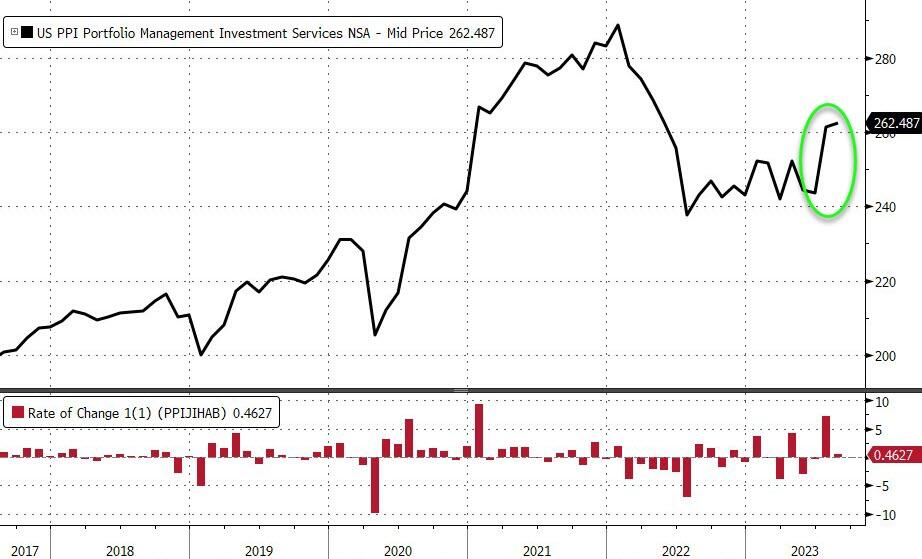
As a reminder, much of last month’s PPI rise was driven by a big jump in portfolio management costs – as stocks soared. August saw a further rise in those costs…
Source: Bloomberg
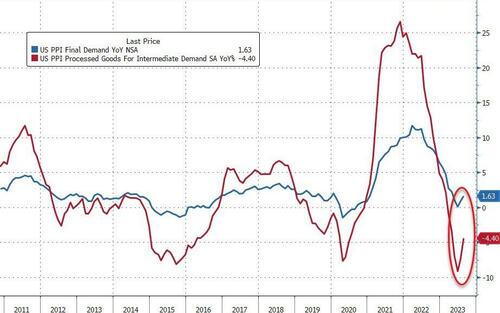
More problematically, the pipeline for PPI appears to have inflected as intermediate demand is re-accelerating…
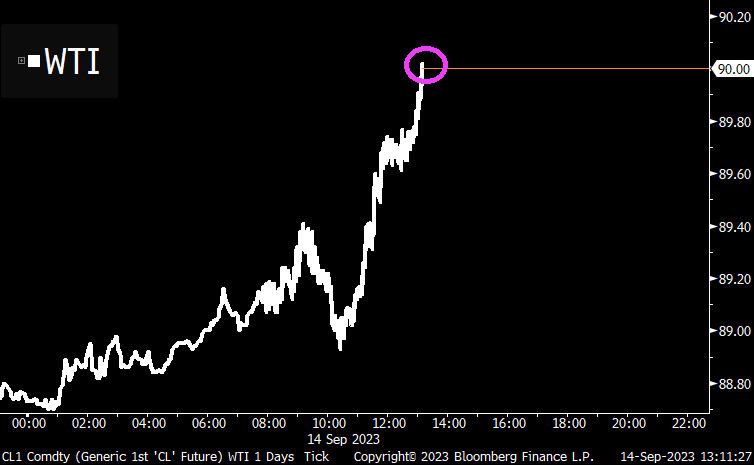
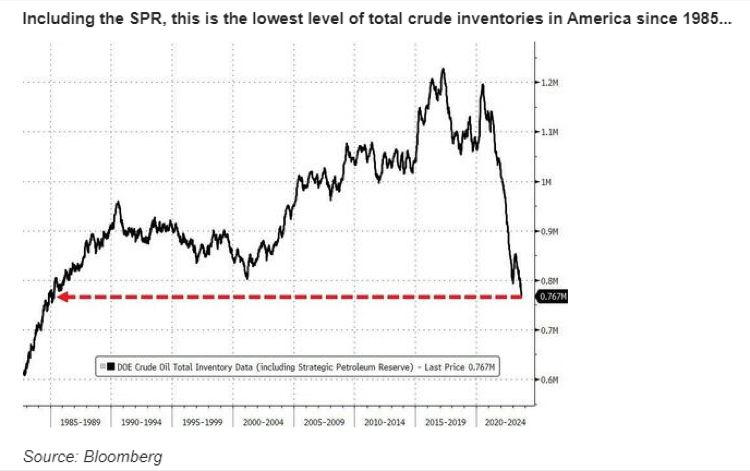
Its hard to watch Biden and The Progressive Greens destroy the enegy security of this great nation. Biden is draining the Strategic Petroleum Reserve, probably in a misguided attempt at ensuring we never go back to abundent petroleum again. Crude oil inventories are now the lowest since 1985.
Household spending has kept the US economy afloat, but as growth slows a continued rise in oil and gas prices is poised to push personal consumption expenditure (PCE) lower and thus trigger a near-term recession – with stocks and bonds unpriced for such an outcome.
Once again it has been the redoubtable consumer that has thus far kept a recession at bay. However, Bloomberg Economics (BBE) pointed out in a recent article that negative household sentiment – in confluence with other drivers of household spending – suggests that we should already be in a recession.
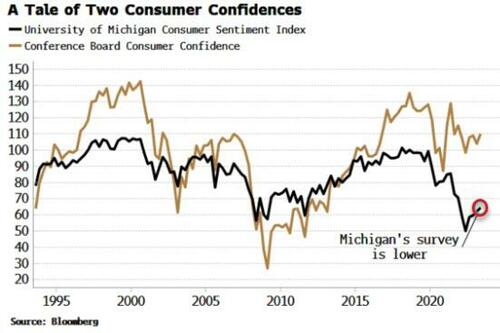
A regression model (using income, wealth and real rates) pins PCE growth roughly where it is. But if we add in the University of Michigan’s Consumer Sentiment index, it indicates much weaker PCE growth and thus an economy that would likely be already be in the midst of a slump.
I recreated BBE’s model and got something similar. I then substituted in the Conference Board’s Consumer Index instead of the Michigan survey. This also improves the fit of the original model, but does not paint as negative a picture for PCE. The reason is that the Conference Board’s measure has not deteriorated as much as the Michigan survey.
Why? The divergence between the two likely comes from the Michigan’s greater emphasis on frequent expenditures and business conditions, while the Conference Board’s index is more focused on the jobs market. As an employee, the jobs market has looked pretty good, boosting the Conference Board’s index, while the Michigan survey is more influenced by rising prices and conditions for small-business holders, which have been less rosy.
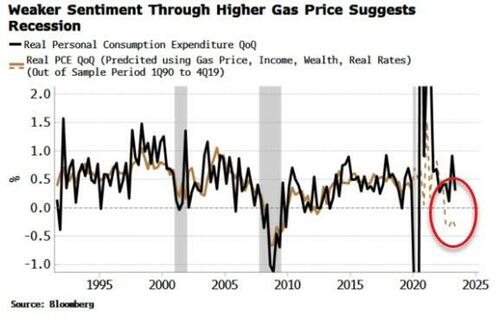
The Michigan survey is in fact very sensitive to gas prices. In the model, I added the average gas price to the model’s original inputs (i.e. ex Michigan). Doing so also improves the model’s fit, and as the chart below shows, implies notably weaker, and negative, PCE growth – and therefore an economy that would likely already be in a recession.
This highlights that the US economy is potentially on thin ice, with that ice represented by hitherto positive consumer sentiment, driven in no small part by gas prices (and sentiment on how high they are perceived to be) that remain comparatively cheap to the levels they reached last year.
But oil has been rising, driven by excess liquidity, falling inventories and supply cuts.
Tailwinds remain for oil, and therefore the nascent recent rise in gas prices is poised to continue as well. That could be the final straw which unseats the US consumer and tips the US into a recession.
The US warhawks seemed focused on Ukraine’s security, but don’t seem to care about US energy security or the personal welfare associated with open borders. Just ask Mayor Adams of New York City.


You must be logged in to post a comment.