Simply Unaffordable! Homebuyers Must Earn $115,000 to Afford the Typical U.S. Home, UP 30% Under Biden (About $40,000 More Than the Typical American Household Earns) Mortgage Market Is Addicted To Gov!

Housing in the US is simply unaffordable!

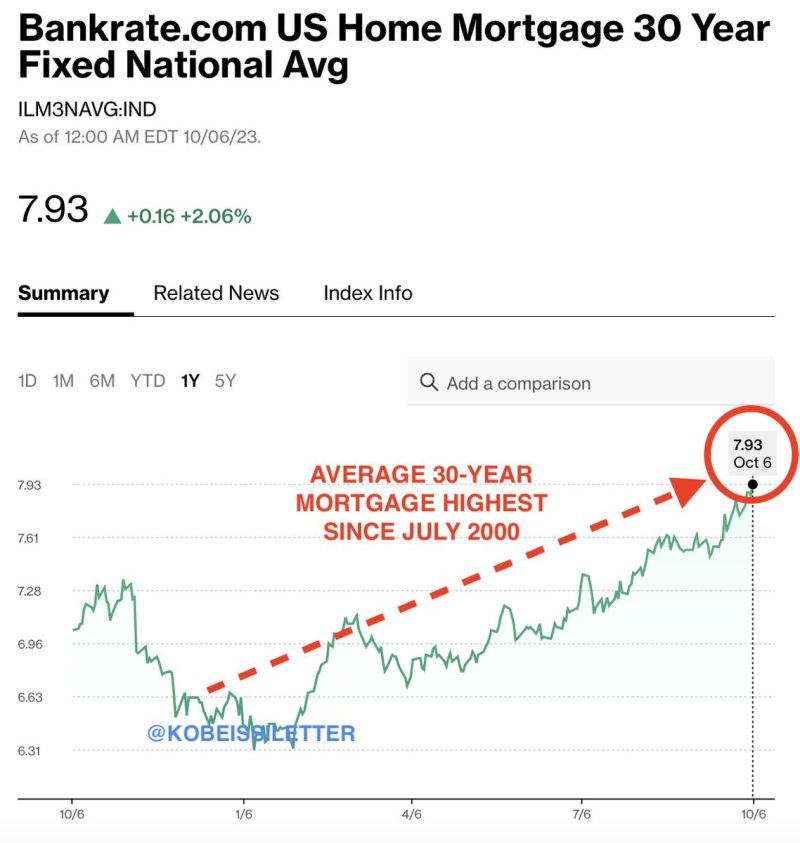
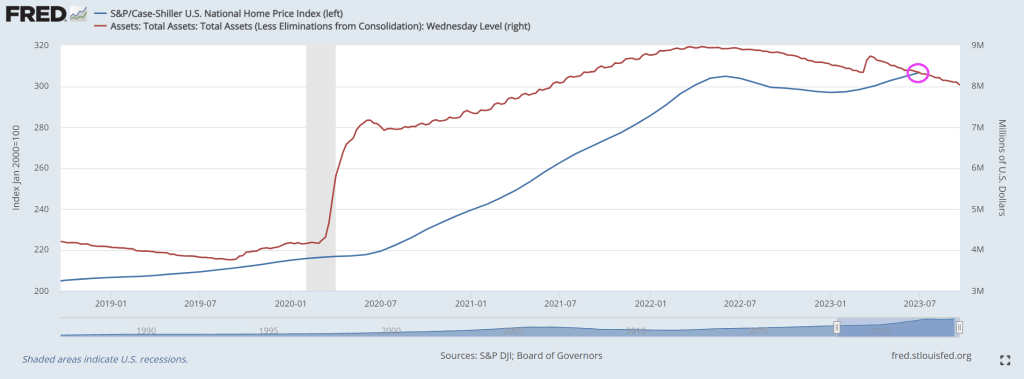
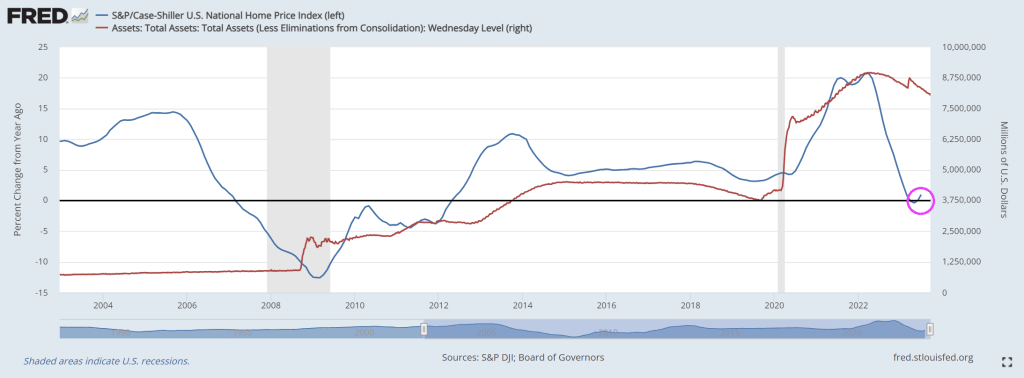
Under Bidenomics, home prices are up 30% while real weekly earnings growth has been negative for most of Biden’s Presidency. And mortgage rates are up 178% under Bidenomics.

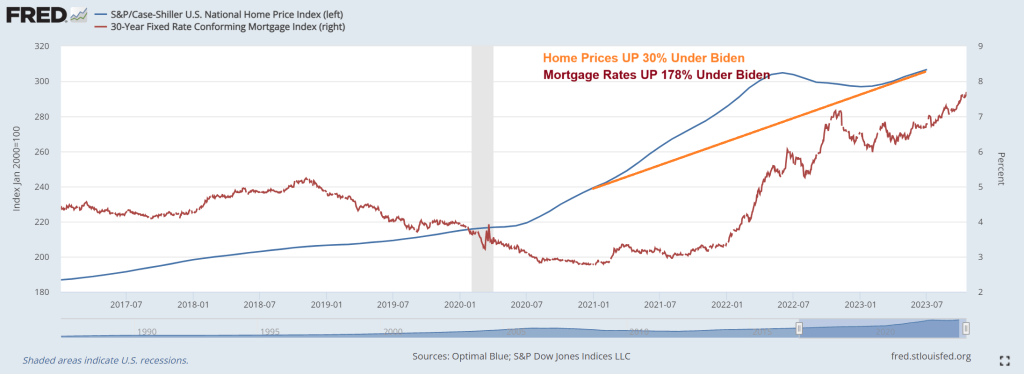
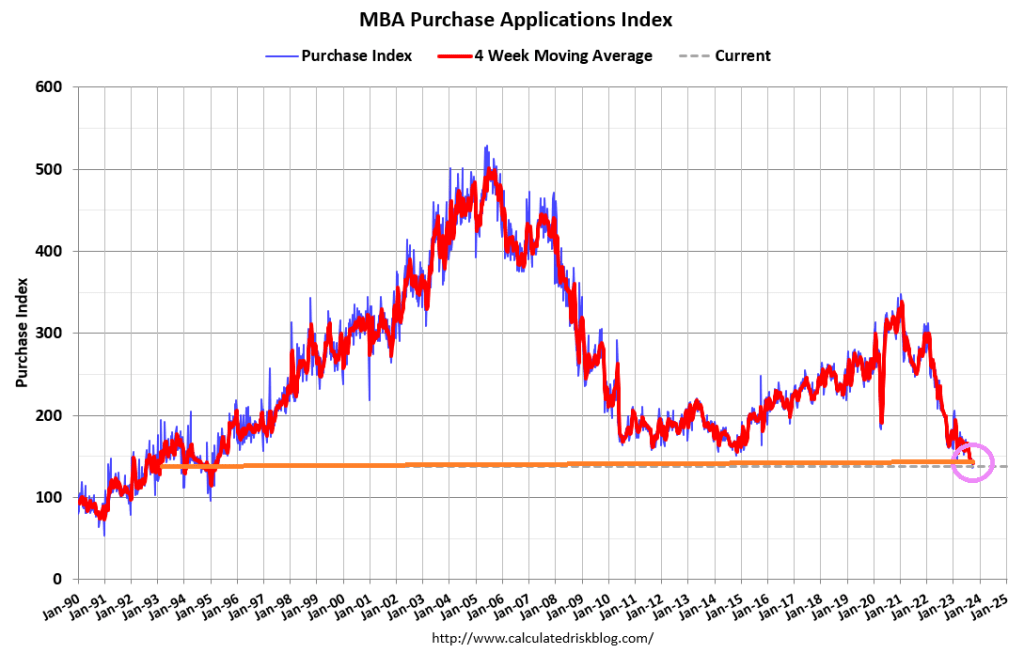
Sky-high mortgage rates and still-rising home prices have made it harder than ever to afford a home, especially for first-time buyers. The typical buyer needs to earn 15% more than they did a year ago–and wages are only up 5%.

It’s harder than ever for Americans to afford a home. 

A homebuyer must earn $114,627 to afford the median-priced U.S. home, up 15% ($15,285) from a year ago and up more than 50% since the start of the pandemic. That’s the highest annual income necessary to afford a home on record. 

This is based on a Redfin analysis that compares median monthly mortgage payments for homebuyers in August 2023 and August 2022. The income data in this analysis is adjusted for inflation. See the bottom of this report for more on methodology. 

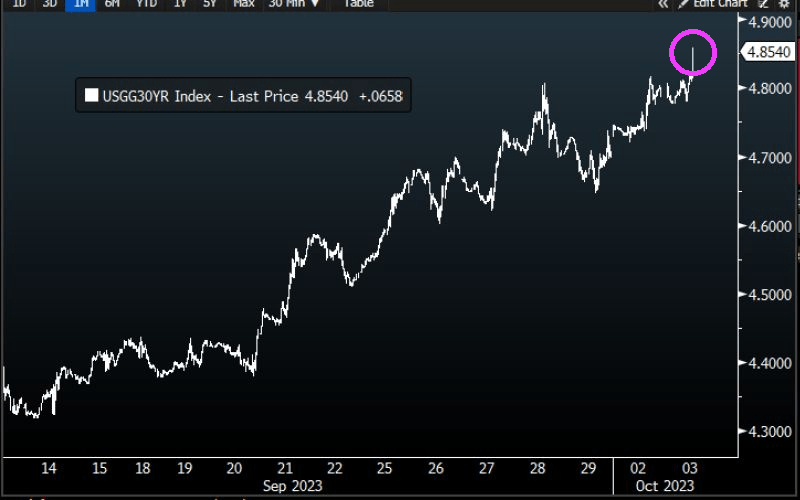
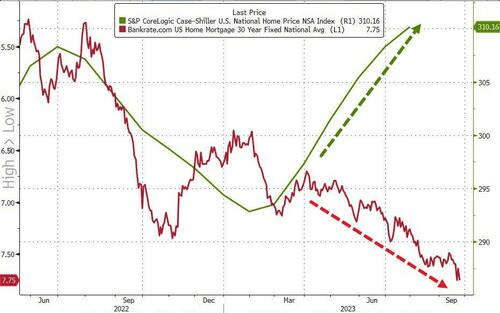
Housing costs are higher than ever because of the one-two punch of sky-high mortgage rates and rising home prices. The average rate on a 30-year fixed mortgage was 7.07% in August. Mortgage rates have climbed even higher since then, hitting 7.57% during the week ending October 12–their highest level in over two decades. But even though soaring mortgage rates have dampened demand, low inventory is causing home prices to increase. The typical U.S. home sold for about $420,000 in August, up 3% year over year and just about $12,000 shy of the all-time high hit in mid-2022. 

The typical U.S. homebuyer’s monthly mortgage payment is $2,866, an all-time high. That’s up 20% from $2,395 a year earlier, and by that time payments had already increased substantially from the beginning of the pandemic, a time of ultra-low mortgage rates and yet-to-skyrocket home prices. In August 2020, for instance, the typical monthly payment was $1,581, based on that month’s average mortgage rate of 2.94% and median home price of $329,000. At that time, a homebuyer would have needed to earn $75,000 per year to afford the typical home. 

The typical American household earns about $40,000 less than the income needed to buy a median-priced home. The median household income was roughly $75,000 in 2022, the most recent year for which annual income data is available. Hourly wages have risen in 2023, but not nearly as fast as the income necessary to afford a home is rising: The average U.S. hourly wage has increased by about 5% over the last year. 

“In a homebuyer’s ideal world, rising mortgage rates would push demand and home prices down enough to make up for high interest payments. But that’s not what’s happening now: Although new listings are ticking up slightly, inventory is still near record lows as homeowners hang onto their low mortgage rates–and that’s propping up prices,” said Redfin Economics Research Lead Chen Zhao. “Buyers–particularly first-timers–who are committed to getting into a home now should think outside the box. Consider a condo or townhouse, which are less expensive than a single-family home, and/or consider moving to a more affordable part of the country, or a more affordable suburb.”

Affordability is less of a problem for all-cash and move-up buyers. The major increase in income necessary to afford a home hits first-time homebuyers hardest. Buyers who can afford to pay cash aren’t impacted by high mortgage rates, and they likely earn more than the income necessary to purchase a home, anyway. Buyers who are selling a home to buy another one are in a better boat than first-timers because they have likely built up equity in their current home, which takes a bit of the sting out of soaring monthly payments. The caveat to the caveat is those who bought at the height of the pandemic-era market with an ultra-low mortgage rate and need to sell now: Not only are they giving up a low rate, they also may have lost money on their home. 

Metro-level highlights: Income needed to buy a home has risen in all major metros, with biggest uptick in Miami and smallest in Austin

August 2023, analysis includes 100 most populous U.S. metros for which data is available

  • Metros where necessary income has increased most: In both Miami and Newark, NJ, homebuyers must earn 33% more than a year ago to afford the typical home–the biggest percent increase of the major U.S. metros. Homebuyers in Miami need to earn $143,000 annually to afford the area’s typical monthly mortgage payment of $3,580, and Newark buyers need to earn roughly $160,000 to afford that area’s $3,989 payment.
  • Other metros where necessary income has increased by over 30%: The income necessary to afford a median-priced home has increased by over 30% in four other metros, all in the eastern half of the country: Bridgeport, CT ($183,000); Dayton, OH ($60,000); Rochester, NY ($66,000); and Hartford, CT ($95,000). 
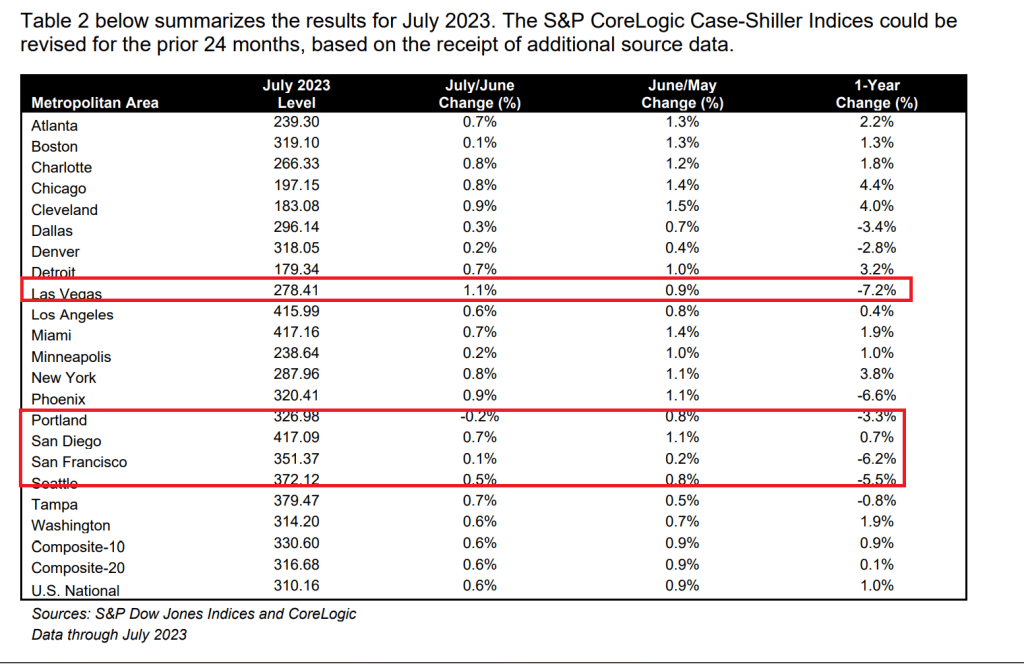
  • Buyers need to earn more in every major metro: Skyrocketing mortgage rates have caused the income necessary to buy a home to increase in every major metro, even the places where prices have declined over the last year. 
  • Necessary income has increased least in pandemic homebuying hotspots: Austin, TX homebuyers must earn $126,000 to afford the median-priced home, 8% more than a year ago–the smallest increase of all the major U.S. metros. That’s despite Austin home prices falling 7% year over year in August after they skyrocketed during the pandemic, with remote workers flocking in. Boise, ID, another pandemic homebuying hotspot where demand has since dropped, experienced the next-smallest increase: up 9% to $127,000. Salt Lake City, Fort Worth, TX and Lakeland, FL come next, with year-over-year increases of about 13% each. Home prices are down from a year ago in all those metros.
  • Homebuyers must earn six figures to buy a home in half the major metros in the country:  In 50 of the 100 metros in this analysis, buyers must earn at least $100,000 to afford the median-priced home in their area. Buyers must earn at least $50,000 everywhere in the country. 
  • Bay Area buyers must earn $400,000: Buyers in the most expensive markets in the country–San Francisco and San Jose, CA–must earn more than $400,000 to afford the median-priced home in their area, both up nearly 25% year over year. The next five metros are all in California: Anaheim ($300,000), Oakland ($250,000), San Diego ($241,000), Los Angeles ($237,000) and Oxnard ($233,000). 
  • Rust Belt buyers need the  least income–but it’s still up from a year ago: Detroit homebuyers must earn about $52,000 to afford the area’s median-priced home, up 19% from a year ago. That’s the lowest income required to afford a home in the U.S. Next come three Ohio metros (Akron, Dayton and Cleveland) and Little Rock, AR, all of which require roughly $60,000 in annual income to buy a home. 

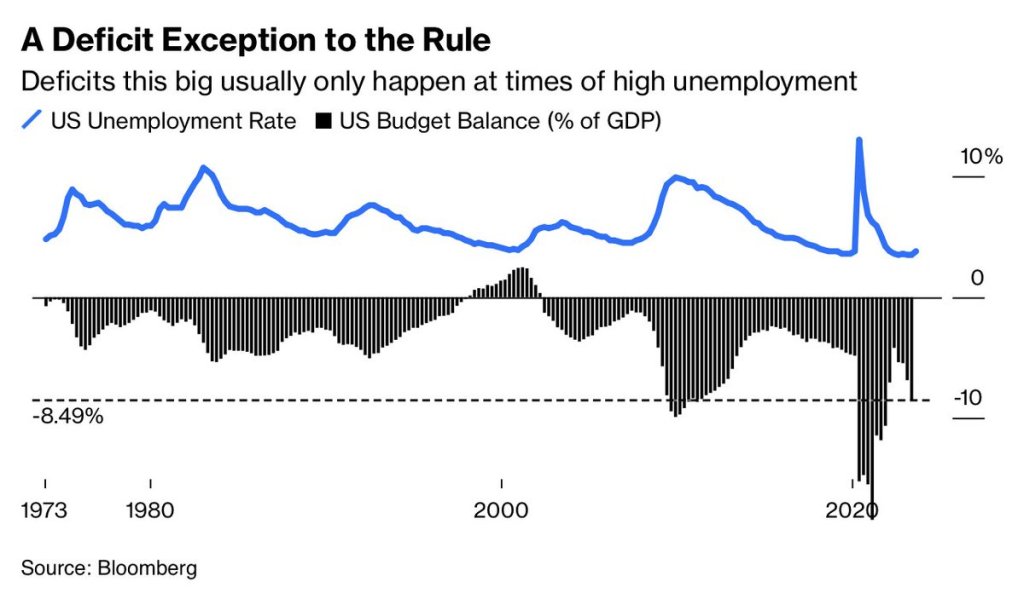
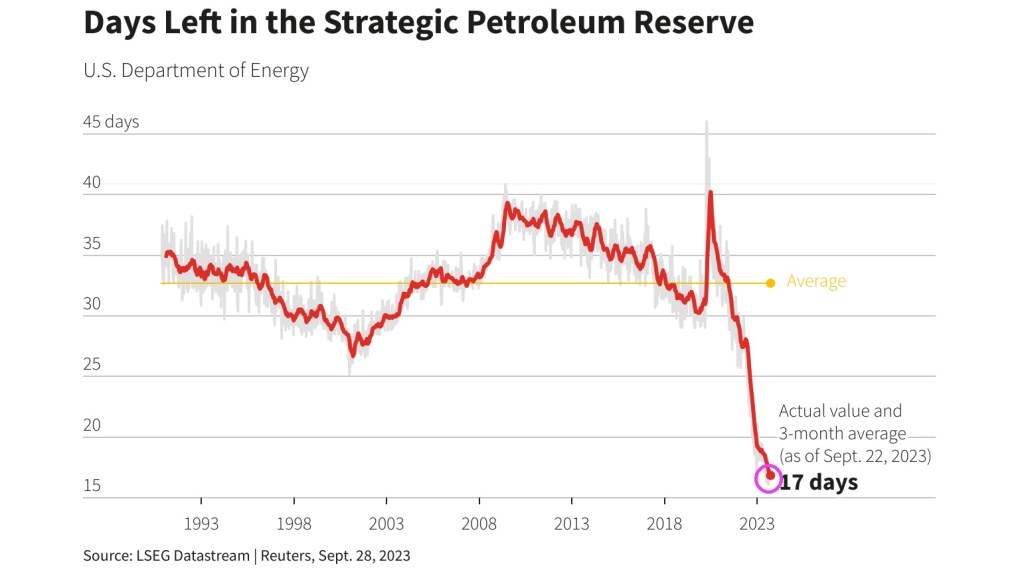
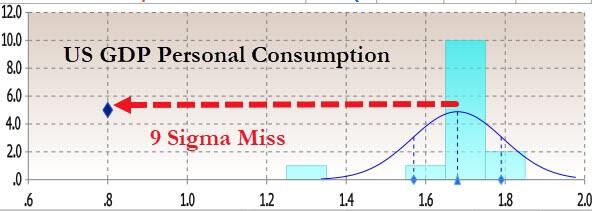
Face it, the US economy and housing/mortgage markets are addicted to gov!

Doctor, doctor (Yellen), we have a bad case of unaffordable housing!!

I like Yellen’s Space Invaders suit, so ’80s!

Livin’ La Vida Biden! Biden Administration Threatens Banks That Refuse To Lend Money To Illegal Immigrants As Biden Relaxes Oil Restrictions On Venezuela (IF Venezuela Allows Non-Maduro Candidate To Run For President)

We are Livin’ la vida Biden as Biden continues to push illegal immigration and working with Communist dictators like Venezuela’s Nicolas Maduro and NOT expand US energy production.

The Biden administration released a statement Thursday warning financial institutions against using a person’s immigration status in credit applications.

The Consumer Financial Protection Bureau (CFPB) and the Department of Justice (DOJ) released a joint statement telling financial institutions that while it is not illegal to consider a person’s immigration status in the decision on whether to lend money, an overreliance on it could run afoul of the law, according to the statement. The statement implicates the Equal Credit Opportunity Act (ECOA), which makes it illegal to discriminate on the basis of race, color, religion, national origin, sex and more in considering a person’s credit application as the mechanism, even though the law does not list citizenship status as a protected attribute.

US, Venezuela to announce oil sanctions deal on Tuesday -report.

The result? WTI Crude is down almost -1% today and Brent Crude is down over -1%.

The sad part of Biden’s deal with brutal Marxist dictator Nicolas Maduro requires Venezuela to allow another candidate to run against Maduro in the next Presidential election. What? Biden and Democrats are working hard to eliminate Donald Trump from running for President in 2024, but want Venezuela to have competition??

So, Biden is sticking to his anti-US energy production stance while supporting a brutal Marxist dictator AND forcing banks to lend to illegal immigrants.

Joe Biden and brutal Marxist dictator Nicolas Maduro.

Burning Down (The Economic) House? Food Prices UP 20% Under Bidenomics, Credit Card Delinquencies Now Higher Than During Covid As Credit Card Debt Grows To All-time High To Cope With Inflation

Is Biden trying to burn down the economic house? Under Bidenomics, America’s middle class and low wage workers are suffering from a wild, wild life in terms of inflation.

First, food prices are up 20% since December 2020. Talk about destruction of middle class wealth!

That is in addition to gasoline prices are up 64% under Biden while rent growth is up 252%. Well, Biden waived through millions of illegal immigrants and rent had to rise. Biden and Washington DC’s broken borders is Livin’ La Vida Loco.

To cope with inflation (that Paul Krugman claims is over but the last inflation report showed that the tinders of inflation are hard to extinguish), consumers have turned to credit cards to survive. In fact, credit cards have expanded 38% since April 2021 despite rapidly rising interest rates. And credit card delinquency rates are rising and are now above Covid-era economic shutdown levels.

Despite Krugman and Yellen’s screaming that inflation has been crushed, US household are anticipating FASTER inflation. To paraphrase the Emperor of Austria from “Amadeus,” “You are passionate Krugman and Yellen, but you do not persuade.”

And Billions Biden has just recorded the third largest deficit in history.

US Treasury Secretary (and former Fed Chair) Janet Yellen, the Destroyer of Wealth!

Hard To Kill! PPI Final Demand Rose 2.2% YoY In September (4th Consecutive Month Of Growing Producer Prices And Trend Is Increasing!)

Like the Steven Seagall flick “Hard To Kill,” inflation caused by rampant Federal spending is hard to kill.

For the fourth straight month, the producer price index final demand has been increasing. It was 2.2% year-over-year. And INCREASING!!!!

Here are the YoY changes in PPI Final Demand for 2023. After near zero growth in June, PPI Final Demand YoY has been steadily increasing … again.

2023-01-01 5.7
2023-02-01 4.8
2023-03-01 2.7
2023-04-01 2.3
2023-05-01 1.2
2023-06-01 0.3
2023-07-01 1.2
2023-08-01 1.9
2023-09-01 2.2

Yes, it is hard to get the proverbial horse back in the barn once inflation has been unleashed by Federal spending.

US Mortgage Purchase Demand (Applications) Down -19% Since Last Year (Mortgage Rates UP 165% Under Biden)

Now you know why the Mortgage Bankers Association, Home Builders and Realtors send a letter to Fed Chair Powell asking for rate hikes to cease. Mortgage rates are UP 165% under Biden.

But on to the demand side of mortgage finance.

Mortgage applications increased 0.6 percent from one week earlier, according to data from the Mortgage Bankers Association’s (MBA) Weekly Mortgage Applications Survey for the week ending October 6, 2023.

The Market Composite Index, a measure of mortgage loan application volume, increased 0.6 percent on a seasonally adjusted basis from one week earlier. On an unadjusted basis, the Index increased 1 percent compared with the previous week. The Refinance Index increased 0.3 percent from the previous week and was 9 percent lower than the same week one year ago. The seasonally adjusted Purchase Index increased 1 percent from one week earlier. The unadjusted Purchase Index increased 1 percent compared with the previous week and was 19 percent lower than the same week one year ago.

Bidenomics At Work! Mortgage Rates Hit Almost 8% (Highest Since July 2000 Under Bill Clinton), Deficits This High Usually Occur During Recessions And HIGH Unemployment

Joe Biden, who has always been a compulsive liar but at least sounded cognicent, is now babbling and whispering that Bidenomics works. But for who?

Clearly not for first time homebuyers or people looking to move. Bankrate’s 30-year mortgage rate is up to almost 8%, the highest since July 2000 and Willy Slick Clinton. That is a 176% increase in mortgage rates under the most inept “Economic Sheriff” in history.

Deficits? Deficits (which Biden makes outlandish claims) are usually only this big at times of HIGH unemployment and recessions. So, are the staggering deficits under Biden a precursor to a hard landing (recession)? Don’t listen to what Biden or KJP say!!!

Biden’s outlandish claims that he single handedly reduced the deficit by the most in history is, well, typical Biden bloviating. Actually, tax receipts soared after Covid lockdowns ended. Period. Now that stimulus is wearing out, deficits are climbing again.

The REAL Hateful Eight!

17 Days Later? Mortgage Demand Decreased -6% WoW In Weekly Survey, Purchase Apps Lowest Since 1995 (Only 17 Days Left For Strategic Petroleum Reserve)

Another week under Biden, another economic disaster. This time, its the mortgage market with mortgage demand (applications) down 6% from one week earlier, according to data from the Mortgage Bankers Association’s (MBA) Weekly Mortgage Applications Survey for the week ending September 29, 2023.

The Market Composite Index, a measure of mortgage loan application volume, decreased 6.0 percent on a seasonally adjusted basis from one week earlier. On an unadjusted basis, the Index decreased 6 percent compared with the previous week. The Refinance Index decreased 7 percent from the previous week and was 11 percent lower than the same week one year ago. The seasonally adjusted Purchase Index decreased 6 percent from one week earlier. The unadjusted Purchase Index decreased 6 percent compared with the previous week and was 22 percent lower than the same week one year ago.

The purchase market slowed to the lowest level of activity since 1995, as the rapid rise in rates pushed an increasing number of potential homebuyers out of the market. ARM loan applications picked up over the week and the ARM share increased to 8 percent, as some borrowers searched for ways to lower their payments.

The US 30-Year Mortgage Rate Tops 7.5% for First Time Since 2000.

On the energy front, where we are represented by former Michigan governnor Jennifer Granholm and former South Bend Indiana mayor Pete Buttigieg, we see that the Strategic Petroleum Reserve is down to only 17 days left.

Fear The Talking Fed! Treasury Rates Keep Climbing To Multiyear Highs As Fear Of More Rate Hikes Surfaces (Treasury Yields Decouple From Sinking Manufacturing Numbers)

Fear the talking Fed! Various Fed Presidents are talking this week and when they do. WATCH OUT!

The latest fear mongering will be … inflation is persistent and they might have to keeep raising rates.

The two-year Treasury remains above 5% and the 10Y-2Y T-Curve remains inverted.

Treasury 30-year yield rose to 4.856%, HIGHEST SINCE 2007.

The likelhood of another Fed rate hike is growing.

While inflation is cooling (but still elevated), The Fed could choose to rate hikes again.

Treaury yields have decoupled from US manufacturing data.

Best picture of Lael Brainard, Director of the National Economic Council of the United States and former Federal Reserve member and talking head. Or screaming head.

Biden’s Idiocracy! Bank Credit Growth Slows To -0.5% YoY, Every Monthly Payrolls Print In 2023 Has Been Revised Lower (Bidenomics Is The Economic Mutilator!)

Mike Judge wrote and directed a masterpiece of cinema called “Idiocracy” where large corporations convince a progressive government to use Brawndo (a Gatorade clone) to grow vegetables resulting in a Dust Bowl. Why? Because the Progressive leadership determine that plants crave … electrolytes.

But the electrolytes in Bidenomics has resulted in bank credit growth of -0.5% YoY.

On the data front, it has become a running joke: the “strong” Bidenomics economy comes with an expiration date, as it is only “strong” for about a month, at which point the initial “strength” is downgraded, and the data is revised sharply lower.

That has certainly been the case with US labor data, where as we first reported last monthevery single monthly payrolls print in 2023 has been revised lower (see chart below), a 12-sigma probability and virtually impossible unless there was political pressure to massage the data higher initially and then revise it lower when nobody is looking.

But the BLS is not done: as we reported last week, besides the now traditional one-month lookback revisions the ridiculously high monthly payrolls prints accumulated over the past year will also be slowly but surely revised gradually lower at annual benchmark revisions for years to come. As Morgan Stanley chief US economist Ellen Zentner explained (full note available to pro subscribers)…

Payrolls get revised too, and we expect a downward revision. Payrolls have an annual benchmark revision that is published in February each year. The revision adjusts the level of payrolls through March of the prior year. For example, a new revision will be published in Feb-24, adjusting payroll levels from April-22 to Mar-23. And a preliminary estimation of the upcoming revision points to a decrease in payroll YoY% growth rates of -0.2pp.

But while downward payroll revisions under Bidenomics are as certain as death and taxes, what we wanted to discuss here are the just as striking downward revisions to US consumption which hit this morning alongside the comprehensive once every-five-years historical revisions to GDP. As a reminder:

Today’s release presents results from the comprehensive update of the National Economic Accounts (NEAs), which include the National Income and Product Accounts (NIPAs) and the Industry Economic Accounts (IEAs). The update includes revised statistics for GDP, GDP by industry, GDI, and their major components. Current-dollar measures of GDP and related components are revised from the first quarter of 2013 through the first quarter of 2023. GDI and selected income components are revised from the first quarter of 1979 through the first quarter of 2023.

Earlier today we already noted the disaster that was Q2 Personal Consumption: instead of the 1.7% unchanged print from the second estimate of Q2 GDP, the final number was a dire 0.8%, a 9-sigma miss to estimates…

… and the worst quarterly increase since the Covid collapse in Q2 2020.

But what about other historical data? After all today’s revision impacted all data from Q1 2013?  Therein, as the bard says, lies the rub.

Let’s start with personal consumption, and compare the latest post-revision current data (link) with the most comprehensive pre-revision data as of last month (link). It should come as no surprise to anyone that with the (slight) exception of just Q4 2022, personal consumption in every single quarter since the start of 2022 – when the Fed aggressively started tightening and hiked rates by the most since Volcker – has been revised lower, and in some cases dramatically so.

Bloomberg also picks up on the GDP revision and looking at revisions to the historical data, writes that “the pandemic contraction is seen as being a bit less severe than previously thought: GDP is now reckoned to have dropped at a 28% annual clip in the second quarter of 2020, instead by 29.9%, as the government shut down swathes of the economy to fight the spread of the virus. But the recovery since then has been somewhat slower, according to the update. Growth last year was revised to 1.9% from 2.1%.” And of all GDP components, consumption was the weakest.

So not only was the Fed hiking at a time when personal consumption would grow much less period to period than previously expected, but the US economy was generally weaker than previously expected (as discussed here).

There’s more.

When looking at the composition of the US household’s income statement – the summary of economic accounts – we find just what we had expected: US savings were in fact far lower than previously expected.

In the latest negative revision, US households saved $1.1 trillion less than previously thought over the past six years…

… and indeed as the BEA chart below showsAmericans stashed away an average 8.3% of their disposable income annually from 2017 through 2022, down from a previously estimated 9.4%.

The reduction stems from an accounting adjustment that lowered personal income from mutual funds and real estate investment trusts. Additionally, as Bloomberg notes, much of the reduction in personal savings seen in the revised data occurred prior to the pandemic, so its implications for how much extra cash Americans may feel they still have now is not clear cut.

Whatever the reason for the statistical adjustment, however, one can say goodbye to even the faintest speculation that US households have any excess savings left… why they don’t, of course, because even when using the previous methodology which artificially inflated total savings, JPM calculated that excess savings had already run out…

… which means that if Q3 GDP was bad and consumption was “revised” sharply lower (odd how economic data is never revised higher under Joe BIden), Q4 – when savings are virtually non-existant – and where we also get the i) return of student loan payments; ii) the UAW strike; iii) the government shutdown and iv) oil at almost $100 and gasoline at one year highs, is about to fall off a cliff.

Yes, Bidenomics is a form of Brawdo, the economic mutilator!

Making America Unaffordable Again (MAUA)? US Home Prices Rise 1% YoY In July (After 0% Growth In June) Las Vegas Leads Downturn In Home Prices Followed By Zuckerburgh (San Francisco)

Thanks to rampant Federal spending and overstimulus by The Federal Reserve, US housing prices are simply unaffordable for many. Particularly since the Covid epidemic (Wuhan China Flu).

The S&P CoreLogic Case-Shiller U.S. National Home Price NSA Index, covering all nine U.S. census divisions, reported 1.0% annual change in July, up from a 0% change in the previous month.

Yes, home prices grew in July despite rising mortgage rates. As CS Lewis wrote “That Hideous Strength” but this is about how The Fed doesn’t understand what they have done.

At the metro level, Las Vegas leads in YoY price declines at -7.2%. In a close second is San Francisco at -6.2%. Portland and Seattle also declined.

Here is Screamin’ Joe Biden. You know Biden is lying when he gets angry.