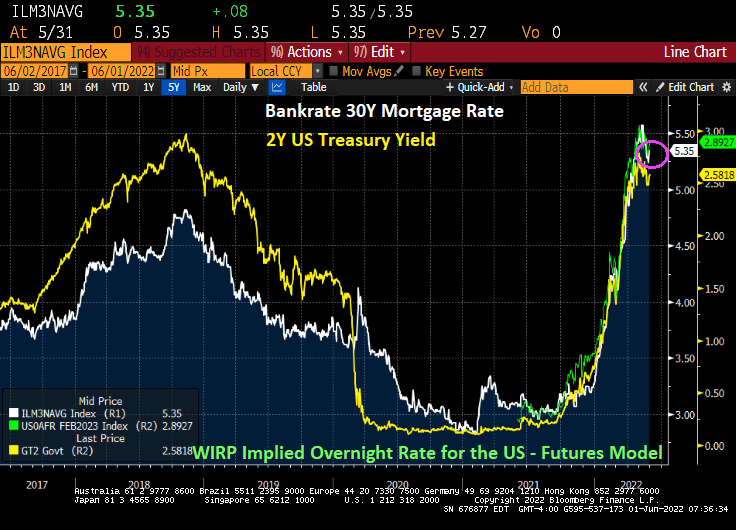
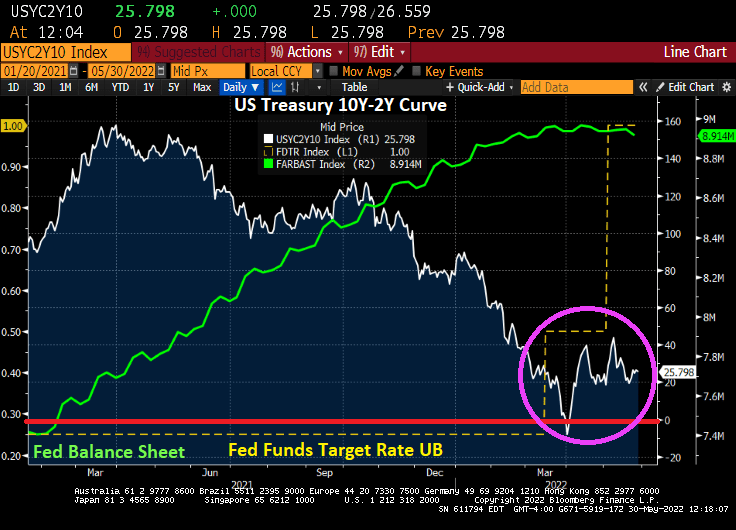
I call this The Federal Reserve’s Missouri Boat Ride.
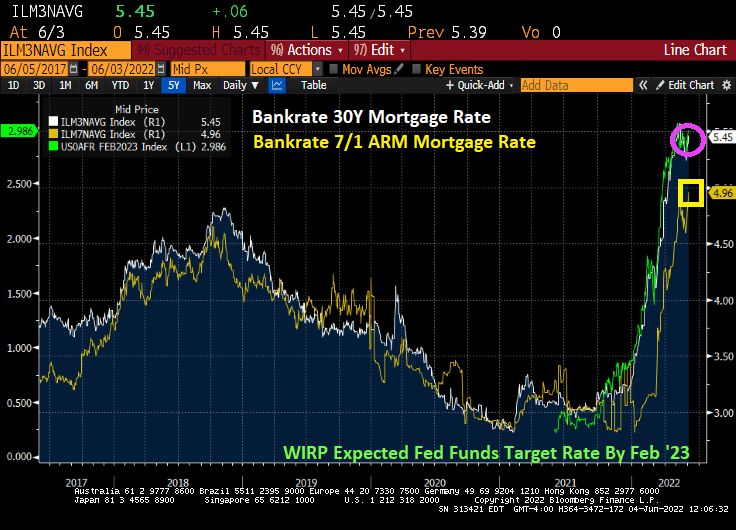
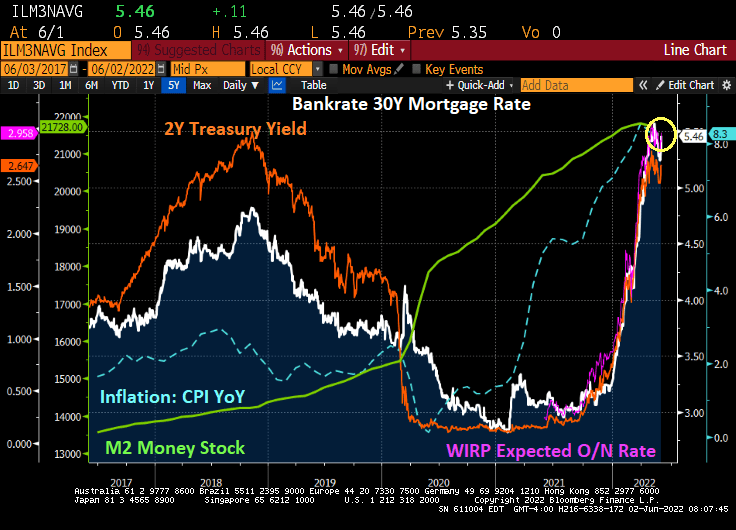
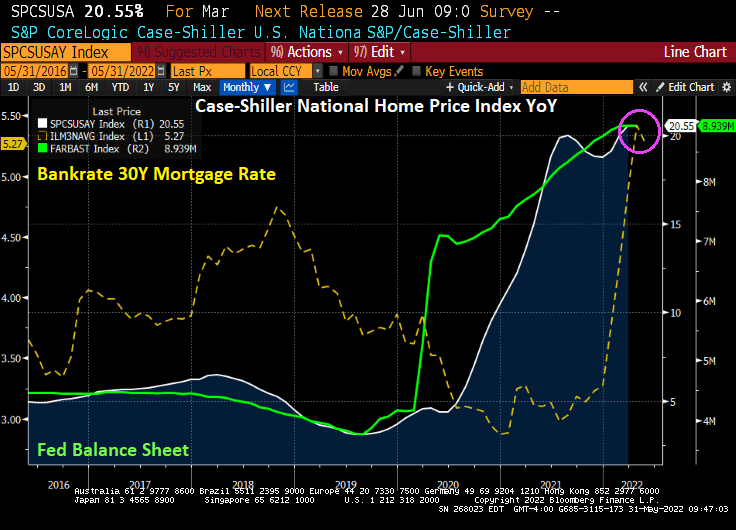
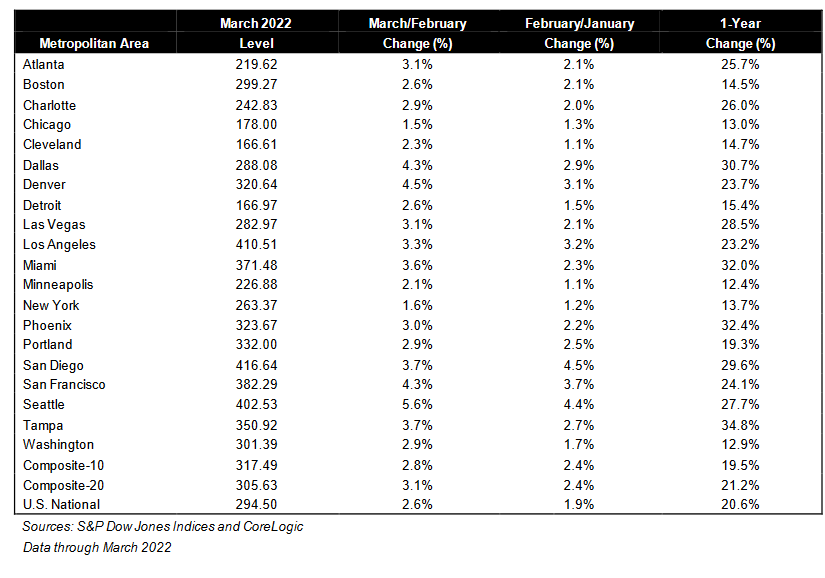
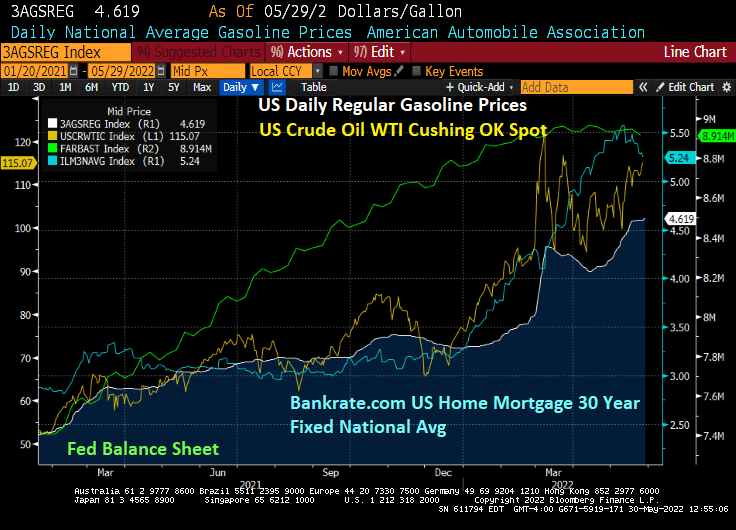
Meaning that The Fed has kept monetary stimulus in play for too long since late 2008 helping to lower mortgage rates from over 6% in November 2008 to 2.98% in November 2021. Then came “The Missouri Boat Ride” as The Fed signaled monetary tightening, leading to mortgage rates skyrocketing to their highest level since 2010.
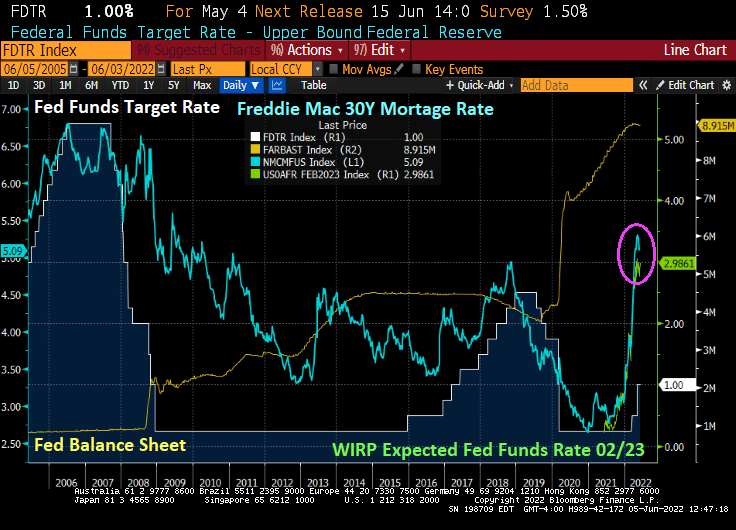
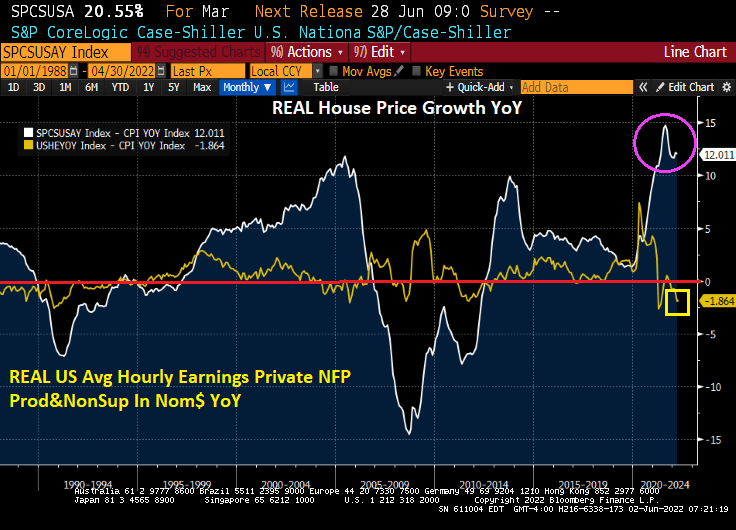
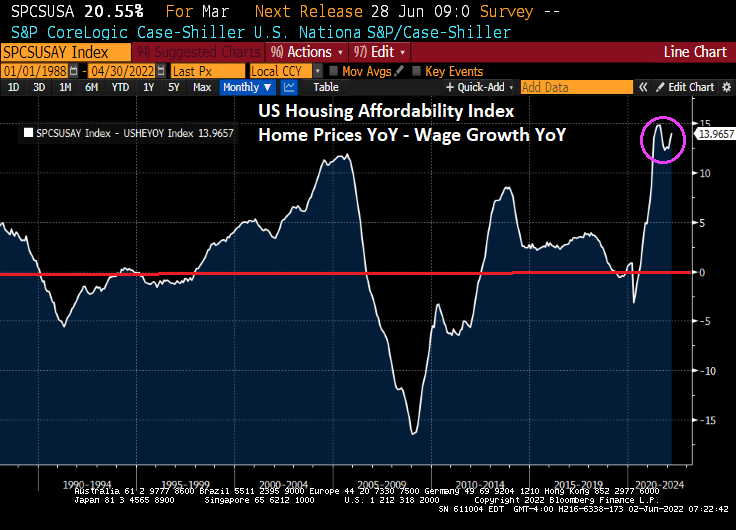
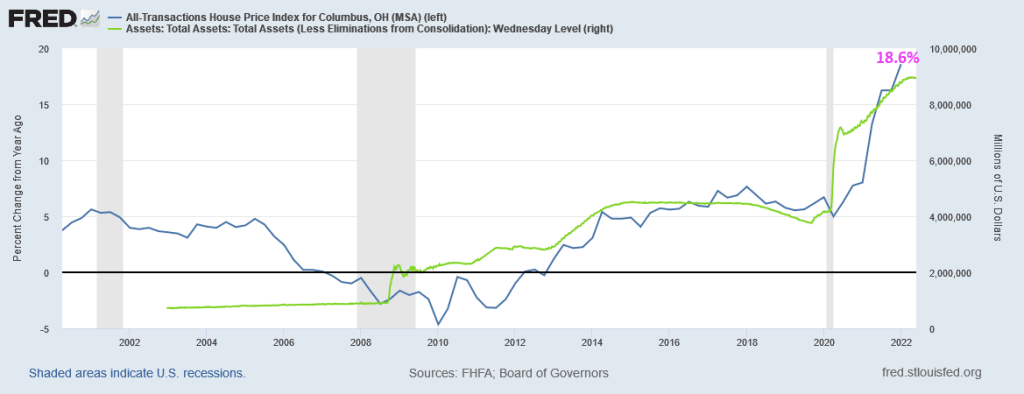
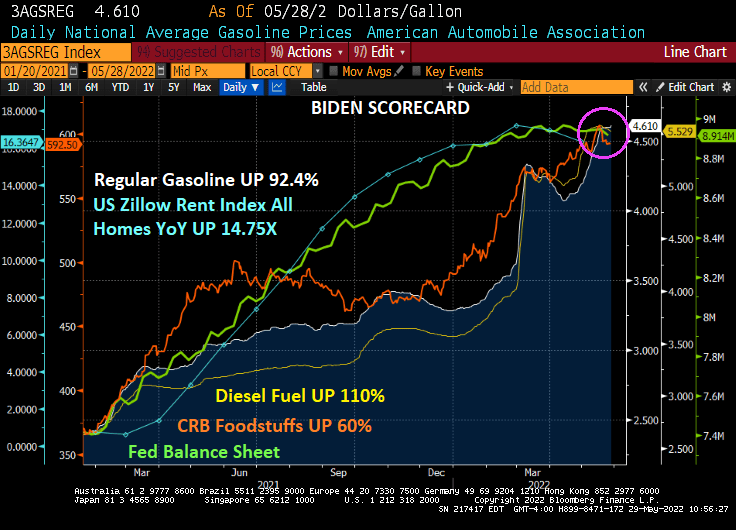
The result of rising home prices AND mortgage rates? Housing acquisition prices (home prices * 30 year mortgage rates) have skyrocketed.

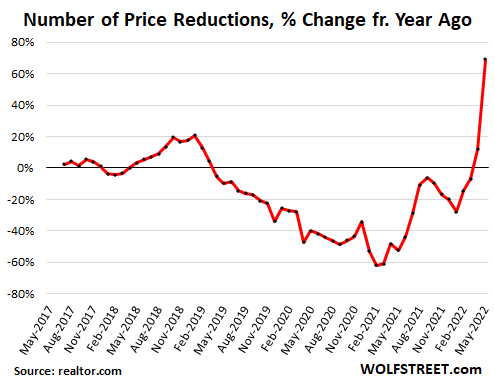
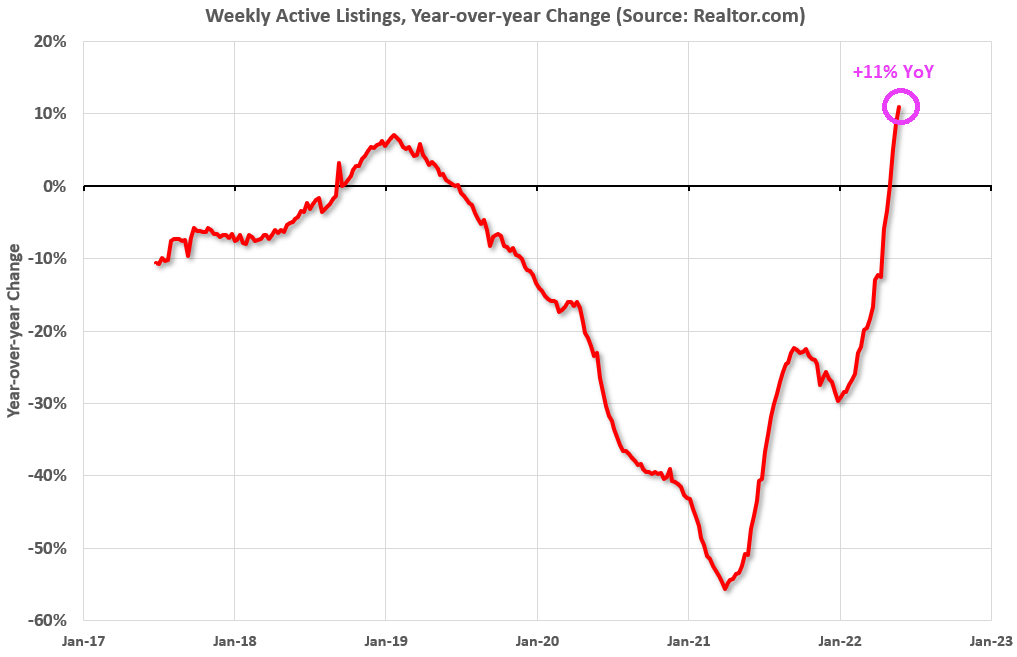
Between rising home prices and rising mortgage rates, we see that number of prices reductions increasing at nearly 70% YoY (chart courtesy of WolfStreet.com).
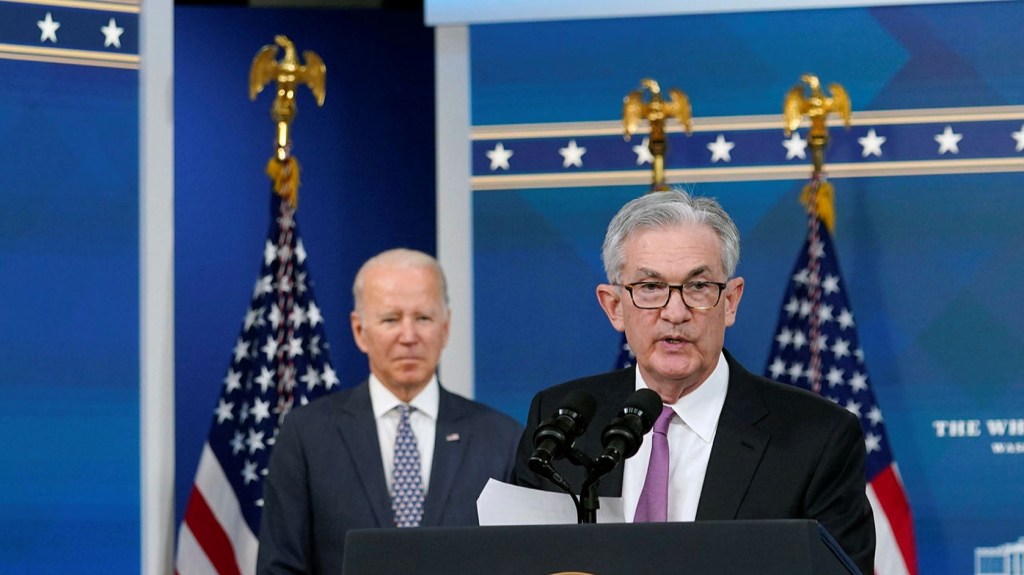
Of course, Congress and the media will never ask Janet Yellen (former Fed Chair [2013-2018] and current Treasury Secretary) WHY she kept massive monetary stimulus around for so long. Or why current Fed chair Powell did the same with Covid-related monetary stimulus.


You must be logged in to post a comment.