Annual U.S. Home Price Growth Hits 18% in October (Highest In Non-California West And Florida, Lowest In DC, NY And Illinois)

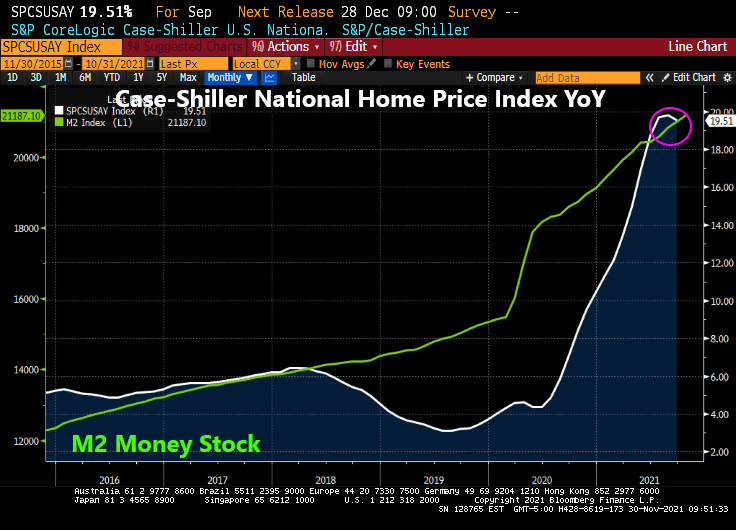
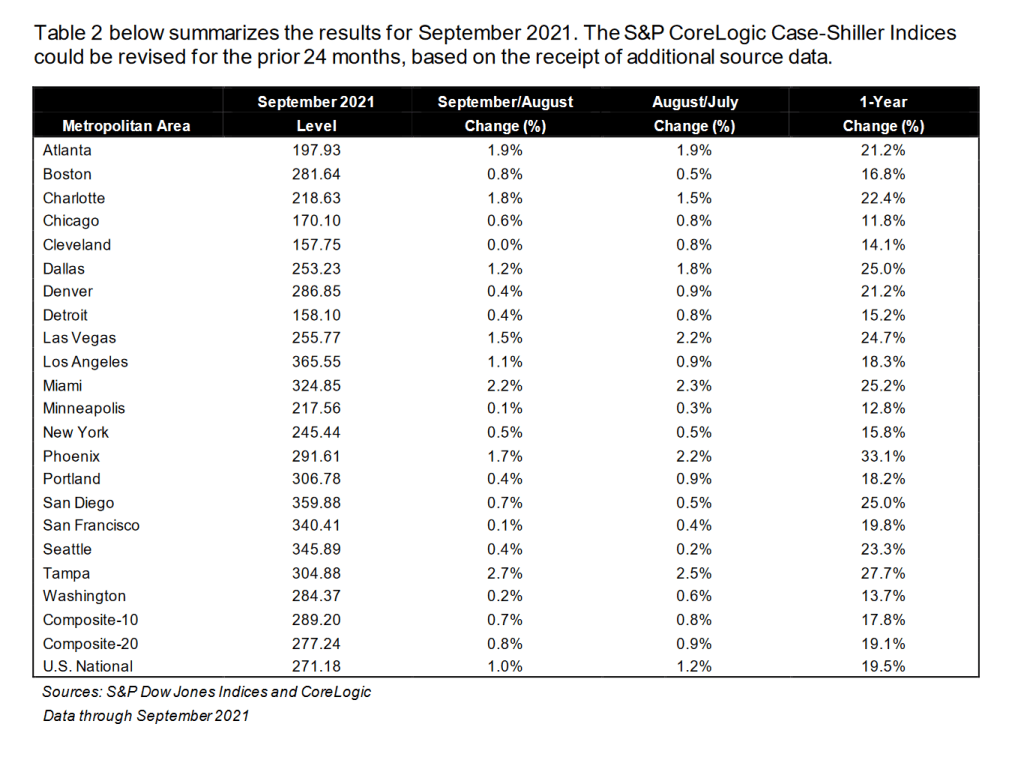
National home prices increased 18% year over year in October 2021, according to the latest CoreLogic Home Price Index (HPI®) Report . The October 2021 HPI gain was up from the October 2020 gain of 7.4% and was the highest 12-month growth in the U.S. index since the series began in 1976. The increase in home prices was fueled by low mortgage rates, low for-sale supply and an influx in homebuying activity from investors. Projected increases in for-sale supply and moderation in demand as prices grow out of reach for some buyers could slow home price gains over the next 12 months.

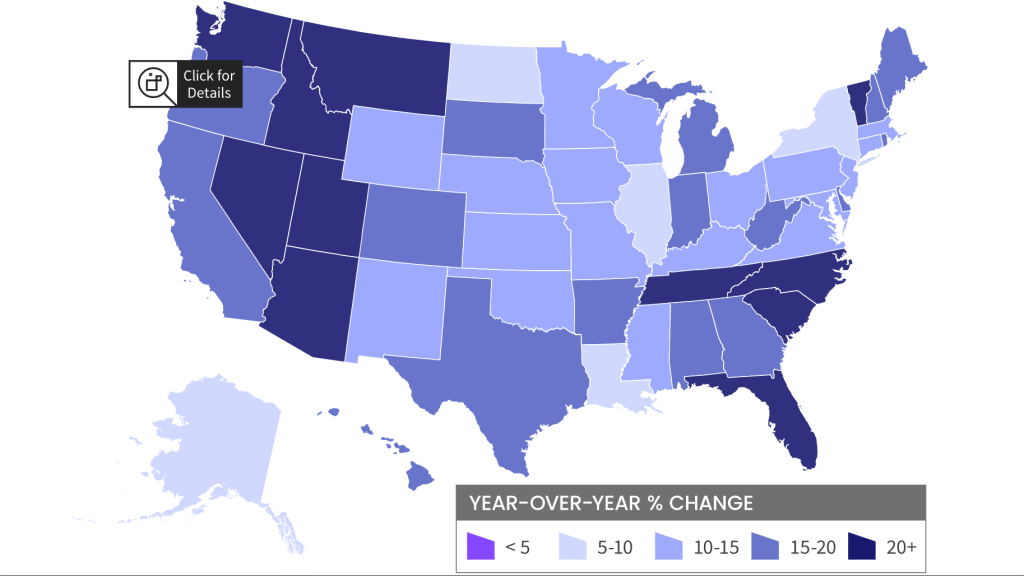
The non-California west (Arizona, Idaho, Utah, Nevada) and Florida have the strongest price growth while Washington DC has the slowest growth YoY.

Other “escape to” states like Vermont, Tennessee, North and South Carolina are also showing 20%+ rates of growth while the “escape from” states of Illinois, Louisiana, New York, and North Dakota are showing low growth as in 5-10% YoY.

Waiting for you in Florida!

US Mortgage Refinancing Applications Index PLUNGES 40.3% WoW (Purchase Apps Index Plunges 30.4%)

Its that time of year for mortgage purchases applications! Purchase applications usually decline during December and start to rise after the beginning of the year.

Mortgage purchase applications (white line) dropped -30.4% from the previous week, not usual for December. But what is surprising is the drop in REFINANCING applications: down -40.3% from the previous week.

30-year mortgage rates rose 2.16% from the previous week.

But between Omicron (or as the French say, “Oh! Macron!”) and The Federal Reserve, there is a good chance that mortgage rates will fall this week putting a quick end to refi application plunge.

Purchase applications? Nope, it is that time of the season when purchase applications drop like a rock.

US Home Prices “Slow” To +19.51% YoY In September (Phoenix AZ Sizzles At +33.1%, Chicago Slowest At 11.8%)

When I told Benzinga’s Phil Hall in an interview a while back that I thought US home price growth would slow, I didn’t consider the never-ending COVID epidemic (now with the Omicron Variant taking the stage. But at least the CoreLogic Case-Shiller National home price index (HPI) “slowed” in September from +19.84% to +19.51%.

Once again, low available inventory of houses for sale coupled with outlandish Fed stimulus has resulted in a housing crisis where home price growth (+19.51%) exceeds hourly wage growth (+5.76%) by almost 4x.

Where are all the home prices above 10% YoY? Every one of the 20 metro areas covered by Case-Shiller. Phoenix AZ leads at +33.1%. Chicago IL is the “slowest” at 11.8%.

Although Columbus OH is the growth hub of the state, Case-Shiller only reports Cleveland. So here is Columbus’s all-transactions home price growth for Q3: +16.2% YoY placing Columbus at the top of the midwest metro areas of Detroit, Chicago, Minneapolis and Cleveland.

With the latest Omicron Variation (sounds like a Star Trek TV show episode), I will bet that The Fed will stay a little longer and keep rates low, leading to home price growth (with limited available inventory) to continue to grow at double digit speeds.

The Fed is printing SOOOO much money that the dollar should have a double eagle on it.

U.S. Pending Home Sales Rebound (+7.5% MoM) To Highest Level Of The Year, BUT 5th Straight Month Of Negative YoY)

A forward-looking gauge of U.S. home purchases rebounded in October to a 10-month high, signaling steady housing demand despite growing affordability concerns among many prospective buyers.

The National Association of Realtors’ index of pending home sales increased 7.5% from a month earlier to 125.2, according to data released Monday. The median estimate in a Bloomberg survey of economists called for a 1% advance.

But it is the fifth straight month of year-over-year declines.

Low mortgage rates and solid job growth have supported housing demand this year as pandemic-weary buyers seek more spacious accommodations. Existing home sales are on track to exceed 6 million in 2021, which would be the strongest in 15 years, Lawrence Yun, NAR’s chief economist, said.

Yes, humongous stimulus from The Federal Reserve will help push existing home sales to exceed 6 million in 2021.

Still, competition over a scant number of listings — particularly on the lower, more affordable end of the resale market — has pushed prices out of reach for many prospective buyers. Builders have struggled to fill the void as supply-chain delays and labor shortages upend construction schedules, exacerbating the inventory crunch

Yes, inventory of homes available for sale is almost 1/3rd of the homes available in 2010.

Ten years after ... and we have progressively less inventory available.

US New Home Sales Decline 23.1% YoY In October As UMich Home Sentiment Plummets

While some economists are cheering the post-COVID economic recovery, I am not among them. Rampant inflation and bad economic policies are plaguing the non 1% of the population.

For example, new home sales dropped -23.1% YoY in October. As consumer sentiment for housing crashed to 63 (baseline of 100).

Why are consumers bummed-out about buying housing? How about rapidly accelerating new home prices???

October Country! US 1-Unit Housing Starts Decline -10.6% YoY As Housing Sentiment Crashes (High Housing Price Inflation Is Hurting)

US housing starts for October were less than expected. A 1.5% increase MoM was expected, but housing starts actually fell -0.7% MoM.

5+ unit (multifamily) starts were up 6.82% MoM. 1-unit single family detached units were down -3.89% MoM. Permits to build were up 4% MoM.

On a YoY basis, 1-unit start declined -10.6% as M2 Money growth continues to fall.

And 1-unit housing starts have fallen with the rapid decline in home buying sentiment.

1-unit starts have slowed to pre-COVID levels, thanks in part to The Federal Reserve’s money printing bonanza which may never end.

As housing sentiment crashes (due to rapid home price growth), we are seeing the demand for multi-family housing rise. 5+ unit (multifamily) starts were up 6.82% MoM in October.

It is October after all as winter sets in.

What’s Wrong With This Picture? M2 Money Growth “SLOWS” To 12.8% YoY As Real Earnings Growth Slows To -1.6% YoY (Will Omarova As Comptroller Make This Better??)

Highlights for Children has a popular segment called “What’s Wrong With This Picture?”

I give you my economics version of “What’s Wrong With This Picture?” It features The Federal Reserve’s M2 Money year–over-year compared with Real Average Weekly Earnings year-over-year.

Yes, M2 Money growth has “slowed” to 12.8% YoY while US Real Average Weekly Earnings YoY is now -1.6%. In other words, while M2 Money is still growing at a rapid pace, real weekly earnings growth is NEGATIVE.

The Fed continues to pump money into a bottle-necked economy while The Federal government pays people NOT to work.

The US Senate has a plan to fix the problem: Biden has nominated Saule Omarova, a dingbat law professor from Cornell (alma matter for The Office’s Andy Bernard), who proposes the following:

(1) Moving all bank deposits from commercial banks to so-called FedAccounts at the Federal Reserve;

(2) Allowing the Fed, in “extreme and rare circumstances, when the Fed is unable to control inflation by raising interest rates,” to confiscate deposits from these FedAccounts in order to tighten monetary policy;

And Ohio Senator Sherrod Brown (D-of course) thinks there is NO MORAL HAZARD PROBLEM with The Fed confiscating bank deposits for its own use?????

If I was attending Omarova’s confirmation hearing, my verdict would be ..

.

JOLT! Job Openings Changed Little (10.4 Million In September) As UMich House Buying Sentiment Declines Even Further (To 62 From 144 Last Year On This Date)

The Federal Reserve continues to JOLT markets with excessive monetary stimulus despite numerous reasons why they should back off.

For example, today’s JOLT report (US job openings) revealed that 10.4 million jobs were open in September. This is the fourth consecutive month of 1 million plus job openings, yet The Fed refuses to raise their target rate.

At the same time, the University of Michigan survey revealed that buying conditions for houses dropped to 66 (baseline of 100). To show how bad this is, buying conditions for houses was at 144 this time last year.

UPDATE: UMich revised their number downward to 62, the lowest since 1981.

In The Fed’s mind, they are still chasing at least 3.5% unemployment, the lowest rate under President Trump prior to COVID. But with perpetual million plus job openings GOING UNFILLED, trying to get to pre-COVID unemployment rate of 3.5% is a fool’s errand.

Of course, with The Fed helping to pump up house prices to largely unaffordable levels, it makes sense that enthusiasm for buying expensive homes has crashed.

Meanwhile, The Fed continues to JOLT the economy with excess stimulus.

Overall inflation fears are leading to lowest consumer confidence since 2011.

PLEASE stop JOLTING US!!

Stimulypto! 10-year REAL Treasury Yield Is -3.9364% And REAL 30-year Mortgage Rate Is -2.30%!

Yes, the US economy has been greatly overstimulated by the Federal government (fiscal stimulus) and The Federal Reserve (monetary stimulus). This has caused inflation that we haven’t seen in a long time.

How overstimulated in the economy? The REAL 10-year Treasury yield (nominal less CPI YoY) is now -3.9364% and the 30-year REAL mortgage rate is -2.30%.

When will Federal stimulypto end?

U.S. Pending Home Sales Fell by More Than Expected in February (-7.19% YoY) With Sinking Real GDP Growth

US pending home sales declined -2.3% MoM and -7.19% YoY as US GDP sinks like a paralyzed falcon,

(Bloomberg) — The National Association of Realtors’ index of pending home sales decreased 2.3% in September from a month earlier to 116.7, largest drop since April, according to data released Thursday. 

The median estimate in a Bloomberg survey of economists called for a 0.5% advance.

Compared with a year earlier, contract signings were down 7.2% on an unadjusted basis”

Forecast range from -4.6% to 4.5% from 30 economists surveyed

Signings declined in all four U.S. regions from the prior month, led by a 3.5% drop in the Midwest
Unlike existing-home sales, which are calculated when a contract closes, the index of pending home sales is based on contract signings

Treasury Secretary Janet Yellen: “What, me worry?”