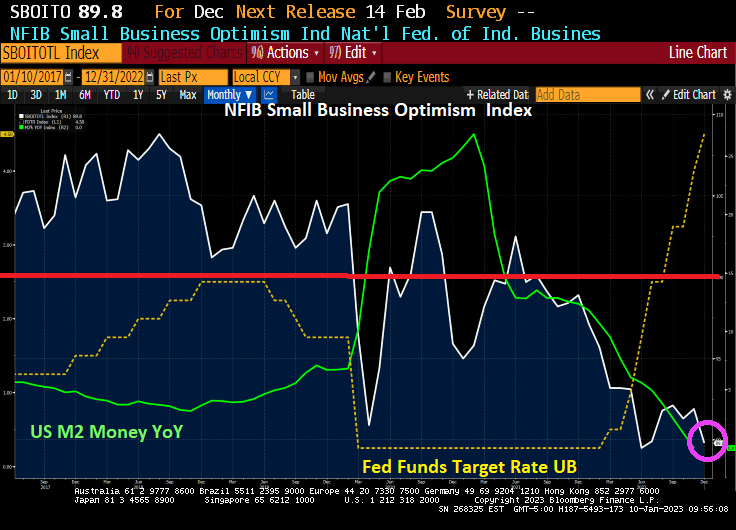
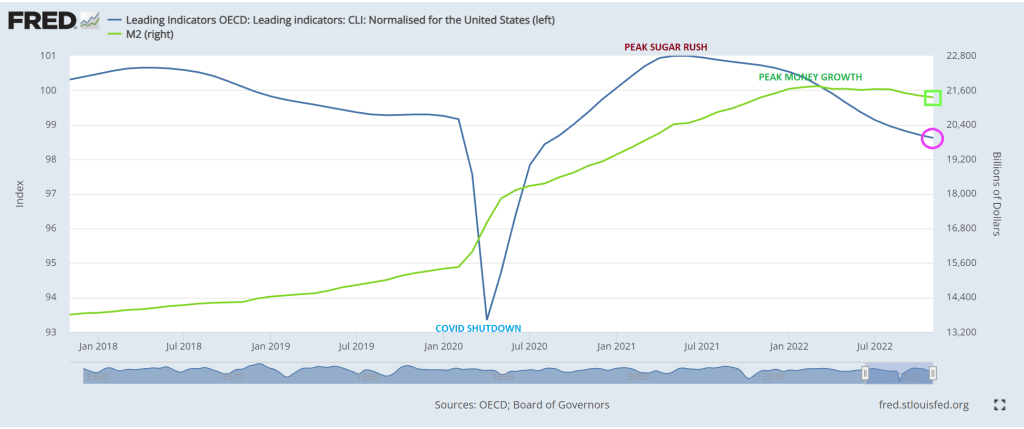
The NFIB Small Business Optimism Index is plunging and just fell below 90. The index was above 100 before the Wuhan virus outbreak in 2020, but has only been at 100 or above for only two months under Biden. And the trend is definitely looking bleak as The Federal Reserve fights inflation with M2 Money growth having collapsed to 0% YoY growth.
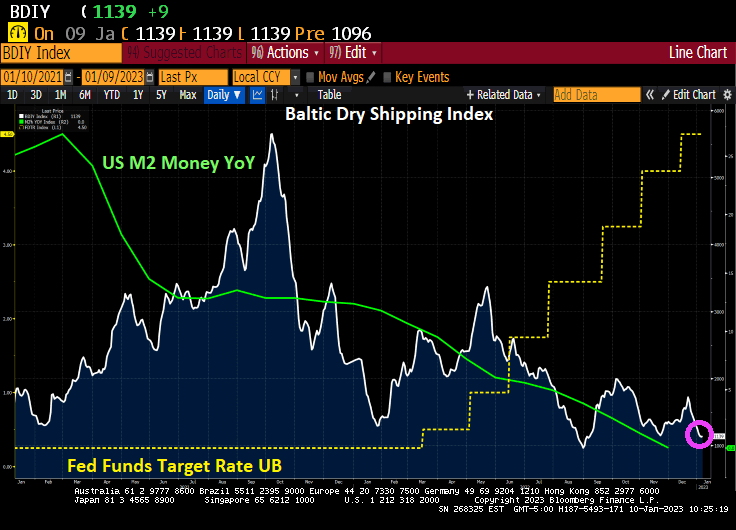
And the Baltic Dry shipping index is falling with M2 Money growth YoY.
I wonder what Fed Chair Jerome Powell is thinking?
The Federal Reserve will be the backstop of the Treasury market this year to alleviate dysfunction resulting from its increasing size and the retreat of regular buyers.
That’s the view of Credit Suisse Group AG analyst Zoltan Pozsar, who in a note to clients Friday predicted the Fed will restart asset purchases during the summer of 2023.
In Pozsar’s analysis, relative-value funds won’t buy Treasuries unless they cheapen a lot relative to overnight index swaps, and banks with sagging reserves are more likely to tap the funding markets than to buy Treasuries. FX-hedged buyers have been “priced out,” and geopolitical events have reduced large reserve managers’ appetite for US debt, he said.
Flagging demand from marginal buyers will depress demand for Treasury auctions, sparking selloffs in equities, credit and emerging markets, according to Pozsar.
“This is a ‘checkmate-like’ situation,” he wrote. “The Fed won’t be a pivot and the terminal rate may have to go higher still, neither of which augurs well for either risk assets or Treasuries.”
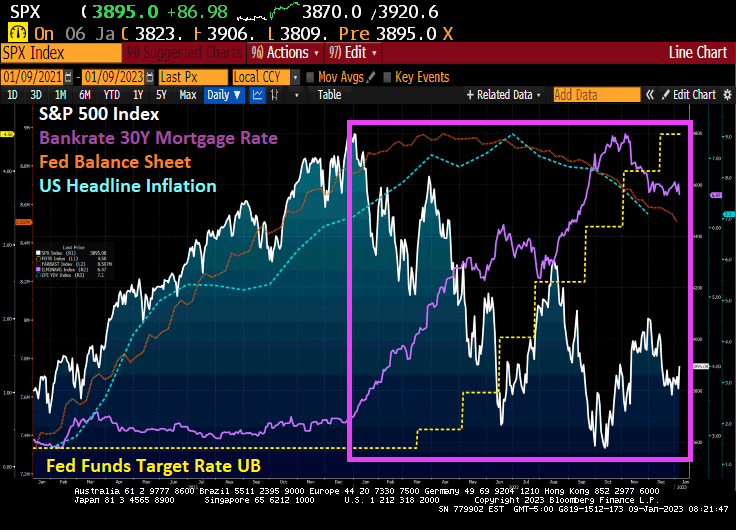
As The Fed started to raise rates (yellow line) to fight inflation (blue dashed line), the S&P 500 index started to fall. Note that The Fed’s balance sheet (purple line) is mirroring the inflation rate.
Fed Funds Futures point to Zoltan’s reversal in June 2023.
Will The Fed pivot? Zoltan says yes, the talking Fed heads say no.
Mortgage applications generally nosedive in the last two weeks of the year (seasonality effect), but Federal Reserce monetary tightening to fight inflation is making the last two weeks worse than usual.
Mortgage applications decreased 13.2 percent from two weeks earlier, according to data from the Mortgage Bankers Association’s (MBA) Weekly Mortgage Applications Survey for the week ending December 30, 2022. The results include adjustments to account for the holidays. It marked the lowest mortgage applications since 1996.
The Market Composite Index, a measure of mortgage loan application volume, decreased 13.2 percent on a seasonally adjusted basis from two weeks earlier. On an unadjusted basis, the Index decreased 39.4 percent compared with the two weeks ago. The holiday adjusted Refinance Index decreased 16.3 percent from the two weeks ago (2WoW) and was 87 percent lower than the same week one year ago (YoY). The seasonally adjusted Purchase Index decreased 12.2 percent from two weeks earlier. The unadjusted Purchase Index decreased 38.5 percent compared with the two weeks ago and was 42 percent lower than the same week one year ago.
Notice that purchase applications are declining with slowing M2 Money growth showing the impact of The Fed trying to remove the punchbowl.
The week-over-week (or WoW) numbers are pretty bad.
First, banks are stashing cash with the New York Fed on an “overnight basis” although it is looking pretty permanent to me. Repos (or repuchase agreements) soared to $2.55 TRILLION as of 12/30/22.
But this morning we see the US Treasury 10-year plummeting -15 basis points. As I used to tell my University of Chicago, Ohio State and George Mason finance students, any 10 basis point shift (plus or minus) is a big deal. Something is happening.
The 10-year Treasury yield plunging -15 bps is a “good thing” for the mortgage market in that US mortgage rates will likely follow suit and fall.
Today is all quiet of the financial market front since the US stock
Today is all quiet of the financial market front since the US stock and bond markets are closed. But as the new year starts, we have to ask the following question: is the US already in a recession?
A simple measure of IMPENDING recession is the US yield curve which is currently inverted. Typically, a recession occurs within months of the yield curve inverting. But if we look at real GDP growth, the Atlanta Fed GDP tracker is at 3.7%, so no recession there (two consecutive quarters of negative GDP growth is often used as a measure of recession).
But another indicator of “all is not well” is the CBOE Put/Call Ratio. Typically, the Put/Call Ratio spikes during a recession. But on December 28, 2022, the Put/Call Ratio spiked to its highest level since 1996. Although it has calmed down to 0.84 on December 30, 2022. Suffice it to say that there is enormous uncertainty in markets.
Covid begat massive Fed monetary stimulus and an excuse for the Federal government to go on a series of spending sprees (Covid “relief”, Instrastructure, Inflation Reduction, and now the $1.7 Trillion pork-laden Omnibus bill). Now that historic big spender Nancy Pelosi (CA-D) is no longer Speaker, will her successor have such a voracious spending appetite? The US economy is still benefitting from Covid-related stimulus which also helped generate 40-year highs in inflation.
Thanks to inflation, US workers have had 20 consecutive months of negative wage growth. But as M2 Money growth slows to a halt, so will real average hourly earnings.
The traditional measures of recession (unemployment and Real GDP growth) are NOT pointing to recession, but 20 straight months of negative wage growth points to bad news for workers. Throw in an inverted yield curve and massive volatility in the CBOE Put-Call Ratio and we have a party … that I don’t want to attend.
As we begin 2023 (and I am still bummed-out over Ohio State University losing a nail-bitter to Georgia in the Peach Bowl), we need to look at the condition of one of the most important sectors of the US economy.\, housing.
If we look at the US Housing Leading Growth index (courtesy of RecessionAlert.com) has slumped to its worst reading since the recessions of 1982 and 2008.
And then we have the OCED leading indicators for the US falling as M2 Money growth slows.
My favorite chart shows US home price growth falling faster than University of Michigan football team’s national championship home hopes.
Will this prompt The Federal Reserve to pivot? Only time will tell.
Trying to survive high inflation is difficult, but surviving The Federal Reserve’s counterattack to inflation is even more difficult.
Two people who constantly appear in the business are ARK’s Cathie Wood and TSLA’s Elon Musk. A third we can add is Sam Bankman-Fried of FTX and Alameda Research infamy.
So which one was the best at surviving inflation and The Fed’s counterattack? Answer? None of them.
Since the same day last year, we have seen M2 Money growth plunge and The Fed Funds Target rate rise rapidly from 25 basis points to 4.50%, a rapid increase. But over the last year, Cathie Wood and ARK fell -68.4%, Elon Musk’s Telsa fell -68.9% and Bitcoin fell -65.1%
So, ARK, Tesla and Bitcoin were demolished in 2022 thanks to inflation and The Fed’s counterattack. But the NASDAQ index was down too, but only -35.2% YoY.
US existing home sales in November collapsed by -38.6% YoY as M2 Money growth runs out of gas.
The above chart is similar to yesterday’s “Ski Slope” chart of US home prices YoY.
Unfortunately, pending home sales YoY are the worst in recorded history.
What will President Biden do about this dire situation? Our “Vacationer in Chief” is off on yet another vacation to St. Croix in the US Virgin Islands, so probably nothing. Now that Biden is sunbathing, what will his Treasury Secretary Janet Yellen do?
The market began downshifting earlier this year as the Federal Reserve started hiking its benchmark interest rate, with the goal of easing high inflation that’s been driven in part by skyrocketing housing costs.
Rates for 30-year, fixed mortgages reached 7.08% in October — and again in November — though they have since retreated, Freddie Mac data show. With borrowing costs roughly double where they were at the start of the year, and inflation leaving less savings to put toward a down payment, homebuyers have pulled back. Sellers are also reluctant to list their properties, yet houses that are on the market are lingering and getting discounted as demand slumps.
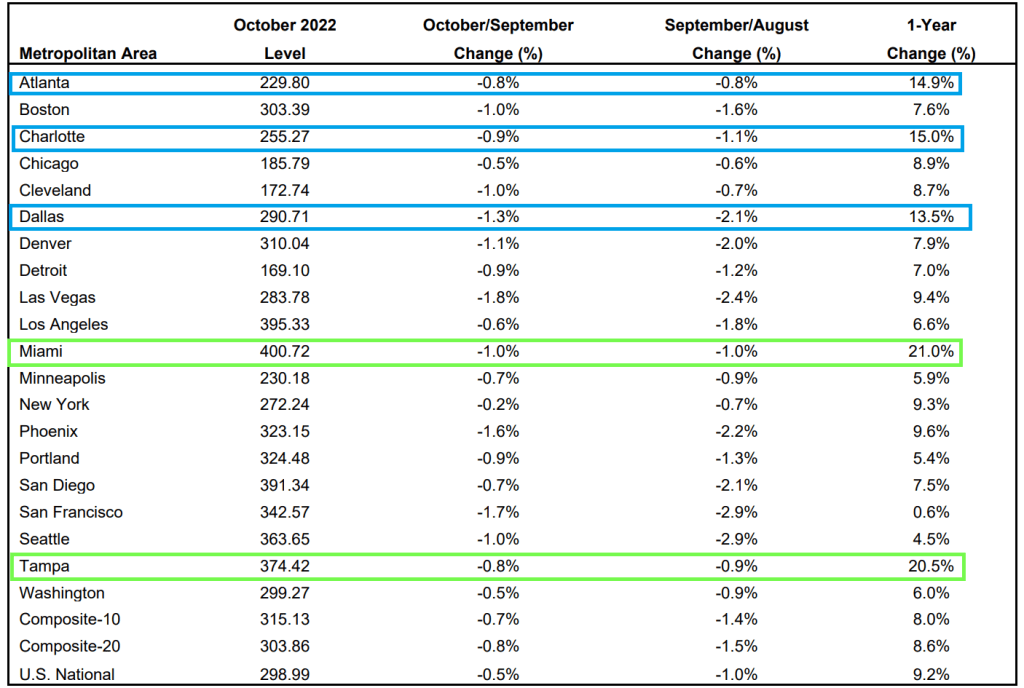
The Case-Shiller National Home Price Index “cooled” to 9.24% YoY growth as The Federal Reserve tightens its monetary noose.
Of the top twenty metro areas, both Miami and Tampa Florida were up over 20% YoY. Hot ‘Lanta, Charlotte and Dallas were over 10% YoY. Mordor on the Potomac was up “only” 6% and all other metro areas were under 10%.
But if we look at October/September changes, all metro areas are down (MoM) with San Francisco the worst.
Finally, The Federal Reserve’s massive balance sheet is still out in force.
Look at this chart of the Case-Shiller National home price index again The Fed’s balance sheet. Uh-oh.
Let’s look at San Francisco (my hometown) since The Federal Reserve began interest rate tightening.
As the global economy slows and global central banks continue to tighten, we are seeing gasoline and diesel prices falling.
But bear in mind that US gasoline prices remain 30% higher since Biden was sworn-in as President. Diesel prices are up a staggering 78% since that fatal day.
Speaking of tightening monetary policy, the US Treasury yield curves have flattened/inverted since The Fed started tightening with rate increases to fight inflation.
Let’s see how inflation does with Congress’ $1.7 trillion, unread Omnibus bill. Aka, Grand Theft Congress. Pelosi is holding an iPhone and Schumer is holding the scope rifle. McConnell is wearing the gas mask since the wasteful spending truly stinks.


You must be logged in to post a comment.