As I line up my move from Fairfax VA to Columbus OH, I am getting a variety of quotes from moving companies. And wow! The cost of moving using a national moving company for a 4 bedroom house is $15,000 to $20,500. That includes International, North American and Bekins.
One of the reasons for the high cost of moving is the massive increase in diesel fuel used for trucking. Diesel fuel under Biden has risen 117%. And since it was revealed that natural gas often is used for electric charging stations, and NATGAS is up 281% under Biden (but there aren’t many electric moving trucks yet).
The other problem facing moving companies is labor scarcity. Despite our open borders with Mexico and millions flowing across the border, moving companies STILL can’t find crews. Both Mayflower and United refused to give me a quote for moves under $1,000.
And for any of you who say “Do it yourself!”, I am physically disabled and can’t do it.
I wonder if it would be less expensive if we used horse-drawn moving vans?
You better hope it doesn’t get Cold Outside. Because the cost of heating your house just rose 5.74% this morning (natural gas futures). To $9.01.
Between Biden’s anti-fossil fuel policies and the war in Ukraine, natural gas futures are up 255% under Biden.
With rising natural gas prices, one would think American consumers and American home builders would start building higher-density housing like duplexes.
But The Federal Reserve has helped America build BIGGER houses (as in greater square footage).
Note that following the financial crisis and the takeover of the US economy by The Fed, median square footage of US housing starts rose with Fed easing. Median square footage started falling as The Fed leveled-off its asset purchases (green line). But when Covid struck and The Fed really went to town (aka, monetary stimulypto), median square footage started rising again.
The above chart demonstrate the conflict that can arise between a Presidential Administration and The Federal Reserve. President Obama wanted more green apartments built and less suburban growth, but thanks to The Fed, we got median square footage of new builds rising. But once The Fed took its enormous foot off the monetary accelerator pedal, median square footage started falling. Then Covid struck, The Fed intervened, and median square footage rose again.
But with alleged Fed monetary tightening, we should should see the demand for larger homes decline relative to smaller homes.
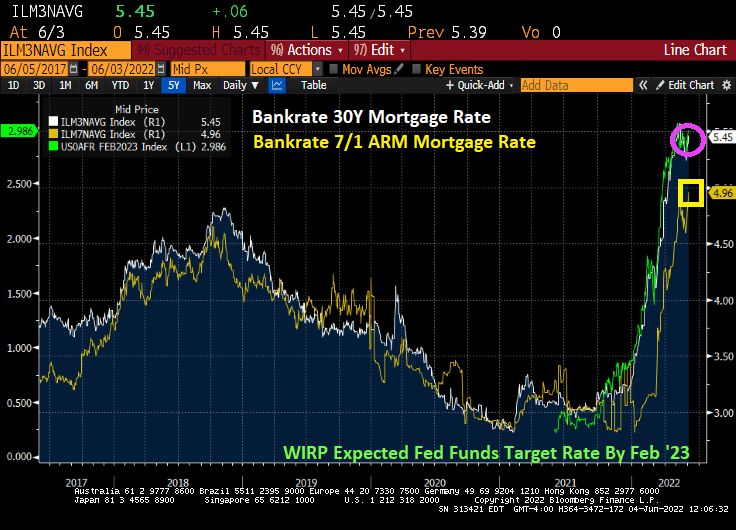
Mortgage rates have been climbing rapidly, making housing acquisition relatively less affordable.
Black Knight’s monthly P&I payment to average purchase price says it all.
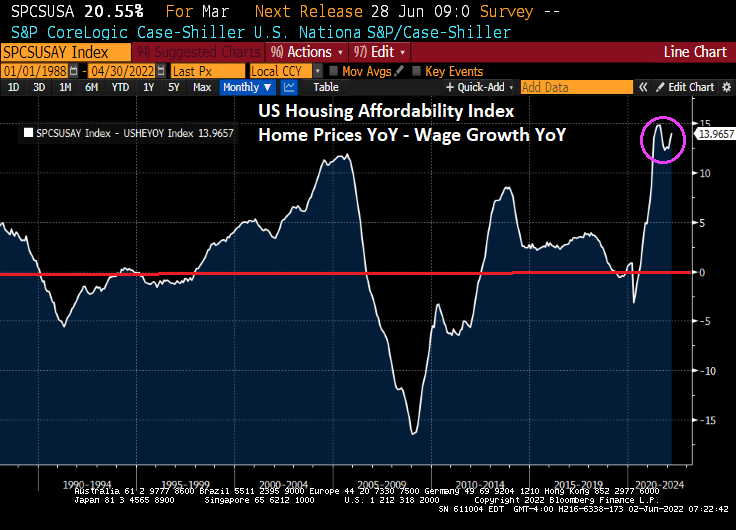
My version of the Black Knight chart is slightly different, but tells the same story: home prices and mortgage rates are rising FAST with Fed stimulus, but should slow down.
The Fed has helped make housing not only more expensive, but larger in size. And the Biden Administration and war has helped make heating those large houses more costly.
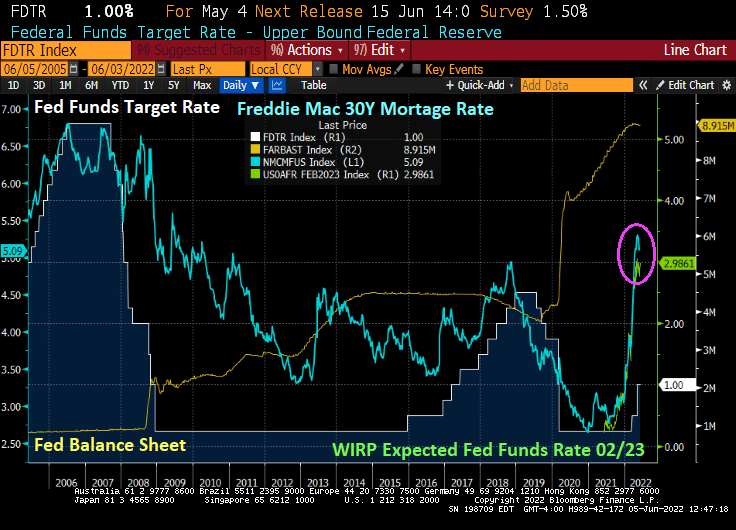
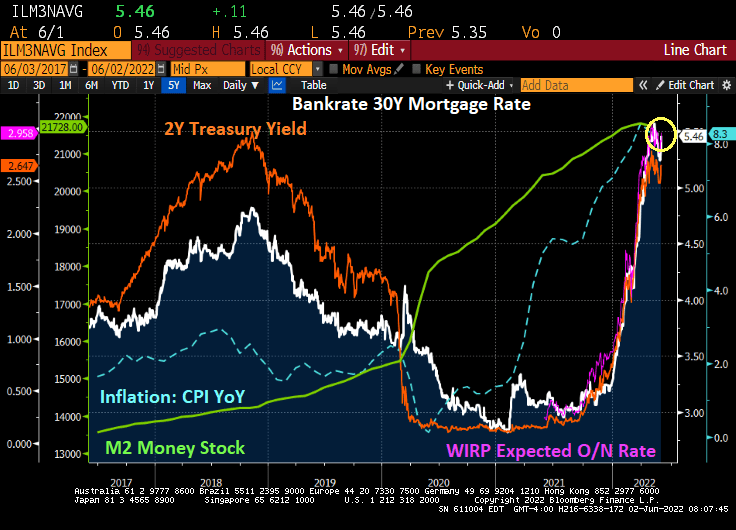
Meaning that The Fed has kept monetary stimulus in play for too long since late 2008 helping to lower mortgage rates from over 6% in November 2008 to 2.98% in November 2021. Then came “The Missouri Boat Ride” as The Fed signaled monetary tightening, leading to mortgage rates skyrocketing to their highest level since 2010.
The result of rising home prices AND mortgage rates? Housing acquisition prices (home prices * 30 year mortgage rates) have skyrocketed.
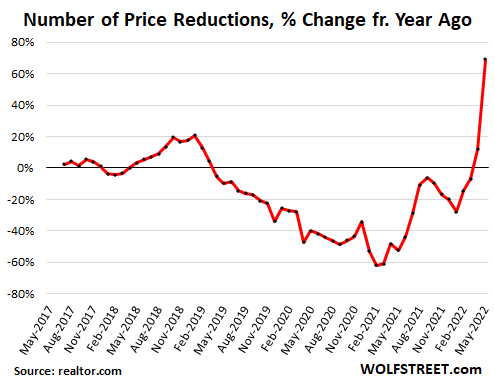
Between rising home prices and rising mortgage rates, we see that number of prices reductions increasing at nearly 70% YoY (chart courtesy of WolfStreet.com).
Of course, Congress and the media will never ask Janet Yellen (former Fed Chair [2013-2018] and current Treasury Secretary) WHY she kept massive monetary stimulus around for so long. Or why current Fed chair Powell did the same with Covid-related monetary stimulus.
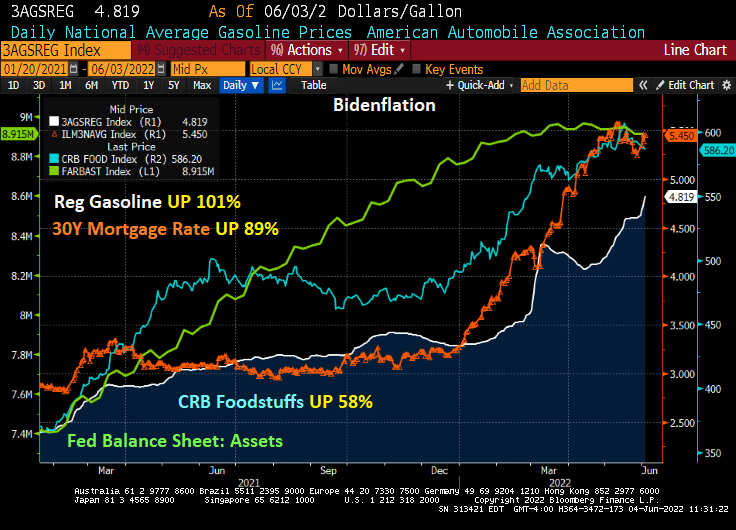
This is not the legacy that will endear President Biden to voters. Regular gasoline prices have risen 101% under Biden.
But it not just gasoline and diesel that are soaring (while the rest of us are sore!), CRB Foodstuffs are up 58% under Biden while the 30-year mortgage rate is up 89% under Biden.
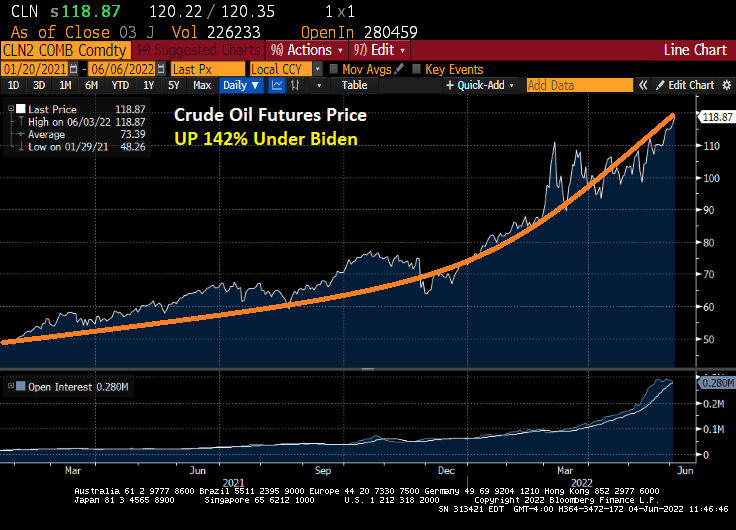
And this morning, WTI crude futures are up +1.71%.
And up 142% under Biden.
Prices are sizzling and clobbering the American middle class and low wage workers. But former Federal Reserve Chair and current US Treasury Secretary Janet Yellen never saw it coming.
Biden’s just killing us. And Powell is making up for Yellen’s keeping monetary stimulus too high for too long. Price? Mortgage rates are soaring.
Instead of President Ronald Reagan saying ““Mr. Gorbachev, tear down this wall” we need someone to tell President Biden and Federal Reserve Jerome Powell to “Stop driving up prices and making housing unaffordable.” Unfortunately, The Fed thinks that raising interest rates will temper price increases — it won’t. But it could tamper home price growth.
So what we are left with is soaring home prices AND soaring mortgage rates, leaving this scary chart. The housing cost index has risen 114.5% under Biden.
Its only going to get worse from here.
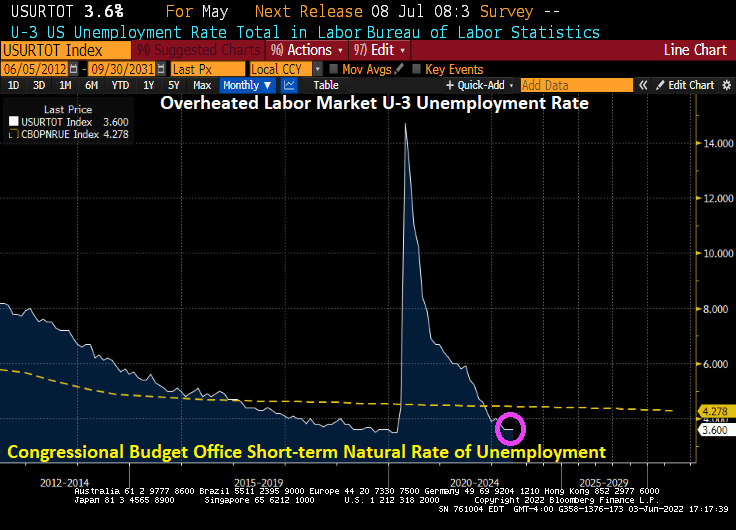
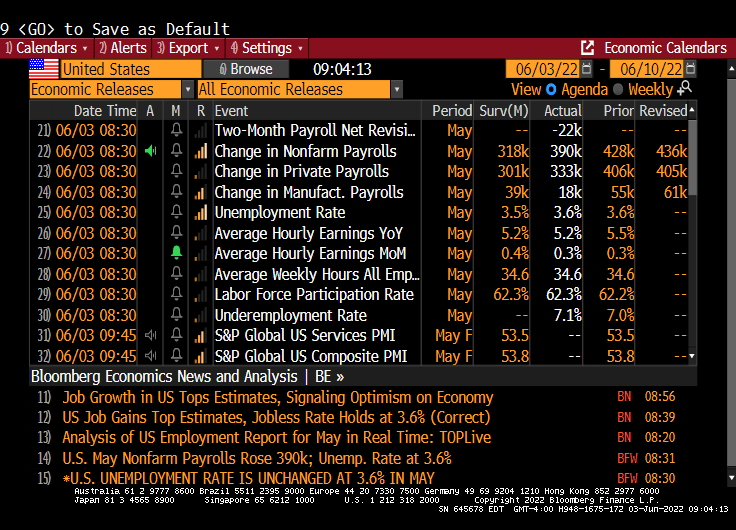
Today’s jobs report for May showed that the U-3 unemployment rate remained the same as April, 3.60%. However, that is lower than the NATURAL rate of unemployment of 4.445% indicating that the labor market is overheated. Historically, The Fed has tightened monetary policy by raising rates when this has happened. So, look for The Fed to keep raising rates.
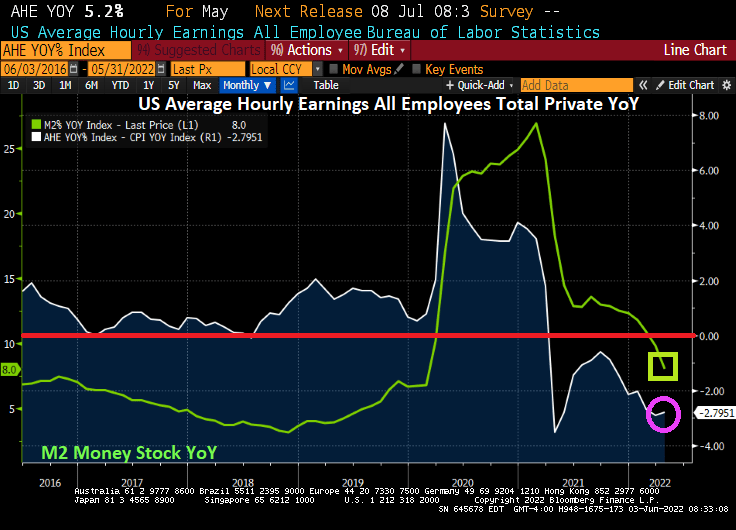
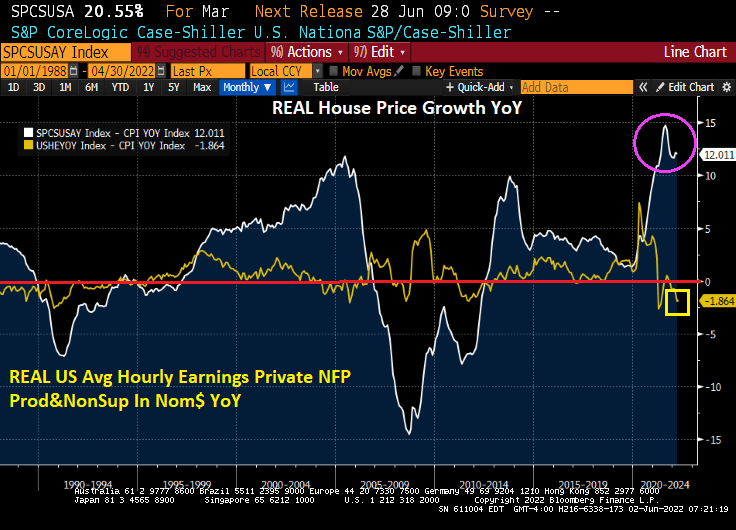
As I have mentioned before, REAL hourly wage growth is negative since March 2021, just after Biden signed his executive orders canceling drilling on Federal lands and cancelling the Keystone Pipeline. Later, he canceled off-shore drilling permits and Alaska drilling. Now we have REAL average hourly wages declining at -2.8% YoY as The Fed has been reducing M2 Money supply YoY.
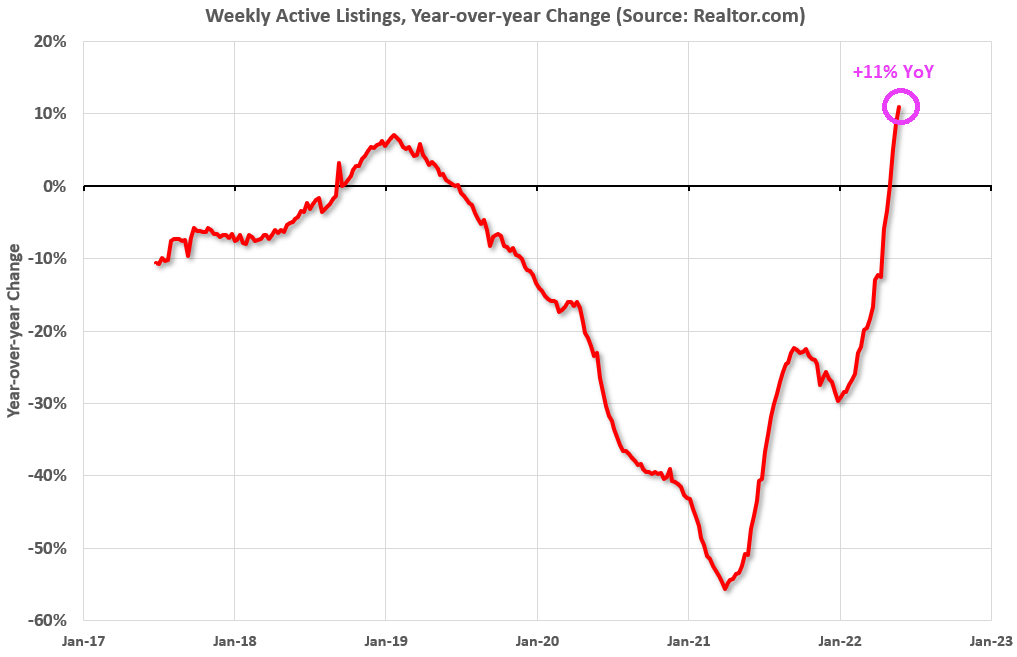
Listings of homes is up 11% YoY, the highest in several years.
Let’s see how the housing market does with soaring mortgage rates.
But let’s start with US average hourly earnings growth less inflation (aka, REAL hourly earnings). It printed at -2.8% YoY, meaning that inflation is causing REAL hourly earnings to fall.
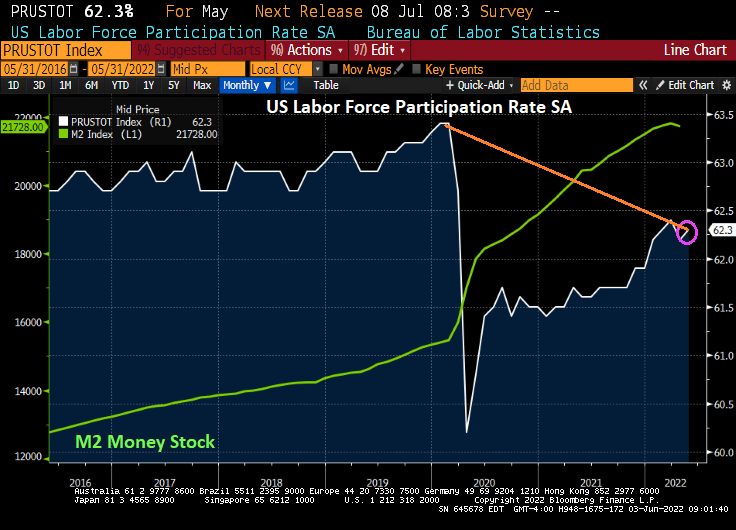
Labor force participation rose to 62.3%, but remains below pre-Covid levels.
The unemployment rate remains the same at 3.6%, but the underemployment rate rose to 7.1%.
Jobs added?
Employment in leisure and hospitality increased by 84,000 in May, as job growth continued in food services and drinking places (+46,000) and accommodation (+21,000). Employment in leisure and hospitality is down by 1.3 million, or 7.9 percent, compared with February 2020.
Employment in professional and business services rose by 75,000 in May. Within the industry, job gains occurred in accounting and bookkeeping services (+16,000), computer systems design and related services (+13,000), and scientific research and development services (+6,000). Employment in professional and business services is 821,000 higher than in February 2020.
In May, transportation and warehousing added 47,000 jobs. Employment rose in warehousing and storage (+18,000), truck transportation (+13,000), and air transportation (+6,000). Employment in transportation and warehousing is 709,000 above its February 2020 level.
Employment in construction increased by 36,000 in May, following no change in April. In May, job gains occurred in specialty trade contractors (+17,000) and heavy and civil engineering construction (+11,000). Construction employment is 40,000 higher than in February 2020.
In May, employment increased by 36,000 in state government education and by 33,000 in private education. Employment changed little in local government education (+14,000). Compared with February 2020, employment in state government education is up by 27,000, while employment in private education has essentially recovered. Employment in local government education is down by 308,000, or 3.8 percent, compared with February 2020.
Employment in health care rose by 28,000 in May, including a gain in hospitals (+16,000). Employment in health care overall is 223,000, or 1.3 percent, lower than in February 2020.
Manufacturing employment continued to trend up in May (+18,000). Job gains occurred in fabricated metal products (+7,000), wood products (+4,000), and electronic instruments (+3,000). Employment in manufacturing overall is slightly below (-17,000 or -0.1 percent) its February 2020 level.
Wholesale trade added 14,000 jobs in May, including gains in durable goods (+10,000) and electronic markets and agents and brokers (+6,000). Employment in wholesale trade is down by 41,000, or 0.7 percent, compared with February 2020.
Mining employment increased by 6,000 in May and is 80,000 higher than a recent low in February 2021.
Employment in retail trade declined by 61,000 in May but is 159,000 above its February 2020 level. Over the month, job losses occurred in general merchandise stores (-33,000), clothing and clothing accessories stores (-9,000), food and beverage stores (-8,000), building material and garden supply stores (-7,000), and health and personal care stores (-5,000).
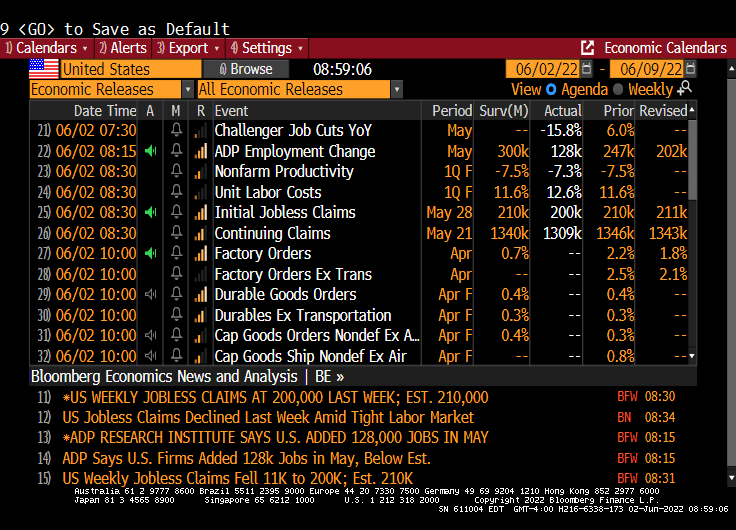
First, ADP US jobs added flopped (only 128.2k jobs added, the lowest reading under Biden and the massive Federal Reserve stimulus). Much lower than the expected 300k. Second, nonfarrm labor productivity fell in Q1 -7.3%. Third, unit labor costs soared to +12.6%.
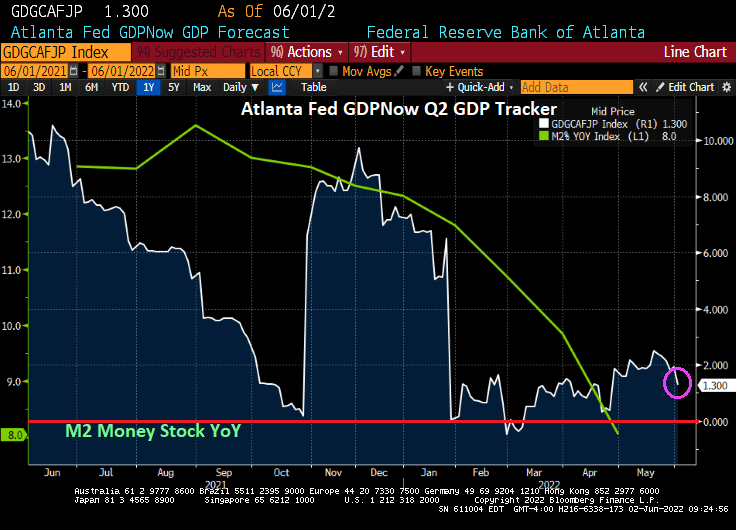
M2 Money stock YoY is falling, but remains at 8% YoY.
Here is the summary table for today.
And then we have the Atlanta Fed GDPNow, real-time GDP tracker for Q2 at 1.3%.
As M2 Money growth slows, US GDP is slowing as well. Is this a monetary hangover??
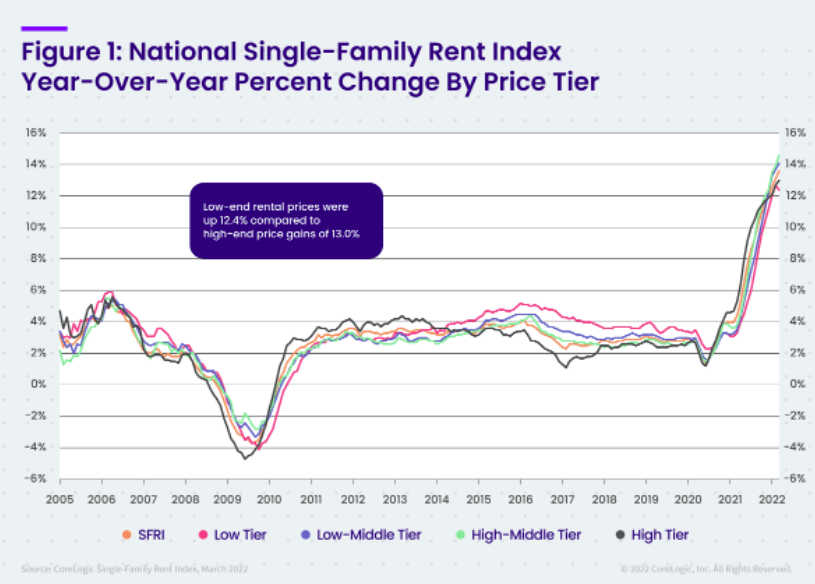
And, of course, rents are soaring for the American middle class and low wage workers.
President Biden met with Federal Reserve Chairman Powell to discuss how to control the inflation that is crushing the middle class and low-wage workers.
Here is a good example of why Biden is worried. There is a mid-term election on the horizon and people are angry and scared. Housing, generally the largest asset owned (or rented) by a household is simply unaffordable thanks, in part, to the over-stimulation of the economy by 1) The Federal Reserve in terms of money printing and 2) the Federal government in terms of fiscal stimulus in response to the Covid outbreak in March 2020.
In nominal terms, the gap between US home prices (Case-Shiller National Home Price Index YoY – US Average Hourly Earnings YoY) is near the all-time high.
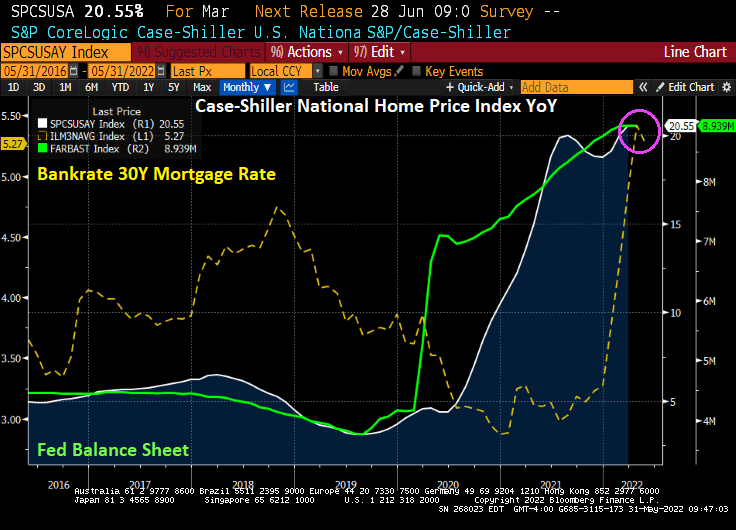
Yes, home price growth exploded upwards when The Fed rapidly expanded their balance sheet in response to the Covid outbreak … and only now are considering shrinking the balance sheet.
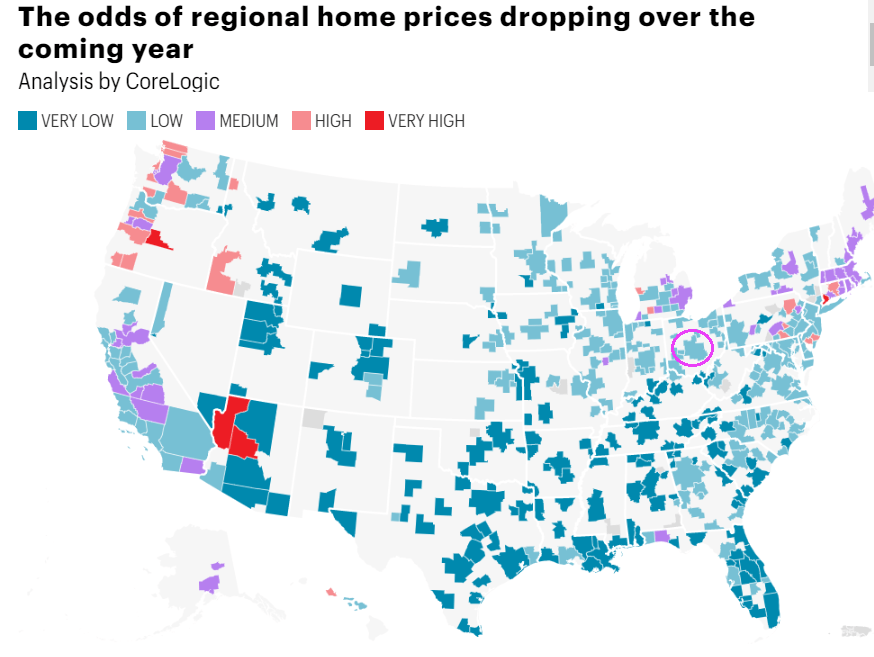
In terms of house prices, CoreLogic has a nice chart depicted the odds of home prices dropping over the coming year. I circled Columbus Ohio because that is where I am moving (knock on wood).
And then we have the 30-year mortgage rate rising with The Fed’s expected tightening of monetary policy. That will certainly make housing even less affordable, unless house price growth cools dramatically.
US gasoline prices just rose to an all-time high. Yes, even higher than the Dubya-era gasoline price surge of 2008.
Rising gasoline and diesel prices are helping drive up food prices to the highest level in history.
The proxy war the US is fighting in with Russia in Ukraine is helping drive up food prices. But at the core is Biden’s anti-fossil fuel drilling executive orders starting when Statist Joe (and The Fish) became President.
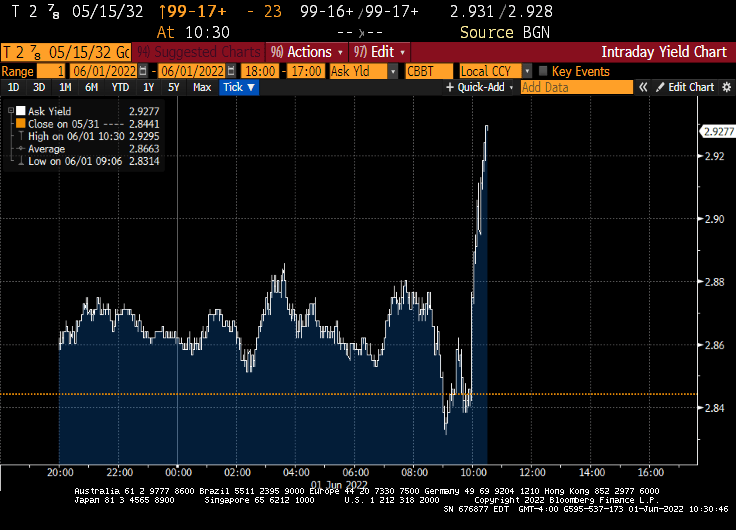
As The Fed begins unwinding their massive balance sheet, the 10-year US Treasury yield jumped 8.7 basis points.
Heartaches By The Number … for American households and mortgage lenders as The Federal Reserve begins FINALLY removing monetary stimulus.
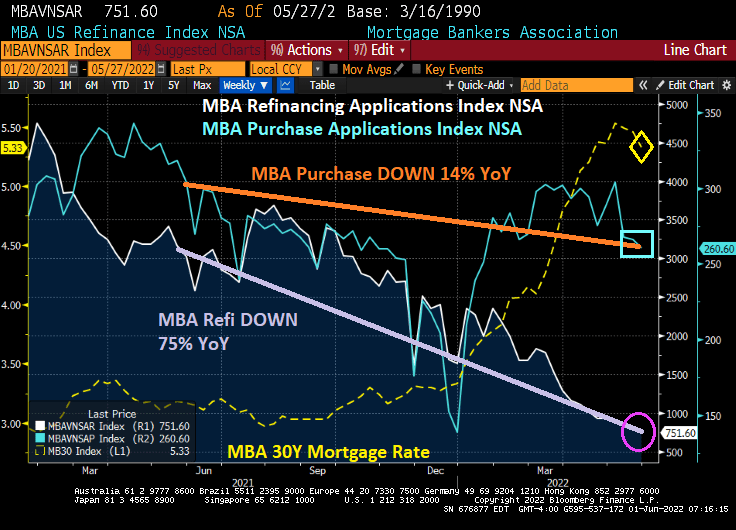
Mortgage applications decreased 2.3 percent from one week earlier, according to data from the Mortgage Bankers Association’s (MBA) Weekly Mortgage Applications Survey for the week ending May 27, 2022.
The Refinance Index decreased 5 percent from the previous week and was 75 percent lower than the same week one year ago.
The seasonally adjusted Purchase Index decreased 1 percent from one week earlier. The unadjusted Purchase Index decreased 2 percent compared with the previous week and was 14 percent lower than the same week one year ago.
Under Biden, mortgage refi applications are down -82.4%, purchase applications are down -7.5% and mortgage rates are up +80.7%.
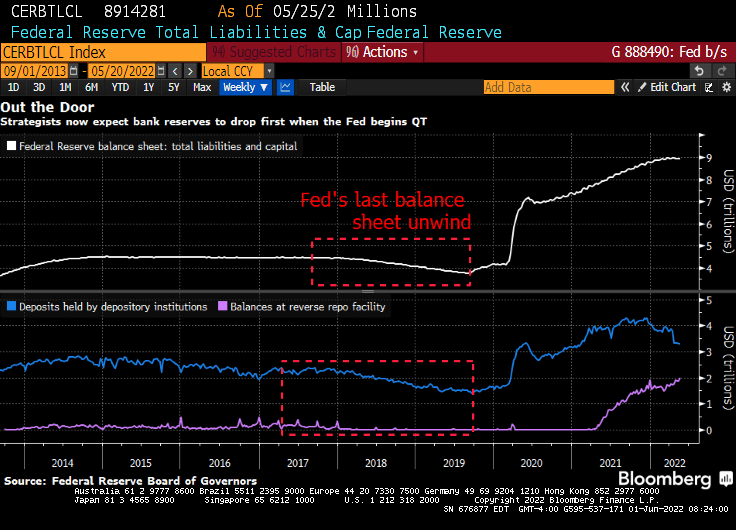
Then we have this headline: “Fed Starts Experiment of Letting $8.9 Trillion Portfolio Shrink”
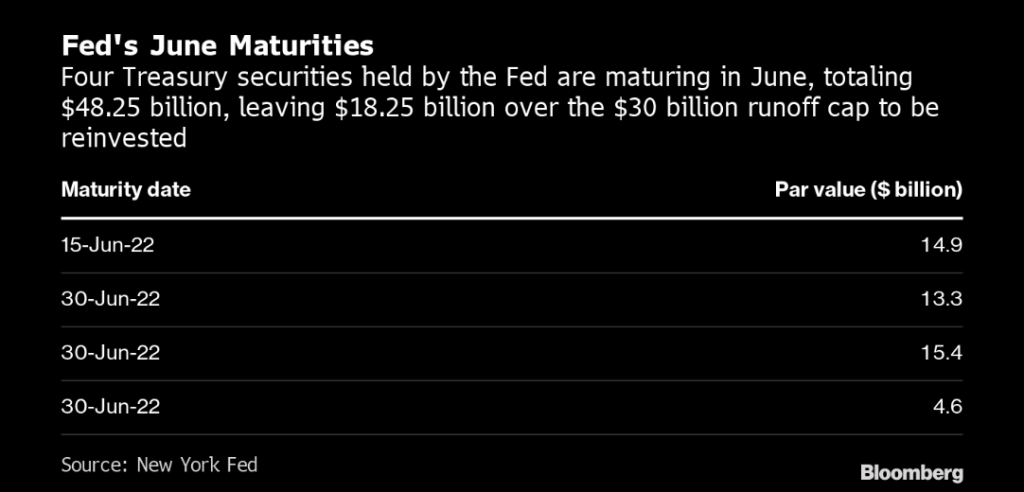
The Fed is capping monthly runoff at $47.5 billion — $30 billion for Treasuries and $17.5 billion for mortgage-backed securities — until September. Those thresholds will then double to a combined $95 billion. That compares to a peak of $50 billion a month when the Fed performed the exercise starting in 2017.
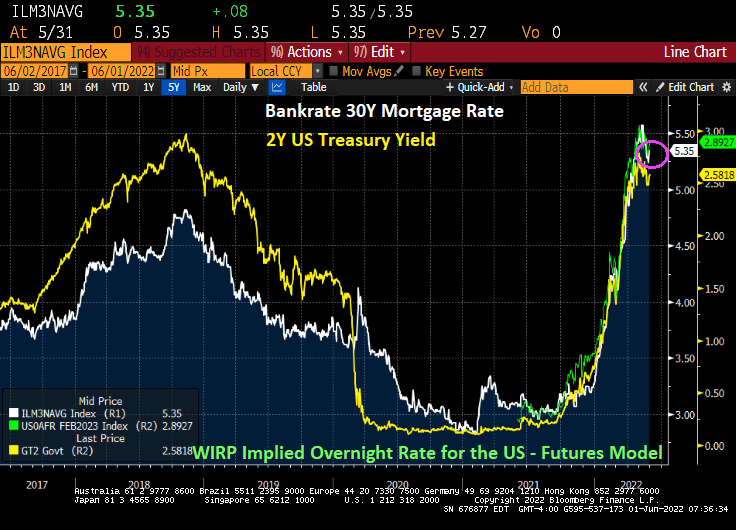
As expectation of Fed rate hikes increase, mortgage rates have soared like Tom Cruise’s Super Hornet aircraft from Top Gun: Maverick climbing over the steep mountain.
And mortgage rates are up a bit today.
Meanwhile, The Federal Reserve begins shrinking their balance sheet for the first time since Yellen and company started shrinking it under Trump.


You must be logged in to post a comment.