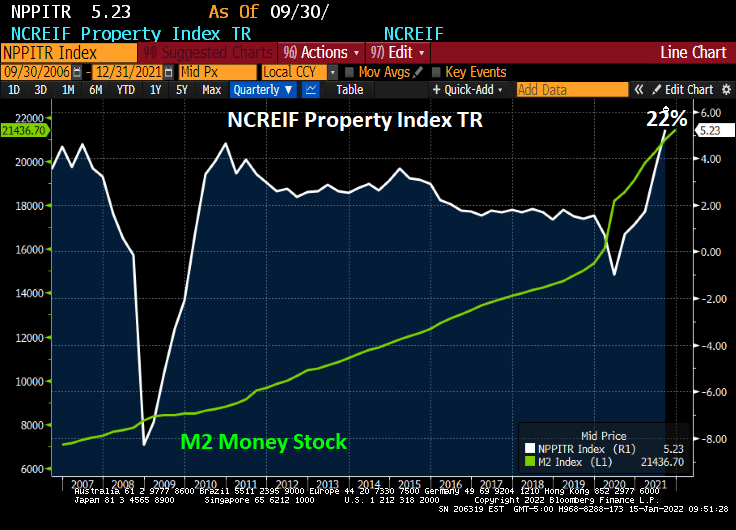
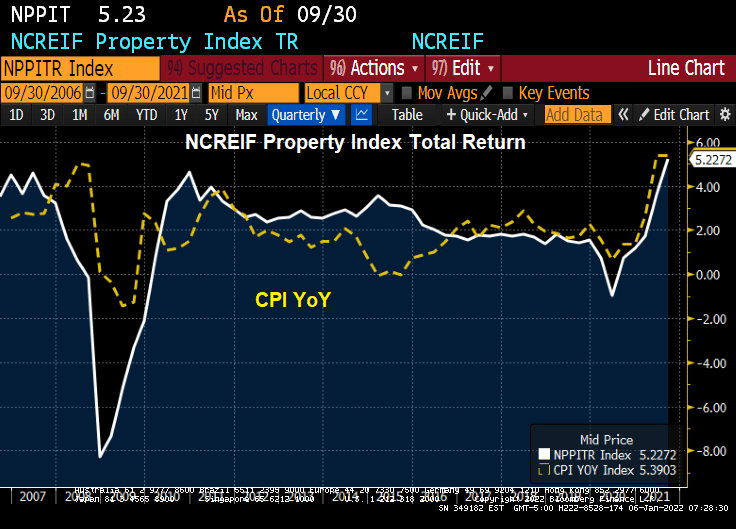
Inflation is burning out of control. While home price growth has been off the cherts (as Jean-Ralphio would say), commercial real estate has jumped incredibly at 22% YoY. The Bloomberg charting function hasn’t updated for the Q4 NCREIF report yet so I had to manually write-in 22% on the following chart.
So, what will happen IF The Fed follows through with its monetary stimulus reduction? JPMC’s Jaime Dimon warns that The Fed could hike 7 times in 2022 and not be ‘sweet and gentle’.
Ever wonder why prices are rising so fast? One reason is that with rapidly rising energy prices under the Biden Administration, the costs are getting passed-through to consumers in the form of higher prices.
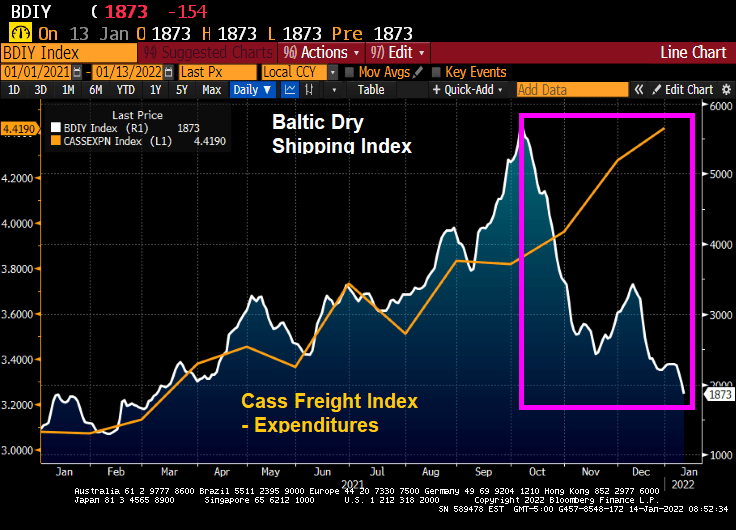
According to the Cass Corp Freight Index, the total spent in December on shipping goods to their customers in the US spiked by 43.6% from December 2020 to December 2021. Not surprising since energy prices over the past year have soared by almost 50%.
But at the same time, the Baltic Dry index (The Baltic Dry Index (BDI) is a shipping and trade index created by the London-based Baltic Exchange. It measures changes in the cost of transporting various raw materials, such as coal and steel) is crashing thanks to FEAR created by Omicron.
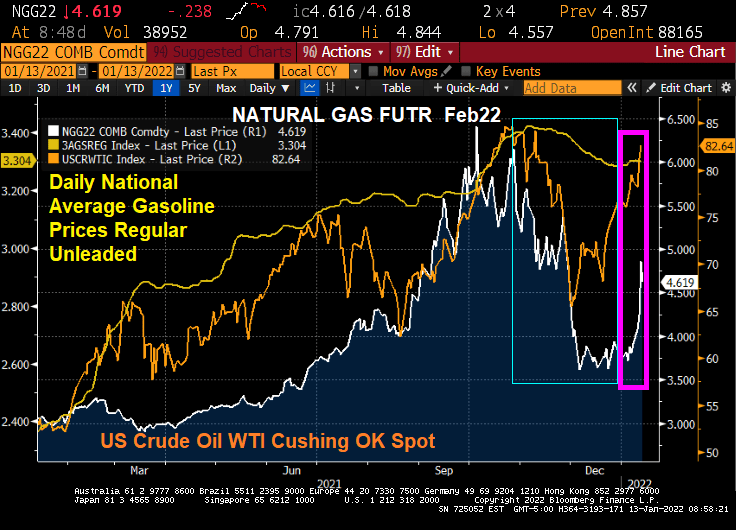
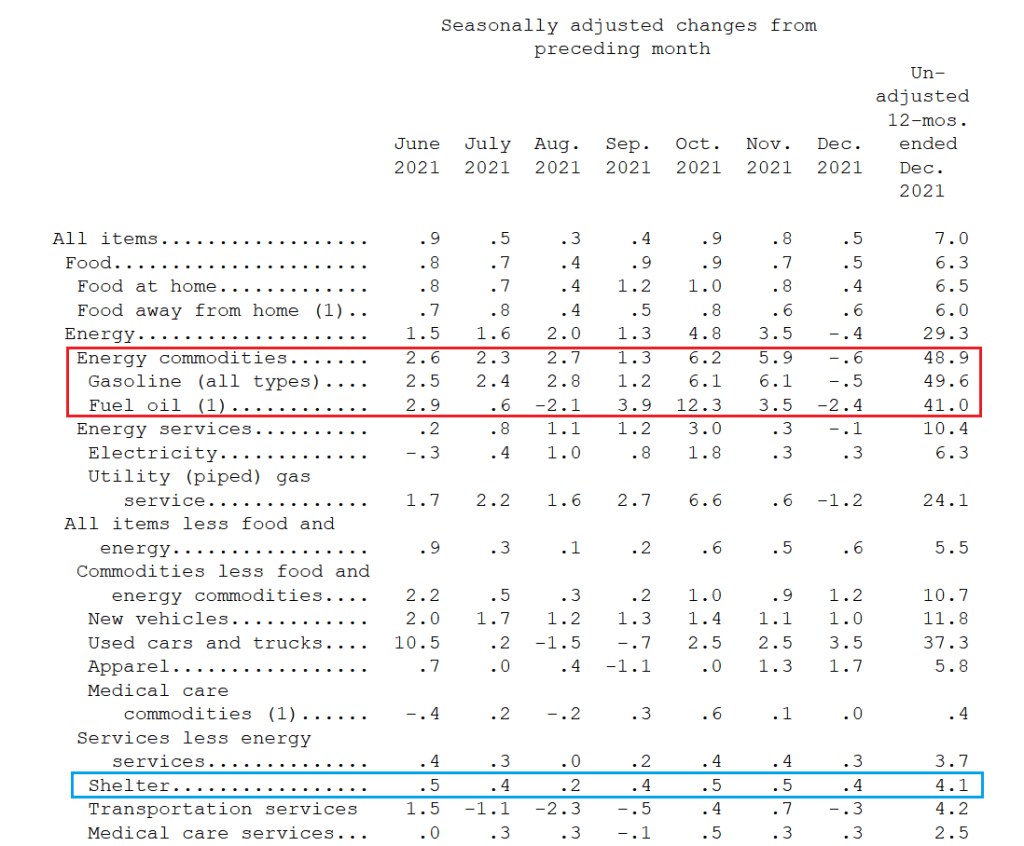
And yes, energy prices are surging again in 2022 after cooling off in Q4 2021.
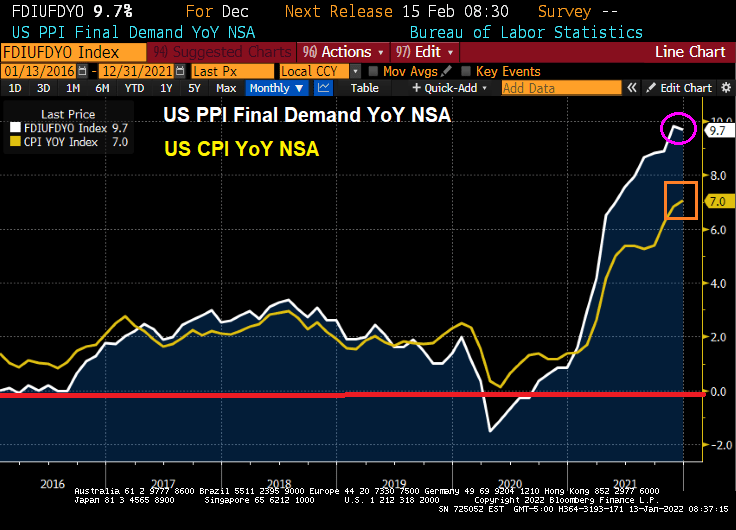
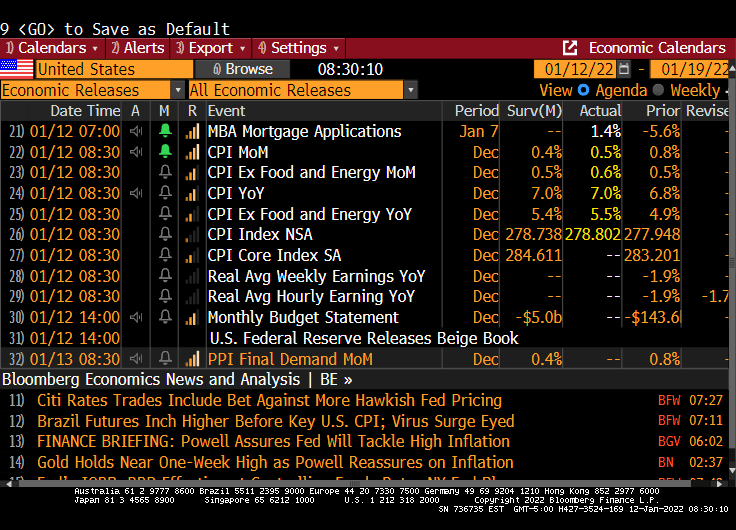
Yesterday’s inflation report was the worst in 40 years. But at least today’s Producer Price Index Final Demand is down slightly from November. But PPI Final Demand YoY is still roaring at 9.7%.
The producer price index for final demand increased 0.2% from the prior month and 9.7% from a year earlier, Labor Department data showed Thursday. The annual advance was the largest in figures back to 2010.
Excluding the volatile food and energy components, the PPI climbed 0.5% in December and was up 8.3% from a year earlier.
Too much Federal government spending, too much Fed monetary stimulus, Omicron helping created labor shortages, etc. But the real killer has been ENERGY prices. Note that natural gas, gasoline and WTI crude oil were falling in November/December helping to slow PPI growth by a smidge. BUT energy prices are skyrocketing in January. So … look for higher PPI in January.
Here is the painting by Thomas Hart Benton that drove “Brokeback Biden” to try to destroy fossil fuel production. Or at least this is Washington DC’s idea of what Oklahoma and Texas are like.
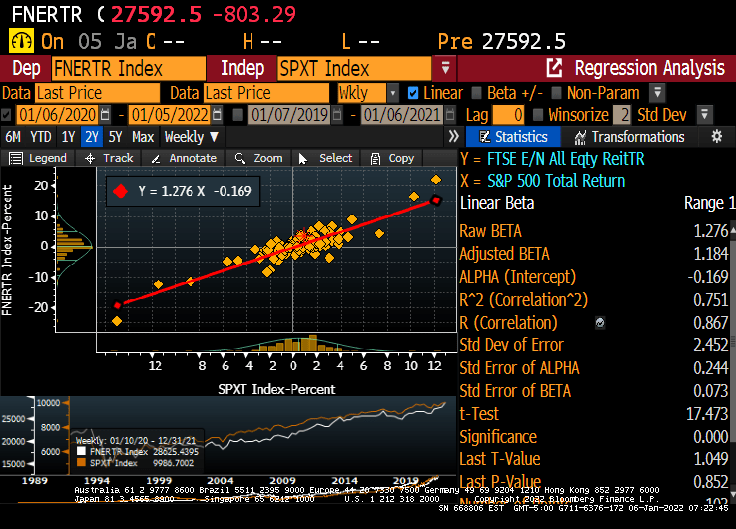
How about real estate investment trusts? The NAREIT all-equity index rose by 35.6% YoY while inflation rose at 6.8%. The S&P 500 index rose 28.9% YoY.
Of course, the NAREIT all-equity index has a beta of 1.276.
How about the NCREIF All-property commercial real estate index? For Q3, the NCREIF property index rose by 5.22%, less than the most recent inflation reading of 6.8%.
So for the past year, housing has beaten the pants-off inflation, REITs have earned a higher return than inflation, and the NCREIF index seems to be rising slower than inflation (but with its lag problems, I anxiously await the Q4 numbers which should be higher.
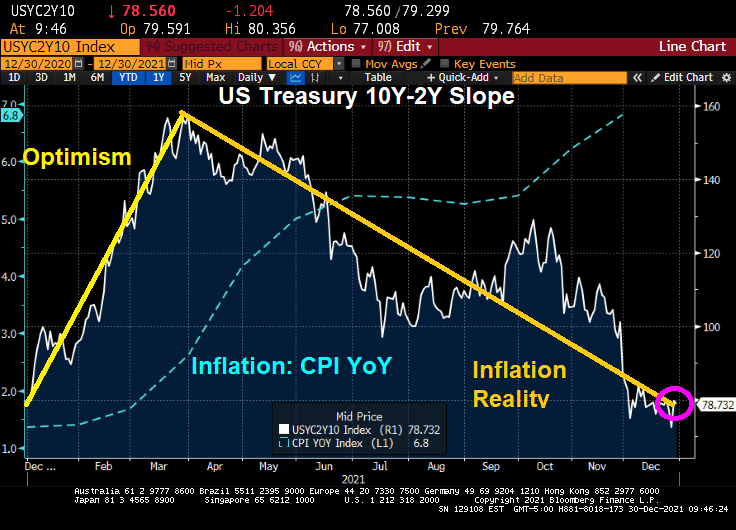
It has been almost a year since Joe Biden has been President of the United States and a Democrat majority took control of The House and Senate. And what has happened to the US Treasury yield curve slope over the past year?
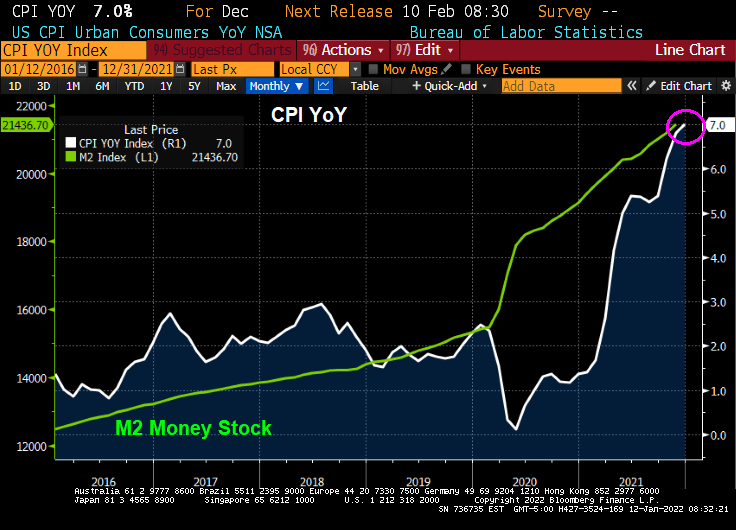
The yield curve is back where it started. There was the “honeymoon effect” where the curve slope rose. After all, Biden was Obama’s Vice President for 8 years and The Democrats has promised so much in the 2020 election. But by early April, the reality of the massive Federal spending (combined with Fed Stimulypto) began showing what was feared: inflation (blue line) started to grow at a rapid rate of speed. With inflation now at 6.8% YoY,
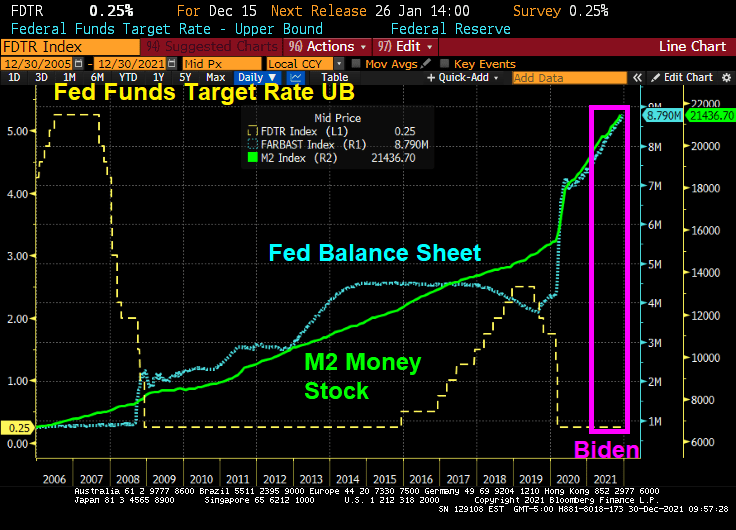
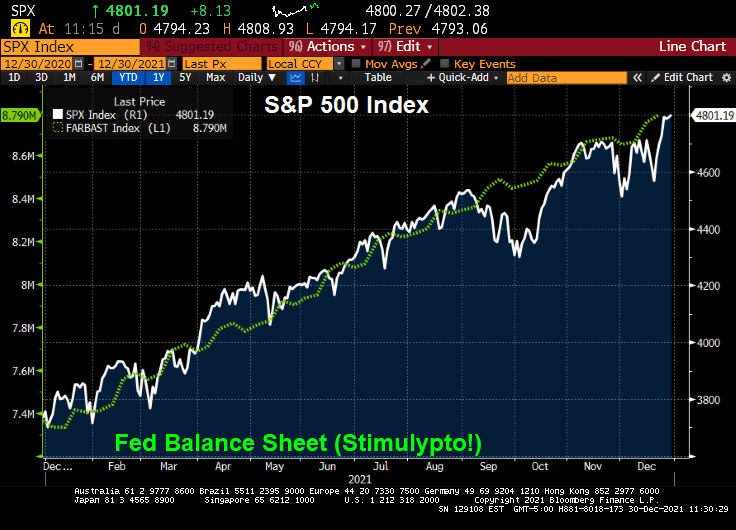
In fairness to Biden, The Federal Reserve has been overstimulating the economy since The Federal Reserve since Ben Bernanke and the Fed Open Market Committee (FOMC) dropped the hammer on The Fed Funds Target Rate once the rate hit 5.25% in September 2007. They kept cutting it reached 25 basis points (or 0.25%) in December 2008. In August 2008, Bernanke and Company began their “Quantitative Easing” or asset purchasing programs. Between The Fed’s Target Rate and QE, The Fed has continued to overstimulate markets ever since. Under Biden, The Fed Funds Target Rate remains at 0.25% and The Fed’s Balance sheet has grown to $8.79 Trillion (bigger than the entire economies of Japan and Germany put together!).
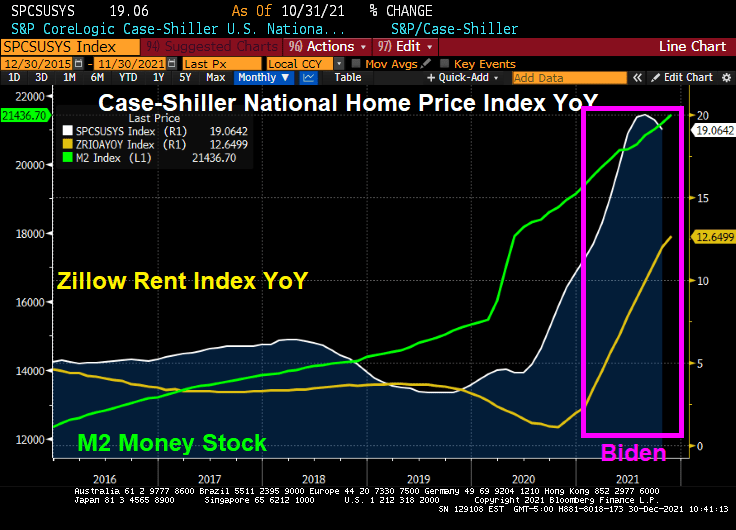
How about housing? Home prices are growing at 19% YoY while rents are growing at 12.65% YoY.
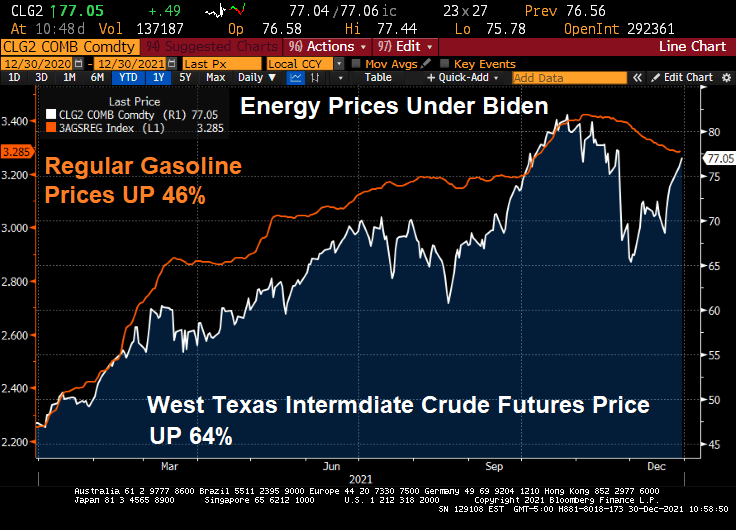
Energy prices have risen dramatically under Biden. Gasoline is up 46% despite a slight reprieve recently. WTI crude prices are up 64%.
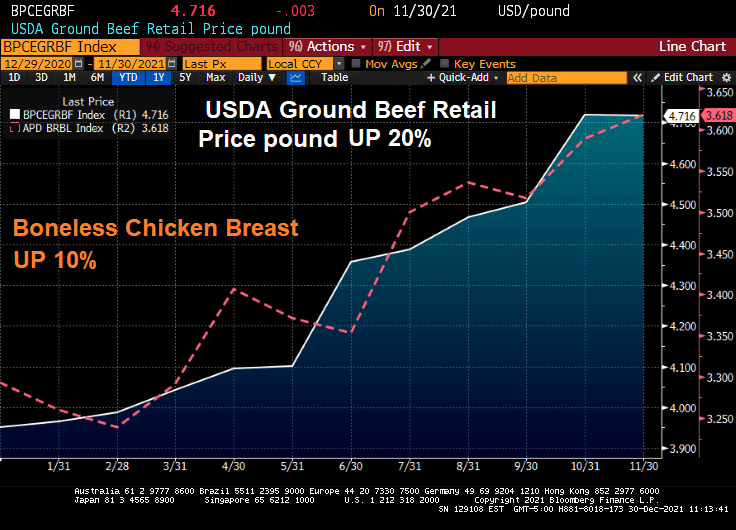
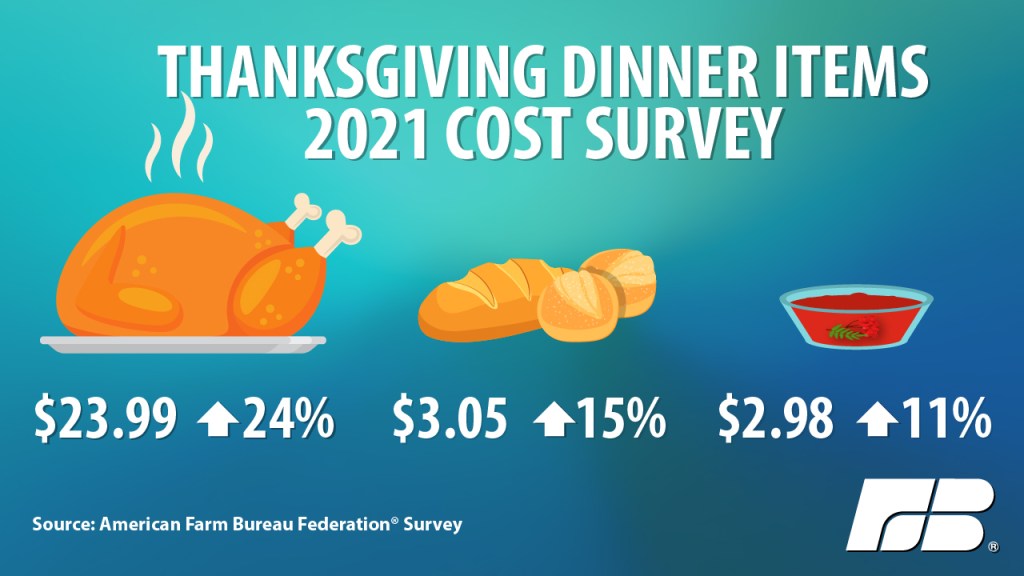
How about food? Beef prices are up 20% and chicken prices are up 10%.
On a positive note, the S&P 500 index has soared … thanks has soared during Biden’s term thanks to Fed stimulus and Federal spending on COVID.
The Build Back Better Act if passed (in its entirety or on a piecemeal basis) will lead to even MORE inflation.
Perhaps Biden’s spokesperson Jen Psaki can recreate the Biden Administration as a lovable, hilarious family like the comic strip Gasoline Alley with old Joe Biden as Skeezix. And insider-trading star, House Speaker Nancy Pelosi as the family matriarch.
I love listening to Fed talking heads (or Fear The Talking Fed). They mostly seem to acknowledge that inflation is a problem and that the excessive monetary stimulus should be reduced.
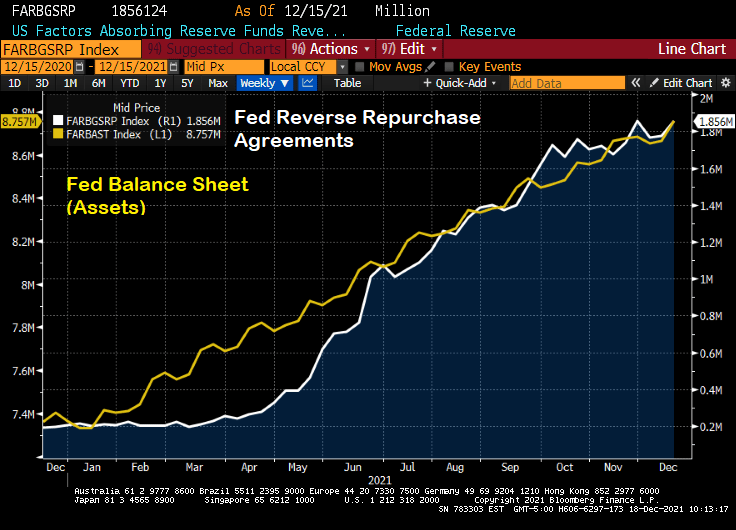
But then I see the chart of The Fed’s balance sheet and The Fed’s reverse repo operations.
Then we have Federal Reserve Governor Christopher Waller saying that Th Fed could start raising interest rates as early as its March 15-16 meeting, after deciding to end asset purchases sooner than planned. My question is … why wait until the March meeting?
Is it fear of the Omincron Variant (which sounds like a Frederick Forsyth thriller)? Does The Fed not want to rock the boat prior to the Christmas season? The US is at or near full employment, so what is the real reason for delaying a rate increase until March or June? Or the fear that Congress won’t pass Biden’s Build Back Better Act?
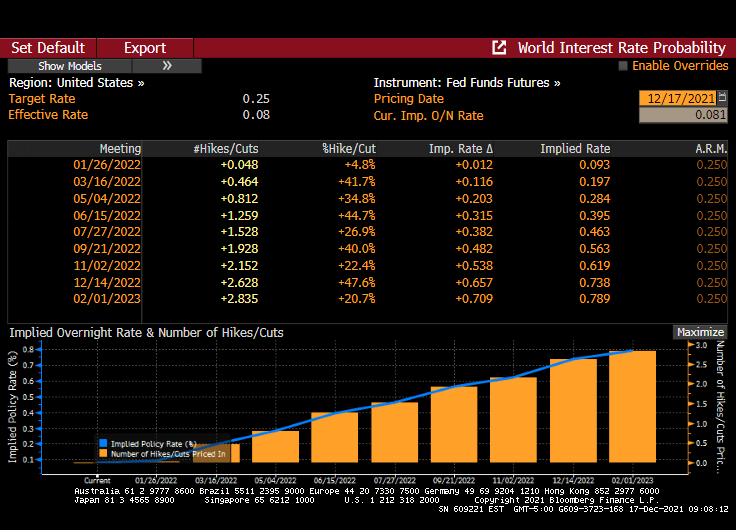
Fed Funds Futures infer that one rate hike will occur at the June Fed Open Market Committee (FOMC) meeting and one at the November meeting.
“The Congressional Budget Office and the staff of the Joint Committee on Taxation project that a version of the bill modified as you have specified would increase the deficit by $3.0 trillion over the 2022–2031 period.”
The Penn-Wharton Budget Model estimates that — if Congress follows White House policy to make most provisions permanent — then Build Back Better will reduce the long-term GDP by 2.8 percent, reduce wages by 1.5 percent, and reduce work hours by 1.3 percent. The only thing it will expand is government debt, by 25 percent.
Calamity Jay Powell testified in front of the US Senate Banking Committee. He rattled markets by going hawkish about inflation, then gave The Fed an out by playing the COVID CARD (the latest Omicron Variant). Aka, the DEATH CARD.
Federal Reserve Chair Jerome Powell said the strong U.S. economy and elevated inflation could warrant ending the central bank’s asset purchases sooner than planned next year, though the new omicron strain of Covid-19 poses a fresh risk to the outlook.
“It is appropriate, I think, for us to discuss at out next meeting, which is in a couple of weeks, whether it will be appropriate to wrap up our purchases a few months earlier,” Powell said Tuesday. “In those two weeks we are going to get more data and learn more about the new variant.”
Powell made the comment in response to questions during a Senate Banking Committee hearing in Washington. The Fed is currently scheduled to complete its asset-purchase program in mid-2022 under a plan announced at the start of November; policy makers next meet Dec. 14-15, where they could make a decision to accelerate the tapering.
On his remarks, the stock market puked.
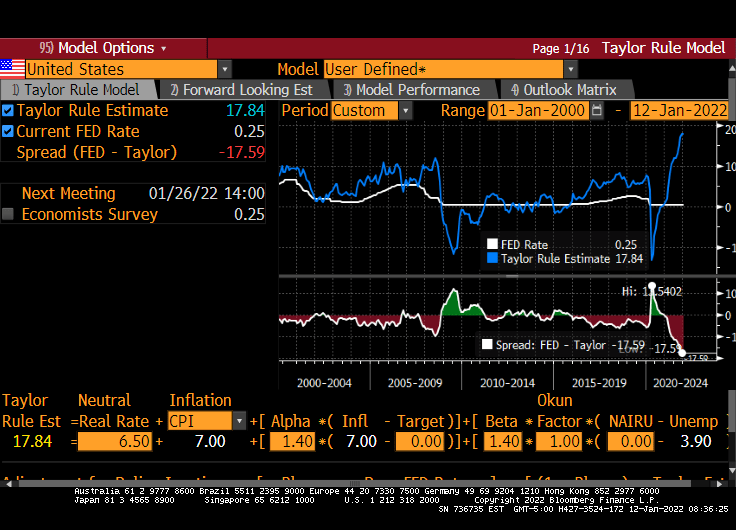
Well, if Powell followed the Taylor Rule, he would really scare Congress with raising The Fed Funds Target Rate to 14.94% based on an inflation rate of 6.20%.
And then we have HOUSE price inflation of near 20%. But The Fed doesn’t consider than inflation.
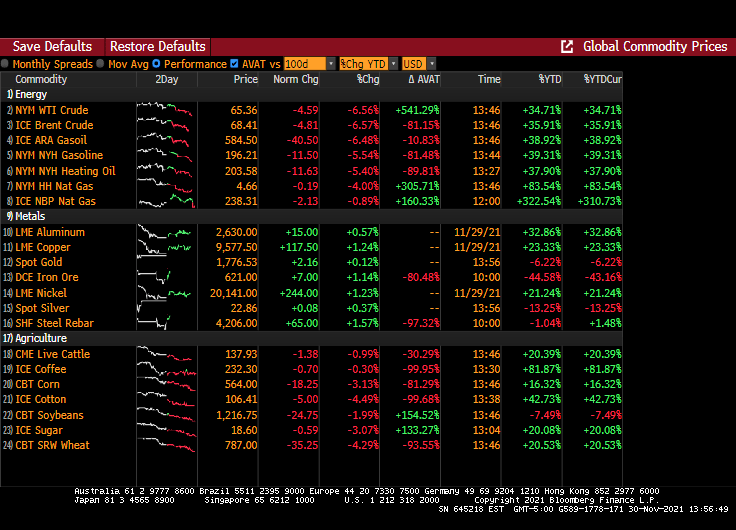
Then we have oil prices retreating -4.59%. Not, not due to Biden releasing the National Petroleum Reserve (NPR). Rather it is FEAR of The Fed raising rates and a corresponding slowdown in economic growth.
Gut-wrenching inflation is already priced in, but yet another COVID outbreak (and the possibility of more economic shutdowns, more vax mandates and more stern lectures from Anthony Fauci) are spooking markets.
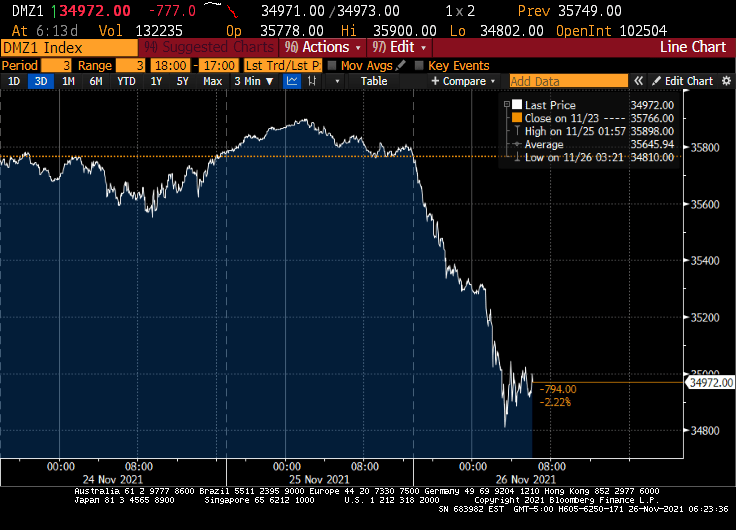
Down Futures are down 777 as I write this note.
The 10-year Treasury yield is down 11.2 basis points.
And West Texas Intermediate crude prices are down 6.62%.


You must be logged in to post a comment.