Hey, I thought the vaccine mandates and masks were supposed to stop COVID and its mutations in its tracks!
Instead, Omicron has taken a much bigger bite out of the labor market than expected, data from payroll processing firm ADP indicated Wednesday.
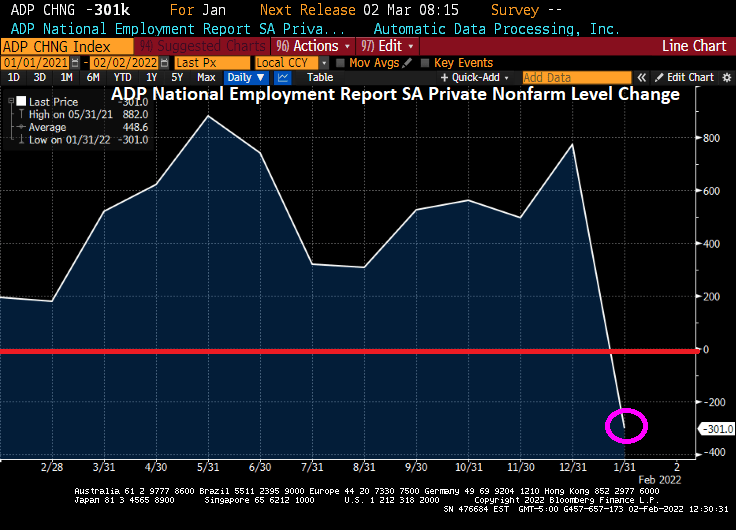
The number of workers on private payrolls fell by 301,000 in January, falling far short of expectations for growth of 225,000 jobs.
This was the first decline in payrolls reported by ADP since 2020.
The leisure and hospitality sector shed 154,000 jobs. Trade, transportation, and utilities dropped 62,000 workers. Other services saw payrolls decline by 23,000. Health and education jobs fell by 15,000. Information technology jobs fell by 8,000 and financial services sank by 9,000.
Manufacturers cut 21,000 positions. Construction declined by 10,000. Mining and natural resources added 4,000.
All told, the services sector’s payrolls fell by 274,000 and the goods-producing sector’s payrolls dropped by 27,000.
The Department of Labor will report the official count for January jobs on Friday. It is expected to show that jobs grew by around 170,000 but that may be an underestimate of the impact of omicron.
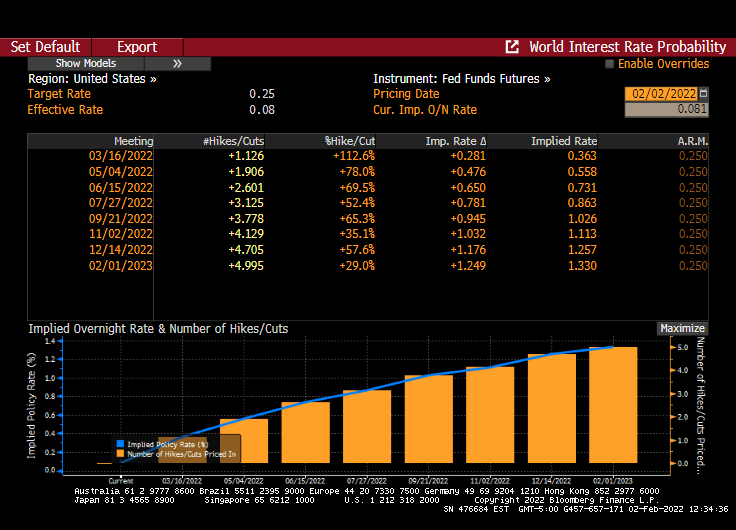
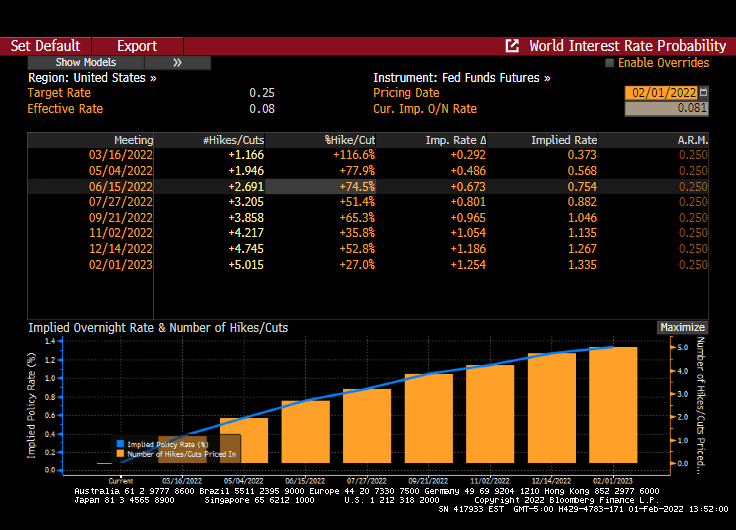
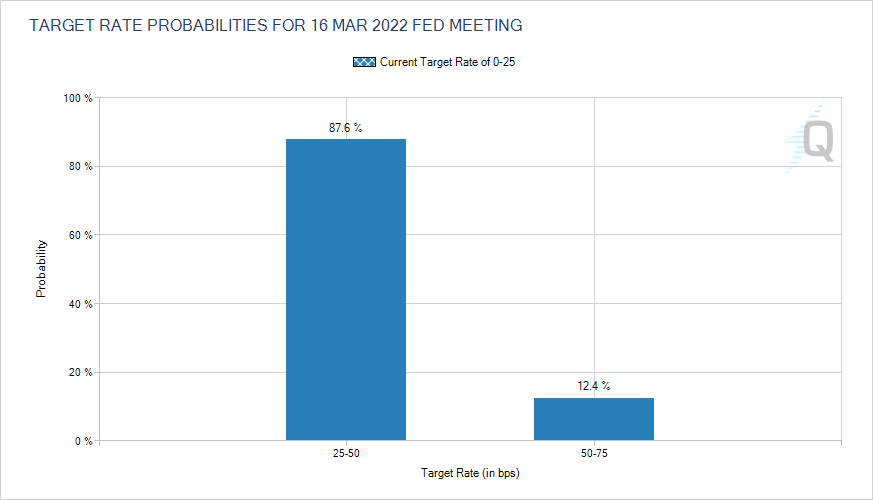
Since Omicron can be readily blamed for ADP report, it doesn’t look like it has affected the implied probability of 5 rate hikes over the next year.
(Bloomberg) — The White House is lowering expectations for this week’s U.S. jobs report, saying that brief absences of workers due to omicron could overstate the number of unemployed people for last month.
Several White House officials have teed up Friday’s report with warnings, saying that the week when surveys were taken for the January payroll numbers was the height of illness absences in the aftermath of the holidays.
Brian Deese, the director of President Joe Biden’s National Economic Council, said the numbers could be “confusing” as Covid illnesses are recorded as job losses.
“We expect that that will have an impact on the numbers,” Deese told MSNBC on Tuesday. “We never put too much weight on any individual month; this will particularly be true in this month, because of the likely effect of the short-term absences from omicron.”
Biden has repeatedly touted employment data as an indicator of a robust economic rebound, and highlighted the tumbling jobless rate to blunt criticisms about overheated inflation. Friday’s report may still show historically low unemployment, which is based on a separate survey from the one for payrolls and counts temporary, unpaid sick leave differently.
LaborSecretary Marty Walsh and White House Press Secretary Jen Psaki have also delivered warnings that the official January jobs gain may be poor.
If a worker was out “and did not receive paid leave, they are counted as having lost their job,” Psaki said Monday. Nearly 9 million people missed work due to illness in January, when the data were being collected, she said.
“So we just wanted to kind of prepare, you know, people to understand how the data is taken,” she said. “As a result, the month’s jobs report may show job losses in large part because workers were out sick from omicron.”
Economists expect nonfarm payrolls to rise by 150,000 for January — the weakest reading since the end of 2020. The U.S. unemployment rate is seen remaining unchanged, at 3.9%, according to the median estimate of forecasts compiled by Bloomberg.
So, are Dreese and Psaki saying that US GDP will roar back … from 0.1% … if Omicron fades away? And that all the fiscal and monetary stimulypto are going to cease creating problems??
Despite the fear of Omicron in the upcoming jobs report, there are still 5 rate hikes on the horizon to combat inflation … created by the Biden Administration and Federal Reserve as they combated COVID with massive fiscal and monetary stimulus.
But don’t worry, the Biden Administration ordered rapid test kits from China … and they have arrived!
Yes, its a cold one out there. But the Biden Administration is engaging in reducing fossil fuel supply and pushing towards “green” energy such as inefficient solar panels, eagle-killing wind turbines, and ocean turbines.
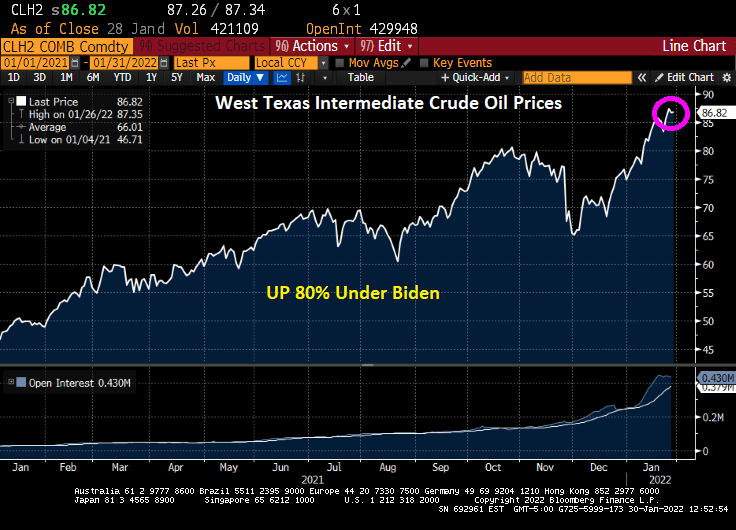
As a consequence, natural gas futures are up 93% from January 1, 2021 while coal futures are up 133% and WTI Crude spot price is up 82%.
Any wonder why food prices are up 40%?
Stay warm. It’s a cold one out there today. And The Federal government doesn’t care.
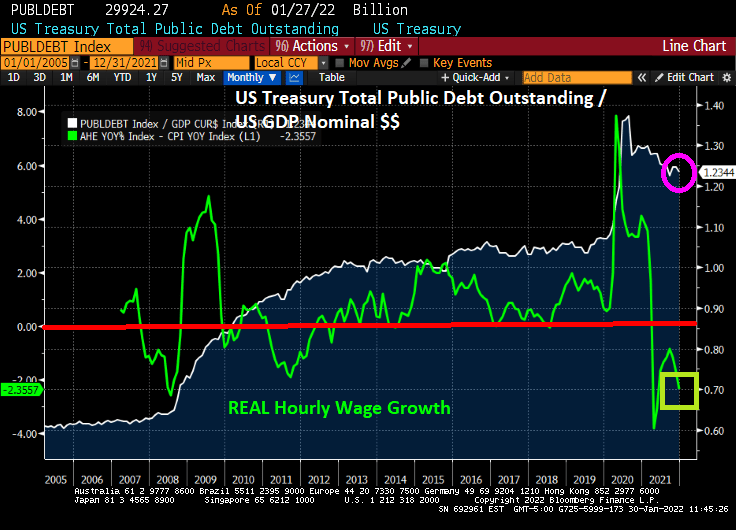
Nothing has been the same since the financial crisis of 2008 (except we still have insider-trading superstar Nancy Pelosi as US House Speaker). What has changed is that US Public Debt to GDP (nominal dollars) has doubled.
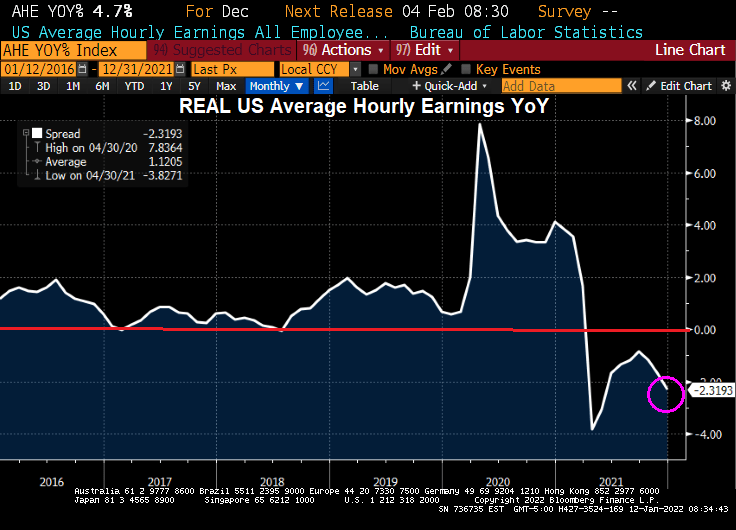
Has doubling Federal debt helped the hourly worker? Initially we saw a surge in REAL hourly wage growth in 2009 as the US began to recover from the housing bubble burst and ensuing financial crisis. Another surge in REAL wage growth occurred when Federal debt exploded as the COVID crisis took hold. BUT more recently we see that REAL wage growth is negative.
The other aspect of pain for hourly workers is inflation which has reached 7%, the highest rate in 40 years.
Adding to the frustration of hourly workers is energy prices rising 80% under President Biden’s reign of error.
Most hourly wage earners can’t buy a Tesla or a $100,000 electric Chevy Silverado to take advantage of Biden’s green energy policies.
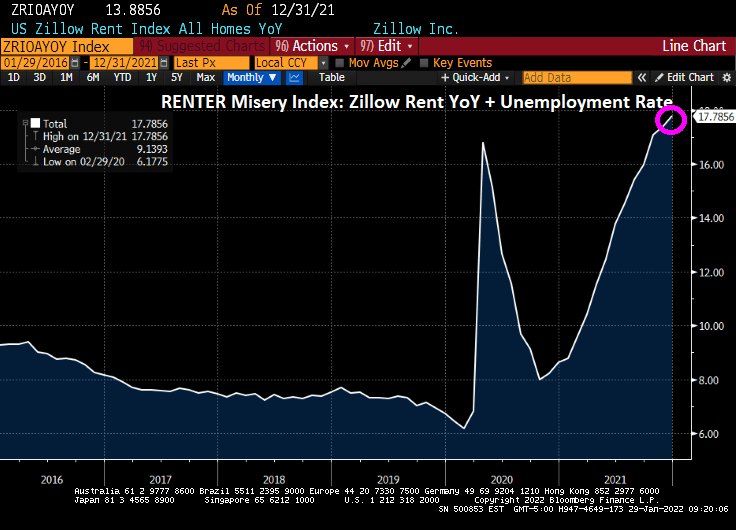
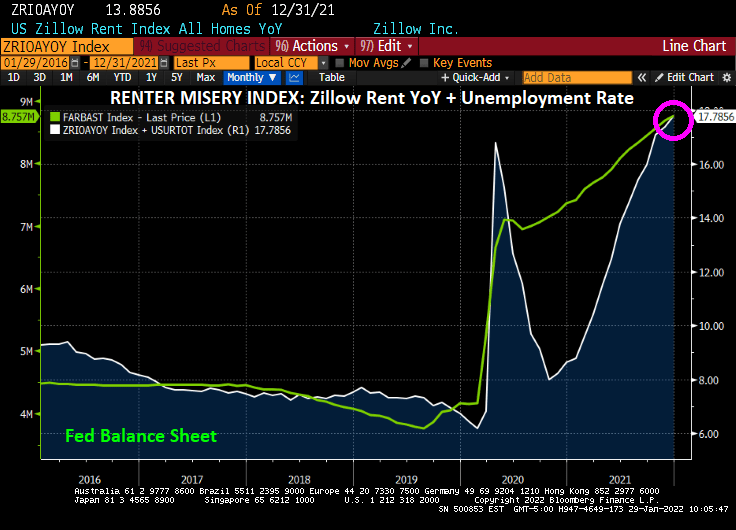
The misery index is traditionally inflation rate plus U-3 unemployment rate. The RENTER misery index is the Zillow Rent Index YoY + U-3 unemployment rate to demonstrate the hardship of renters because of soaring home prices.
Notice that because of rising home prices, the Renter misery index has overwhelmed the improvement in unemployment.
As I typically do, I will now include The Fed’s balance sheet (as a proxy for Fed stimulus and supporting Federal government expenditures). Yes, you can see that The Fed and Federal government are responsible for our modern day “Grapes of Wrath.”
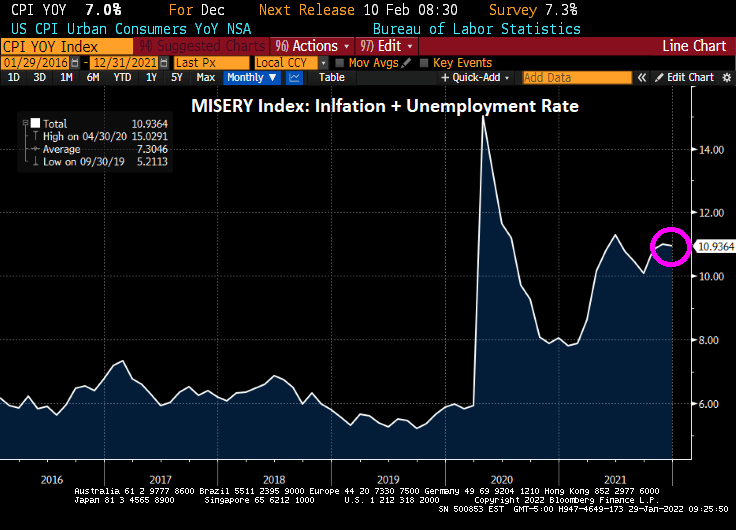
If we look at the TRADITIONAL misery index, we see that misery remains above 10 (it was below 6 prior to the COVID outbreak in early 2020).
Remember that the REAL average hourly earning growth of Americans is NEGATIVE. Gains in wage growth more than offset by inflation.
I won’t even mention how inflation is crushing retirees since Social Security and pension plans rarely adequately compensate retirees for inflation.
Now for the really bad news. 81-year old senior, House Speaker Nancy Pelosi, has announced that she is running for Congress yet again from leftist-stronghold San Francisco. Although she has an expensive home in Georgetown and a beautiful vineyard in Napa Valley. Pelosi’s vineyard only sells grapes to other wine makers. Not bad for a career civil servant!
I really wanted Pelosi to produce a wine called “The Grapes of Wrath” in honor of her insider trading and massive wasteful spending of taxpayer money that has helped generate inflation, rampant government debt growth and hurting retirees and hourly workers.
Here is a lesson in Bidenomics. “Going Green” sounds great to some (like Al Gore, Leonardo DiCaprio and Greta Thunberg), but there are costs to not growing America’s energy supply.
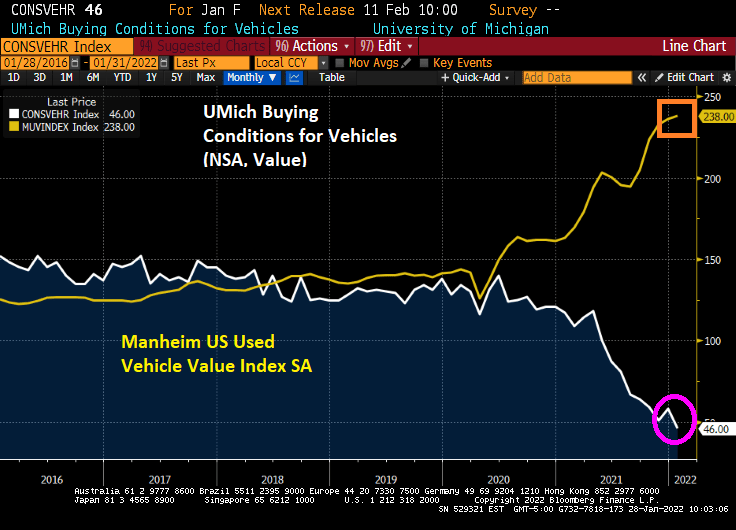
Rising energy costs have helped create the rise in consumer prices and inflation. Not to mention chip shortages for car and trucks. The University of Michigan conditions for vehicles plummeted to 46 (100 baseline) as used vehicles prices sky rocket.
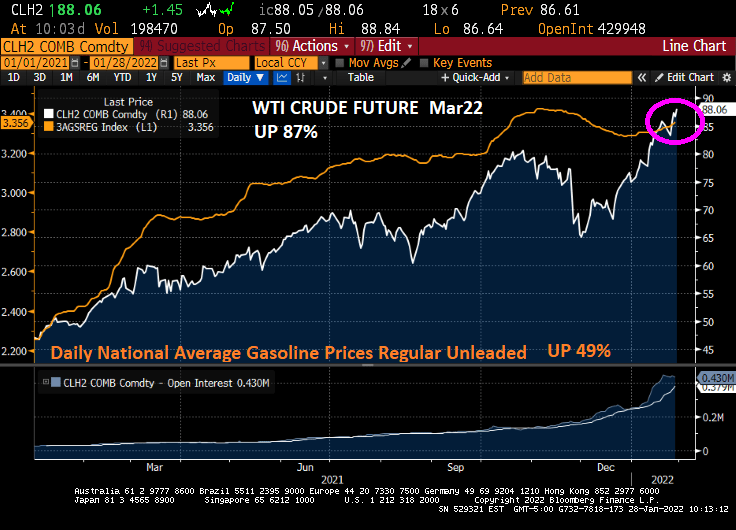
Under Biden’s reign of error, West Texas Crude futures prices have risen 87% (regular gas prices are up 49% even with Biden’s releasing two days of supply from the Strategic Petroleum Reserve.
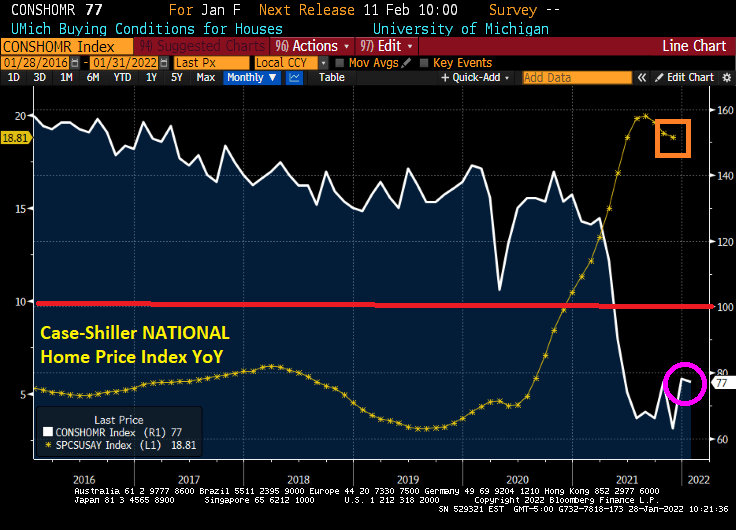
On the housing front, the University of Michigan buying conditions for houses fell to 72 (baseline of 100) as home prices are roaring at a 18.81% YoY clip.
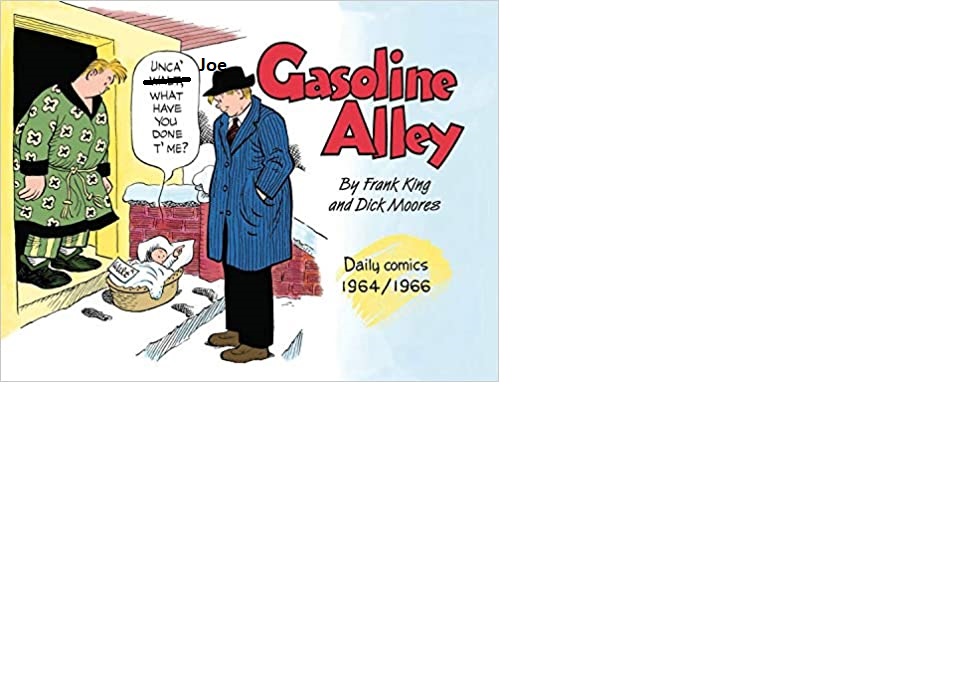
To paraphrase the comic strip “Gasoline Alley,” “Unca’ Joe, what have your done t’ US?”
This is a case of “Too much money” in the economy, courtesy of The Federal Reserve.
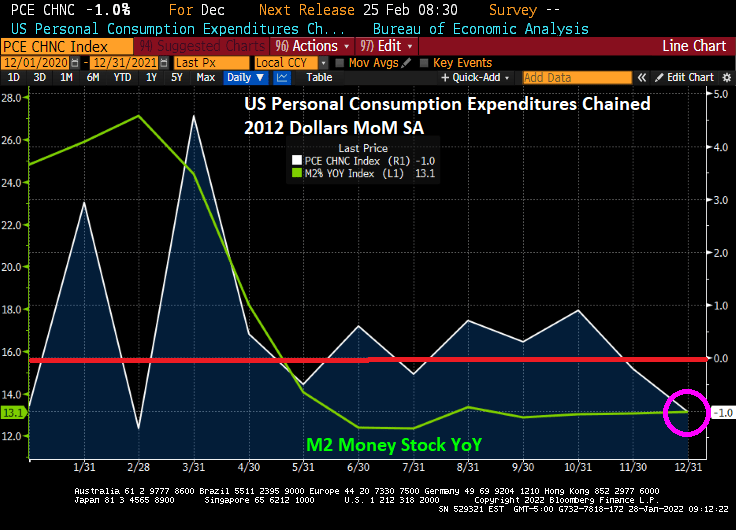
(Bloomberg) — U.S. inflation-adjusted consumer spending fell last month by the most since February, suggesting that Americans tempered their outlays amid the latest Covid-19 wave and the fastest inflation in nearly 40 years.
Purchases of goods and services, adjusted for changes in prices, decreased 1% from November, the Commerce Department said Friday.
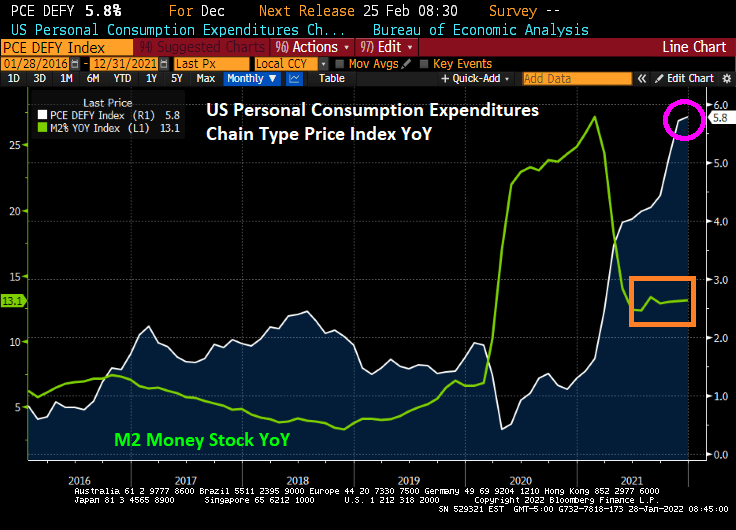
The personal consumption expenditures price gauge, which the Federal Reserve uses for its inflation target, rose 0.4% from a month earlier and 5.8% from December 2020, the most since 1982. Unadjusted for inflation, spending fell 0.6%, while incomes rose 0.3%.
Yes, the PCE Deflator YoY rose to 5.8% as M2 Money Stock is growing at a 13.1% YoY clip.
REAL personal spending declined 1% in December as prices rose in part thanks to the 13.1% growth in M2 Money stock YoY.
Too much money! Time to slow down, Jay Powell! Stop sucking the life out people with inflation.
Interest rate hikes from the U.S. Federal Reserve and other central banks are likely to worsen a global debt crisis, particularly for developing countries, according to a new report from U.K. non-profit the Jubilee Debt Campaign.
In a report published Sunday, the Jubilee Debt Campaign highlighted that developing countries’ debt payments rose 120% between 2010 and 2021, and are currently at their highest since 2001. The average portion of government revenues channeled toward external debt payments increased from 6.8% in 2010 to 14.3% in 2021, with payments shooting up in 2020.
The sharp increase in debt payments is hindering countries’ economic recovery from the pandemic, the report suggested, and rising U.S. and global interest rates in 2022 could exacerbate the problem for many lower income countries.
Kristalina Georgieva, managing director of the International Monetary Fund, said last week that Fed rate hikes could “throw cold water” on already weak recoveries in certain countries. Higher U.S. interest rates, and thus a rise in the greenback, could make it more expensive for countries to meet their dollar-denominated debt obligations.
“The debt crisis continues to engulf lower income countries, with no end in sight unless there is urgent action on debt relief,” said Heidi Chow, executive director of the Jubilee Debt Campaign.
“The debt crisis has already stripped countries of the resources needed to tackle the climate emergency and the continued disruption from Covid, while rising interest rates threaten to sink countries in even more debt.”
Chow called on G-20 leaders to stop “burying their heads in the sand” and argued that the global economy urgently needs a “comprehensive debt cancellation scheme which compels private lenders to take part in debt relief.”
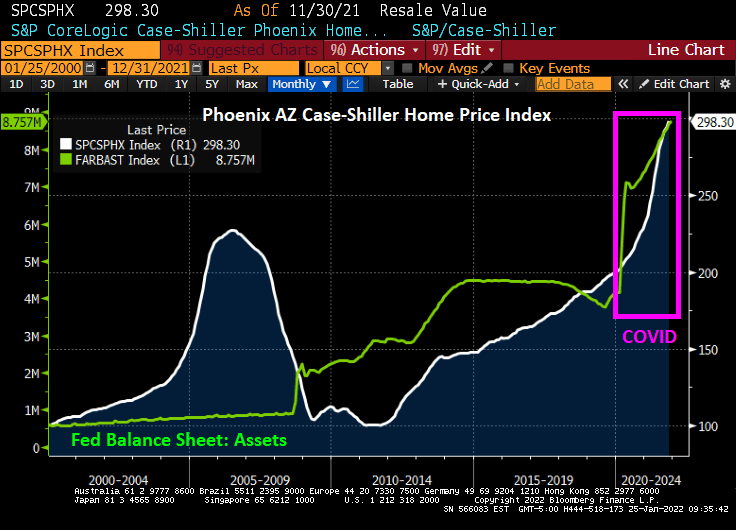
The Case-Shiller National home price index “slowed” to 18.81% YoY in November as The Fed continues its monetary stimulypto. Notice that The Fed is easing even when there is limited inventory available. Result? Hideous home price inflation.
Which metro area is growing the fastest, making housing even more unaffordable for renters? Phoenix AZ is growing at a 32.2% YoY clip while Washington DC is the slowest growing metro area at 11.1% YoY. The second faster growing metro area in Tampa FLA.
Phoenix AZ is growing at the fastest rate in the nation as The Fed still has its monetary stimulus at FULL SPEED AHEAD.
Is this the bubble burst many were expecting once The Federal Reserve starting raising rates?
Well, if today’s market opening is an indication, the answer is yes. The NASDAQ Composite Index is down 1.36% and West Texas Intermediate Crude Oil futures prices are down 2%.
The S&P 500 index is down over 10% since January 3rd.
Drawdown is taking place.
But if you think the US equities are deflating, look at European equities. The Euro Stoxx 50 index is down 4.04%.


You must be logged in to post a comment.