World’s New Supply Trackers Flash Caution Amid Omicron Worries (Add Ukraine-Russia Tensions To The Mix)

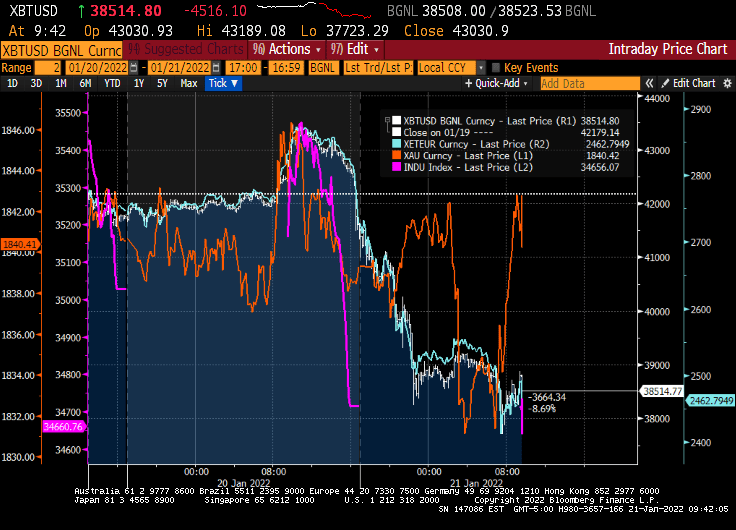
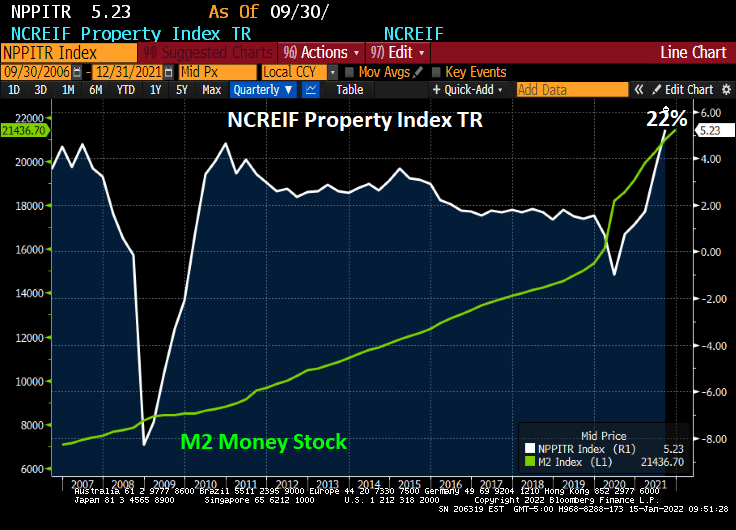
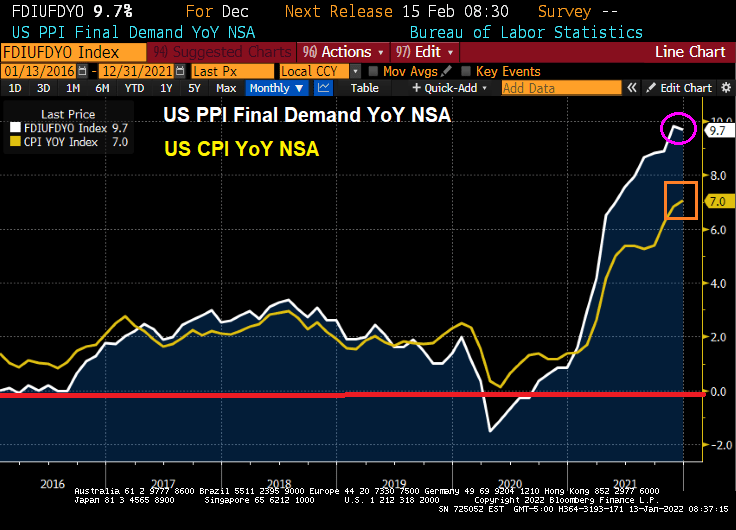
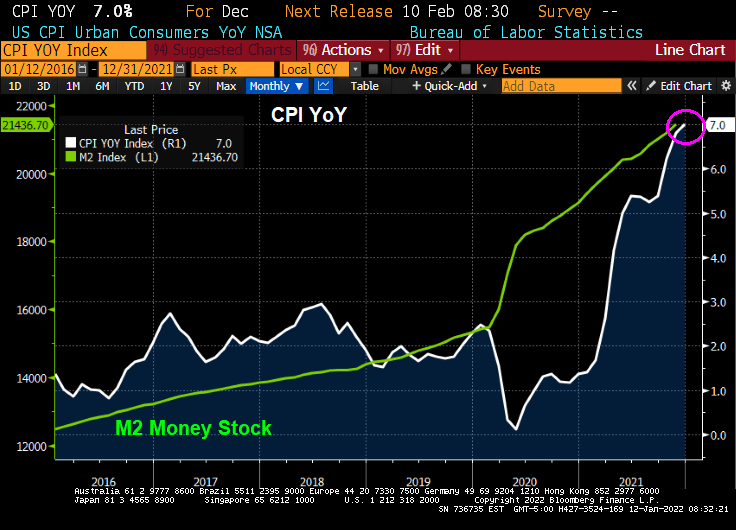
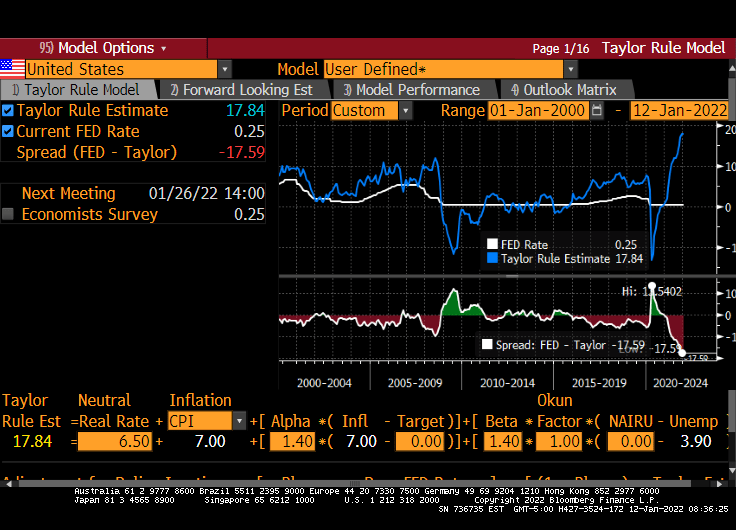
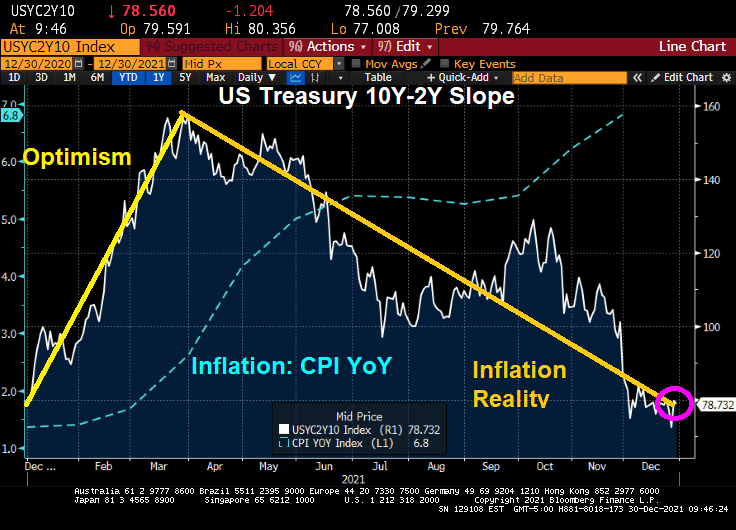
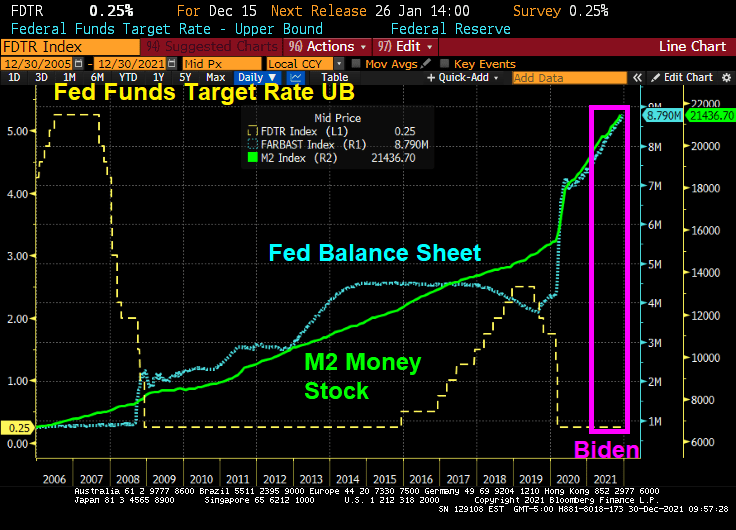
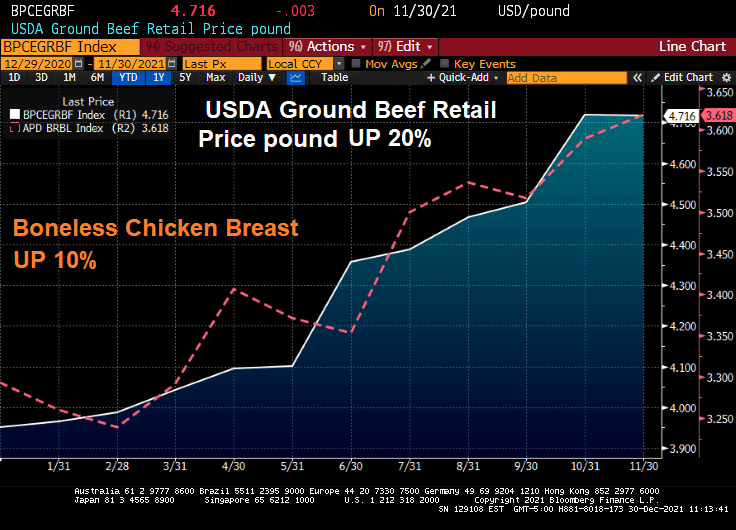
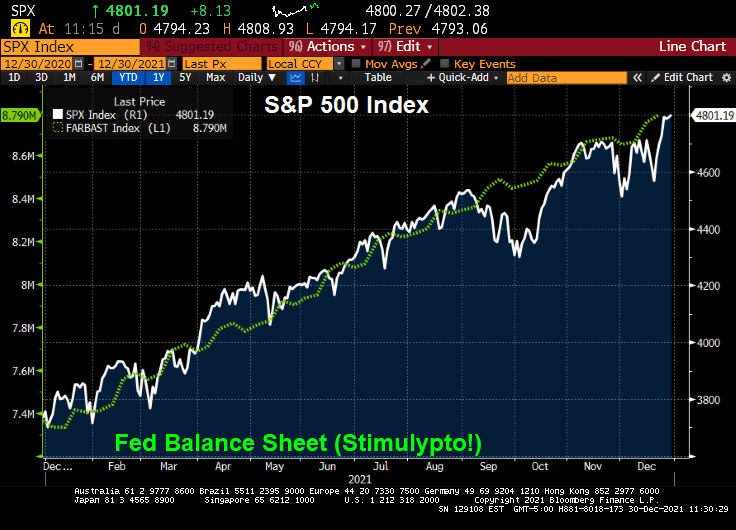
COVID and its omicron variant (as well as government reactions such as mask and vaccination mandates) are wreaking havoc on the global economy, but particularly in the USA where the Federal government dumped trillions of dollars in fiscal stimulus along with The Federal Reserve’s monetary stimulus into an economy not prepared for it. The result? INFLATION.

But global supply chains are nearing a turning point that’s set to help determine whether logistics headwinds abate soon or keep restraining the global economy and prop up inflation well into 2022, according to several new barometers of the strains.

Just a week before the start of Lunar New Year, the holiday celebrated in China and across Asia that coincides with a peak shipping season, economists from Wall Street to the U.S. central bank are unveiling a string of models in the hope of detecting the first signs of relief in global commerce. 

From Europe to the U.S. and China, production and transportation have stayed bogged down in the early days of 2022 by labor and parts shortages, in part because of the fast-spreading omicron variant.

Among the big unknowns: whether solid demand from consumers and businesses will start to loosen up, allowing economies to finally see some easing in supply bottlenecks. Fresh indicators from the private and official sectors are in high demand because there’s still much uncertainty in industries overlooked by mainstream economics before the pandemic.

Once the realm of trade and industrial organization experts, supply chains “have shifted to center stage as a critical driver of sky-high inflation and a stumbling block to the recovery,” Bloomberg Chief Economist Tom Orlik said. “The profusion of new indices and trackers won’t unblock the arteries of the global economy any quicker. They should give policy makers and investors a better idea of how fast — or slowly — we are getting back to normal.”

The Bloomberg Economics Index

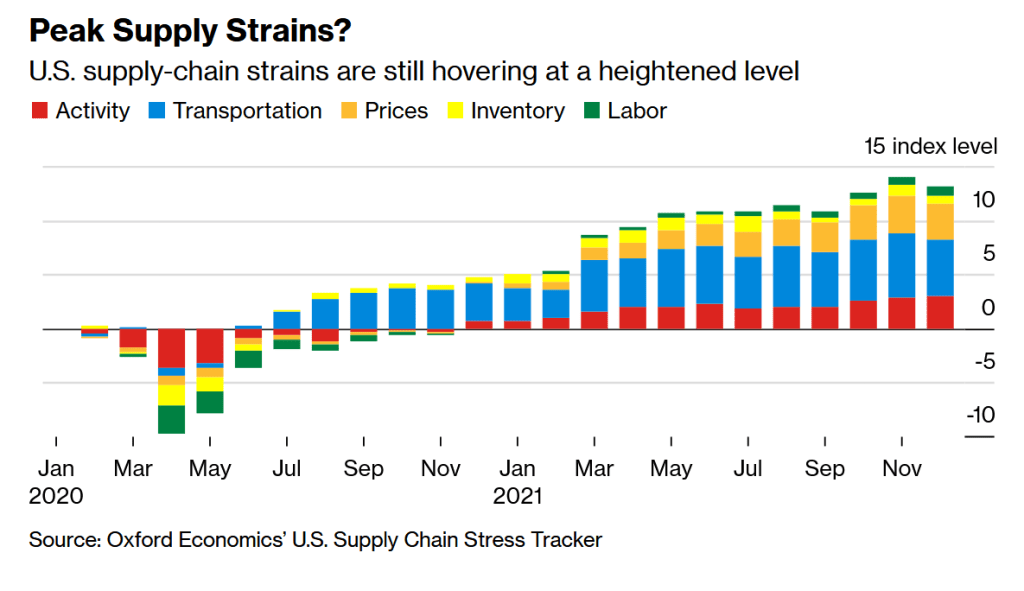
Bloomberg Economics’ latest supply constraint index for the U.S. shows that shortages have trended modestly lower for six months. Even so, strains remain elevated, and the wave of worker absenteeism is adding to the problems at the start of 2022.

Port traffic tracked by Bloomberg shows container congestion continues to rankle the U.S. supply chain from Charleston, South Carolina, to the West Coast. The tally of ships queuing for the neighboring gateways of Los Angeles and Long Beach, California, continued to extend into Mexican waters, totaling 111 vessels late Sunday, nearly double the amount in July.

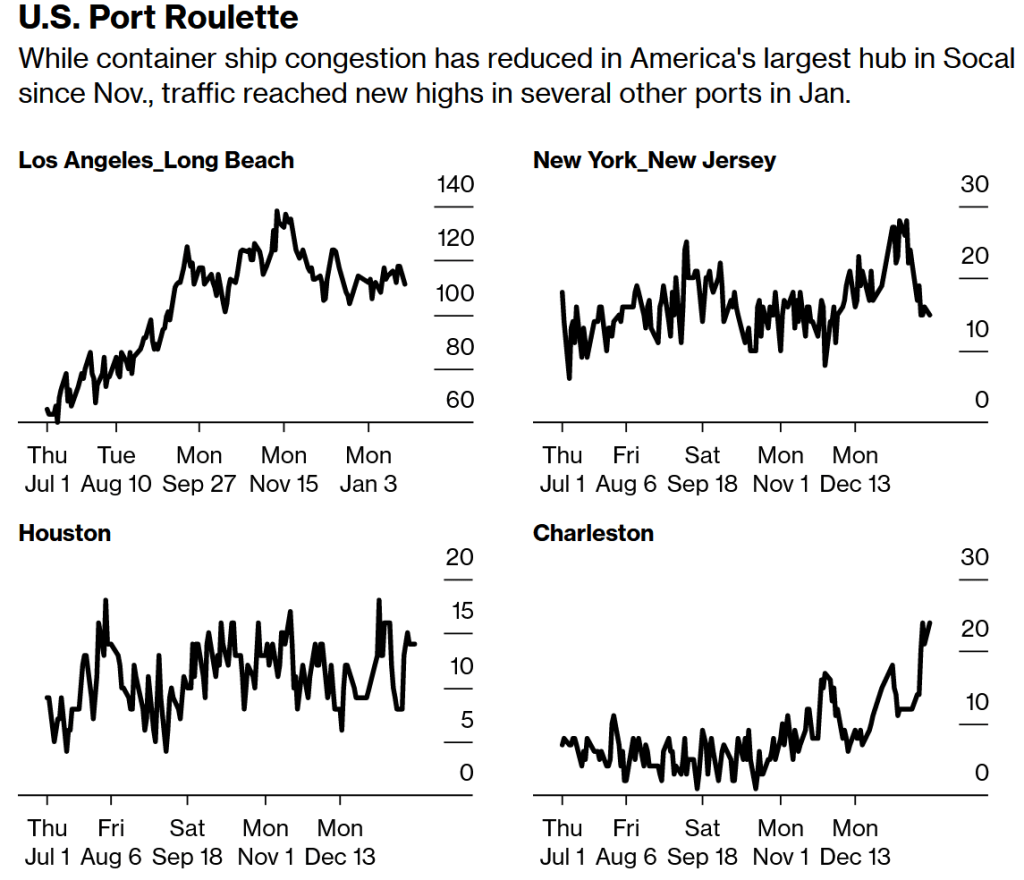
Source: Bloomberg, IHS Markit, Genscape

Note: Data counts the total number of container ships combined in port and in offshore anchorage area.

Kuehne+Nagel’s Disruption Indicator

Kuehne+Nagel International AG last week launched its Seaexplorer disruption indicator, which the Swiss logistics company says aims to measure the efficiency of container shipping globally. It shows current disruptions at nine hot spots is hovering near “one of highest levels ever recorded,” with 80% of the problems happening at North American ports.

Seaexplorer disruption indicator as of Jan 20, 2022

Flexport’s Guages

Another freight forwarder, San Francisco-based Flexport Inc., last year developed its Post-Covid Indicator to try to pinpoint the shift by American consumers back to purchasing more services and away from pandemic-fueled goods. The latest reading released Jan. 14 “indicates the preference for goods will likely remain elevated during the first quarter of 2022.”

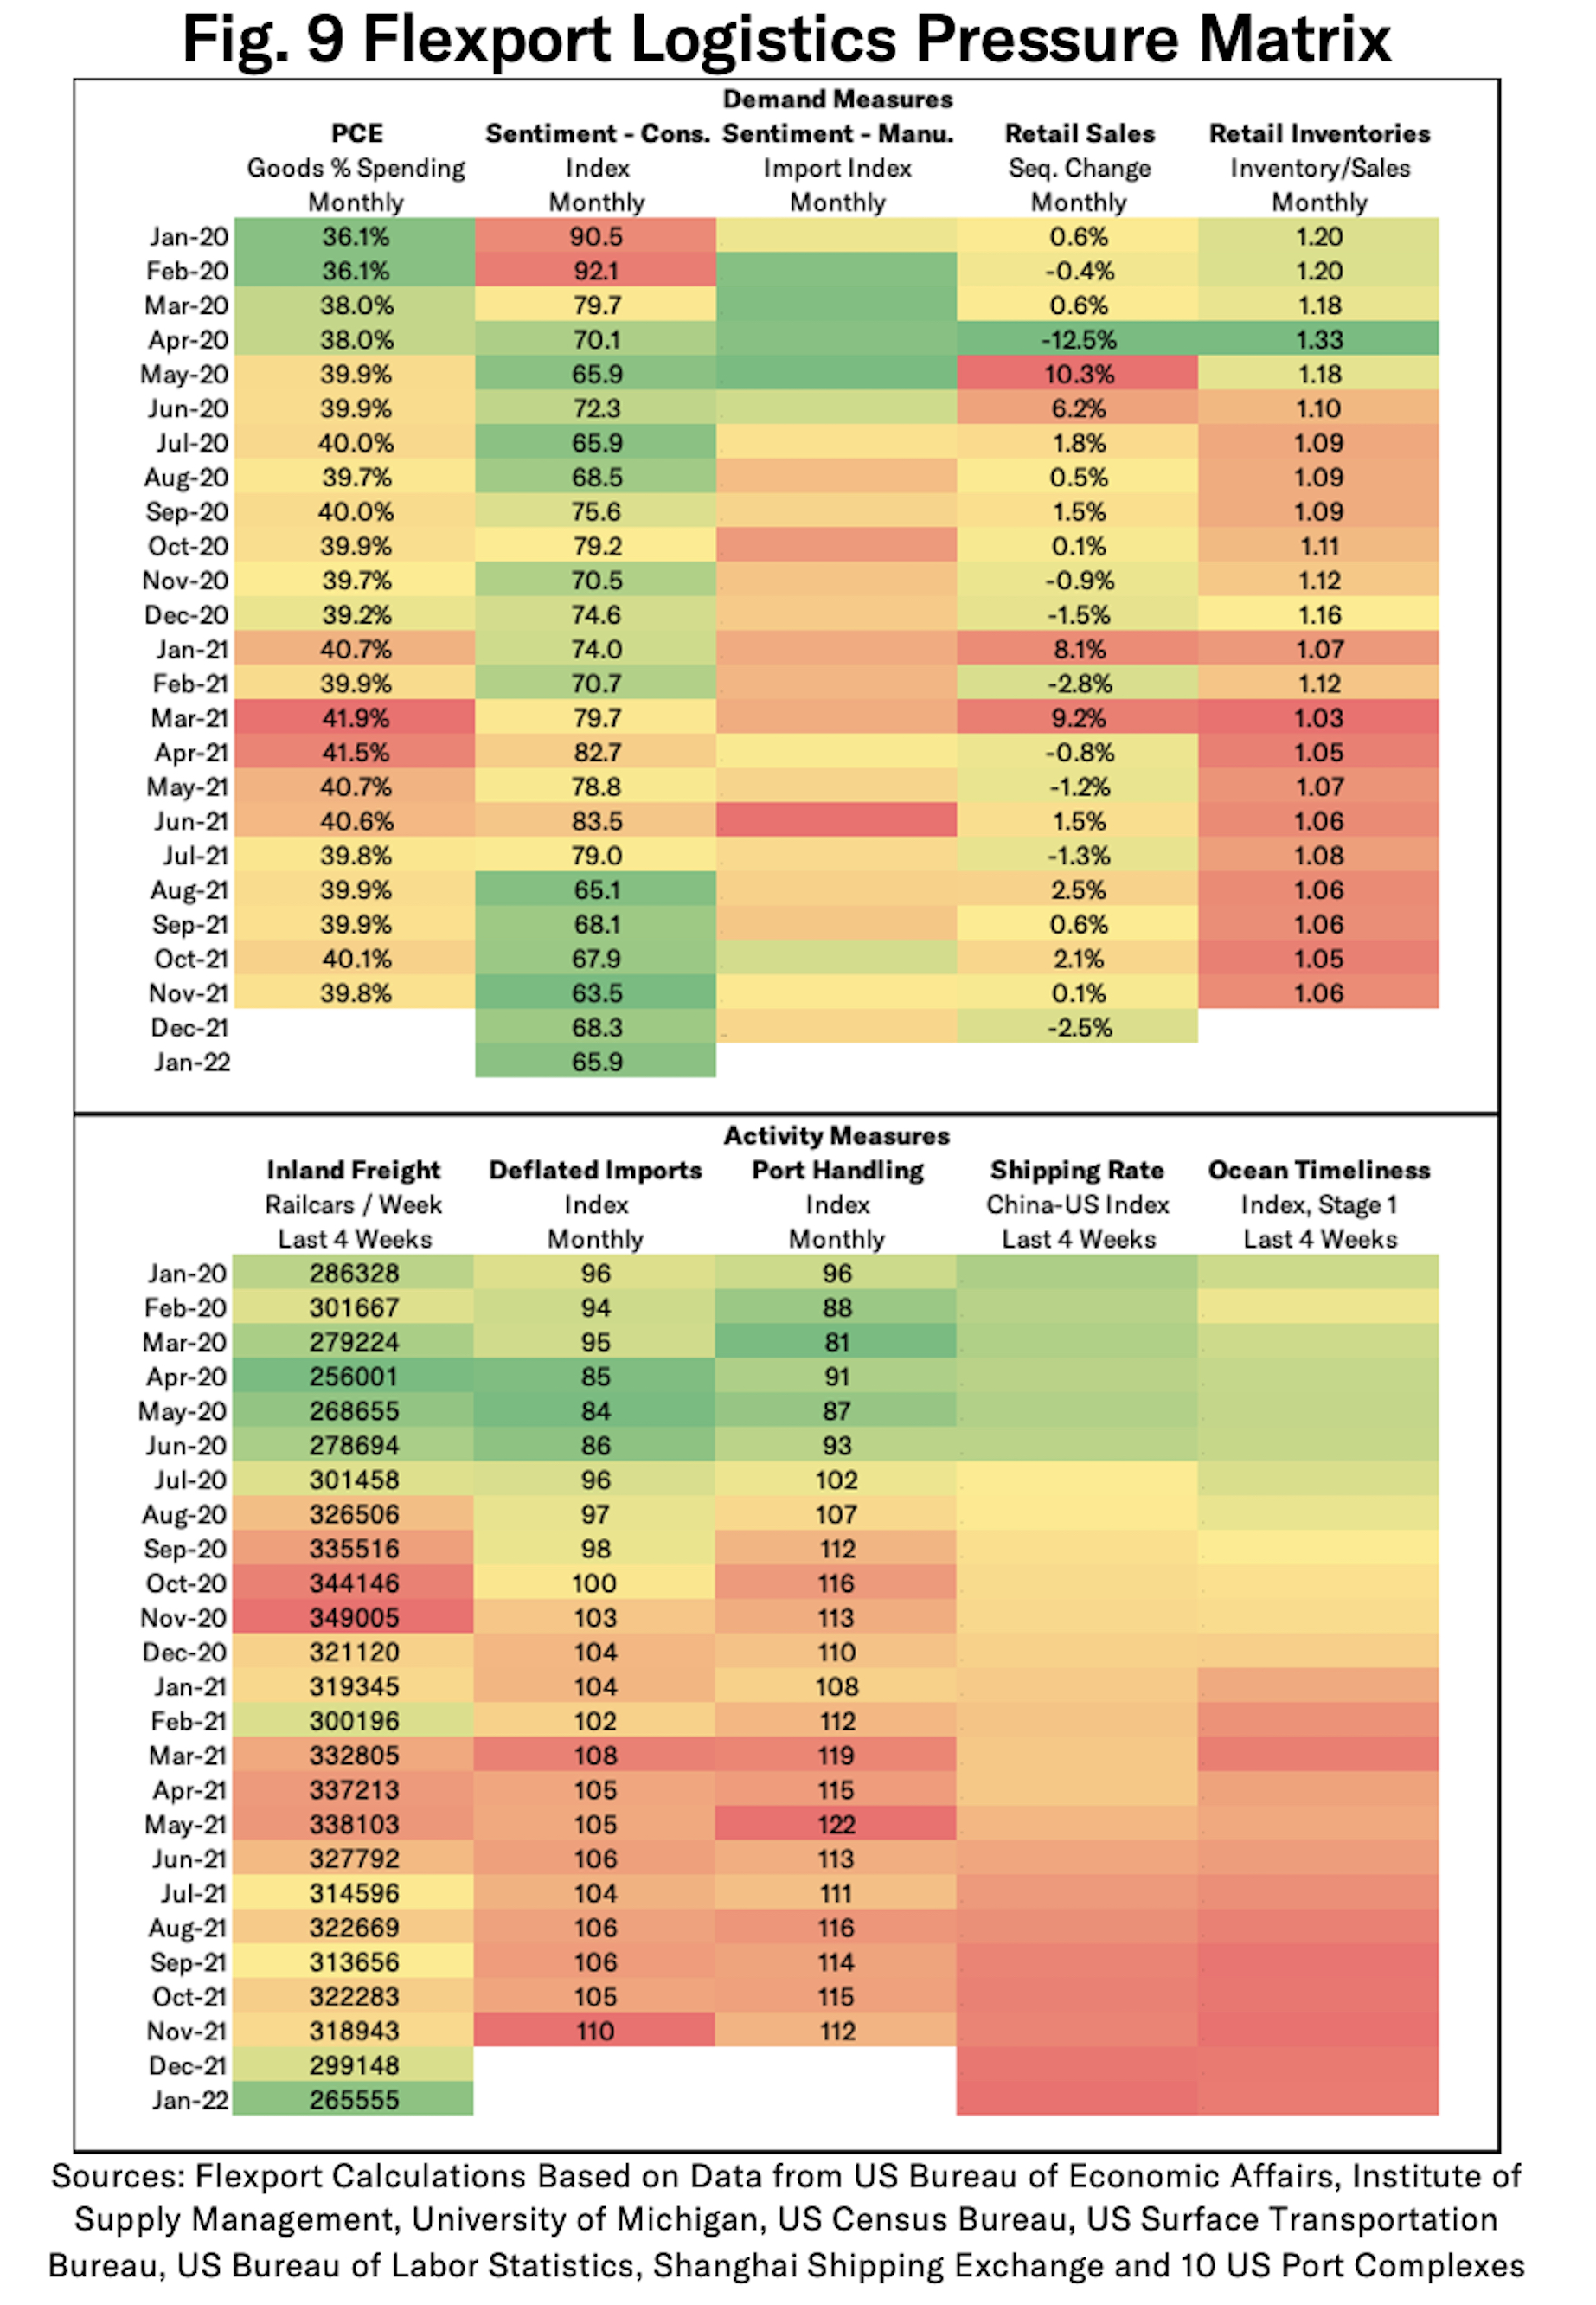
Flexport has a new Logistics Pressure Matrix with a heat map showing demand and logistics trends, and much of those numbers are still flashing yellow or red. Flexport supply chain economist Chris Rogers said in a recent online post that similar grids for Asia and European markets will be part of the research.

The Federal Reserve’s Stress Monitor

Adding their stamp to the burgeoning genre of supply stress indicators were three Ph.D. economists from the Federal Reserve Bank of New York, with the launch its Global Supply Chain Pressure Index. Rolled out earlier this month, it shows that the difficulties, “while still historically high, have peaked and might start to moderate somewhat going forward.” The New York Fed said it plans a follow-up report to quantify the impact of shocks on producer and consumer price inflation.

Morgan Stanley’s Index 

Less than a week later came the Morgan Stanley Supply Chain Index. It lined up with the Fed’s view that frictions have probably peaked, though some of improvement ahead will come from a slowdown in the demand for goods. 

“Supply disruptions remain a constraint to global trade recovery, but as firms continue to make capacity adjustments to address them, capacity expansion could mitigate these,” Morgan Stanley economists wrote in a report Jan. 12.

Citigroup’s Tool

Citigroup Inc. last week released research that was less optimistic yet complementary to the New York Fed’s work, which Citi said doesn’t factor the role of surging demand as a contributor to the supply disruptions. Sponsored Content The Collaboration Disconnect Atlassian

Co-written by Citi’s global chief economist Nathan Sheets, a former U.S. Treasury undersecretary for international affairs, the bank’s analysis “gives a more complete, and intuitive, picture of the current situation.” While strains may ease in coming months, Citi said, “these supply-chain pressures are likely to be present through the end of 2022 and, probably, into 2023 as well.”

The Keil Institute’s Flows Tracker

In Germany, the Kiel Institute for the World Economy updates twice a month its Trade Indicator, which looks at flows across the U.S., China and Europe. Its latest reading Jan. 20 shows that along the key trading route between Europe and Asia, there are 15% fewer goods moving than there would be under normal times. The last time the gap was that large was in mid-2020, when many economies were reeling from initial lockdowns, Kiel said.

More recently, “the omicron outbreak in China and the Chinese government’s containment attempts through hard lockdowns and plant closures are likely to have a negative impact on Europe in the spring,” says Vincent Stamer, head of the Kiel Trade Indicator, said in a post last week. “This is also supported by the fact that the amount of global goods stuck on container ships recently increased again.”
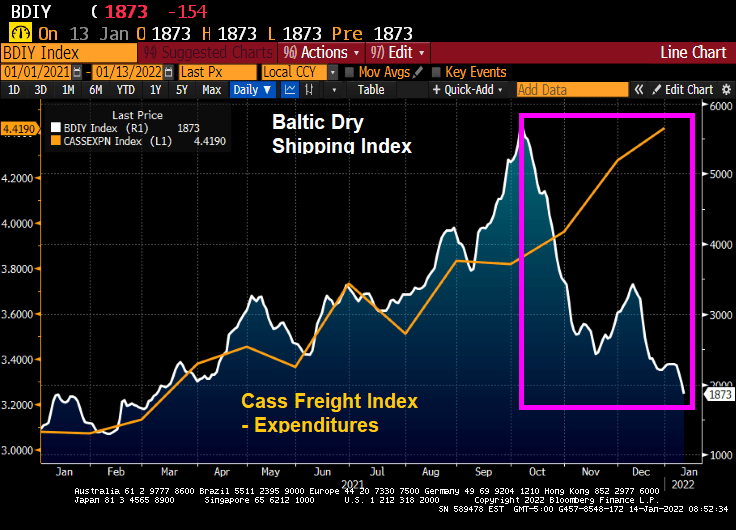
Baltic Dry Index

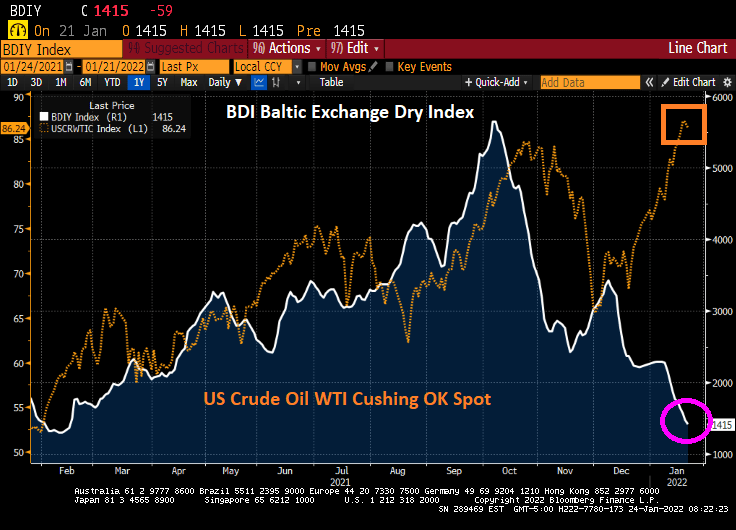
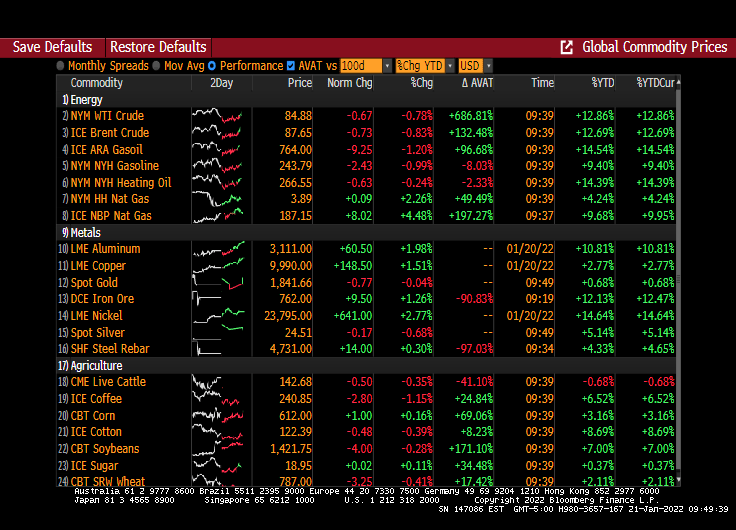
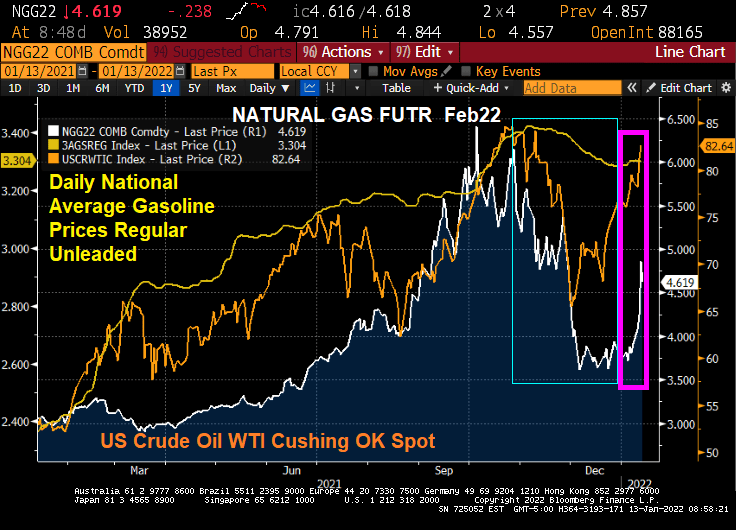
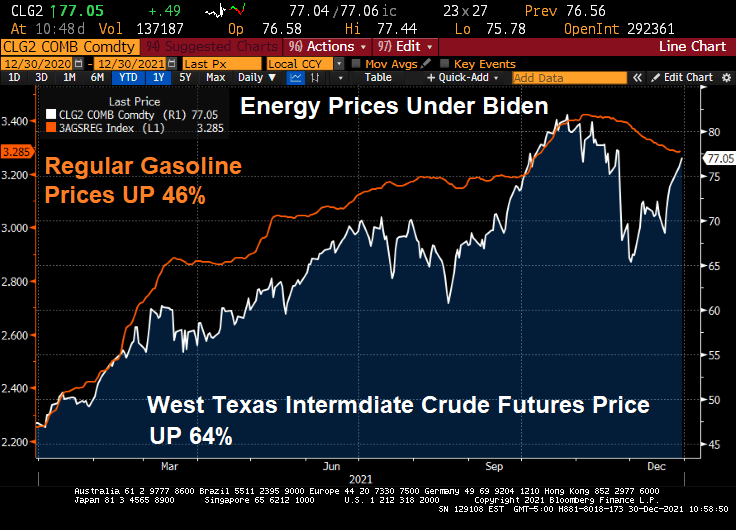
The Baltic Dry shipping cost index indicates that costs for shipping materials such as iron ore have decline to where it started under Biden, despite West Texas Crude Oil spot prices begin considerably higher thanks to Biden’s anti-fossil fuel policies.

So as the world comes out of Omicron (and whatever COVID variant rises to take its place), we should see a normalization in the supply chain. And with Intel building a new chip factory in New Albany Ohio (aka, outskirts of Columbus). the supply chain woes will eventually subside.

Then again, there is always the Russia-Ukraine tension that may erupt into a disaster. I suggest that President Biden sent Hunter Biden to Moscow to negotiate on behalf of The Ukraine.

Ain’t it funky now. The US’s new ambassador to Russia?

Bitcoin/Ethereum/Dow Slide As Gold Rebounds (Fun Times As $3.3 Trillion Options Expire)

Yes, it is fun times in markets this Friday as $3.3 trillion in options expire.

As of 9:52am EST, we see Bitcoin (white) and Ethereum (blue) falling along with the Dow (pink), while gold (gold) fell then rebounded.

European stock markets are down 2% today.

Global sovereign bond prices are up across the board internationally as yields decline.

Crude oil is down today while natural gas is soaring. In particular, look at UK natural gas prices!

Brrr.

The Empire Strikes Out! Empire Manufacturing Index Slumps To Negative Territory As Inflation Roars (WTI Crude Futures UP 79% Since Jan 1st)

Well, Omicron is hitting hard. Not the virus itself, but governments’ reaction to the virus. The NY Empire Manufacturing Index has tanked into negative territory.

New orders are down 5%.

On the energy front, West Texas Intermediate Crude Oil futures are up 79% since January 1, 2021 while regular gasoline prices are up “only” 50% over the same period.

How about inflation and the Treasury yield curve? Inflation has soared to 40-year highs under Biden as energy prices (WTI Crude Futures) have soared 79%.

Container ships are still backed-up at LA and Long Beach ports. I thought Mayor Pete was supposed to fix the port congestion problem!

Maybe they should play the Darth Vader theme when Biden goes to the podium to stammer.

Inflation Nation! Commercial Real Estate Returns UP 22% YoY For Q4 2021 (Versus 19.66% YoY For Case-Shiller National Home Price Index)

Inflation is burning out of control. While home price growth has been off the cherts (as Jean-Ralphio would say), commercial real estate has jumped incredibly at 22% YoY. The Bloomberg charting function hasn’t updated for the Q4 NCREIF report yet so I had to manually write-in 22% on the following chart.

To quote Dean Martin, “Ain’t that a kick in the head.” Commercial real estate returns are now higher than house price growth.

So, what will happen IF The Fed follows through with its monetary stimulus reduction? JPMC’s Jaime Dimon warns that The Fed could hike 7 times in 2022 and not be ‘sweet and gentle’.

But The Fed seems to be stuck in underworld and doing a terrible job at signalling their intentions if Dimon thinks that The Fed could raise rates 7 times in 2022.

Shipping Blues! Cass Freight Index Expenditures Rose 43.6% In 2021 While Baltic Dry Index Has Crashed Since October 2021 (Omicron Strikes!)

Ever wonder why prices are rising so fast? One reason is that with rapidly rising energy prices under the Biden Administration, the costs are getting passed-through to consumers in the form of higher prices.

According to the Cass Corp Freight Index, the total spent in December on shipping goods to their customers in the US spiked by 43.6% from December 2020 to December 2021. Not surprising since energy prices over the past year have soared by almost 50%.

But at the same time, the Baltic Dry index (The Baltic Dry Index (BDI) is a shipping and trade index created by the London-based Baltic Exchange. It measures changes in the cost of transporting various raw materials, such as coal and steel) is crashing thanks to FEAR created by Omicron.

And yes, energy prices are surging again in 2022 after cooling off in Q4 2021.

Covid strikes!

Inflation Nation! US PPI Final Demand Soaring At 9.7% YoY As CPI Soared 7.0% YoY (Energy Prices Lessened In Q4 But Are Surging Again In 2022)

Yesterday’s inflation report was the worst in 40 years. But at least today’s Producer Price Index Final Demand is down slightly from November. But PPI Final Demand YoY is still roaring at 9.7%.

The producer price index for final demand increased 0.2% from the prior month and 9.7% from a year earlier, Labor Department data showed Thursday. The annual advance was the largest in figures back to 2010. 

Excluding the volatile food and energy components, the PPI climbed 0.5% in December and was up 8.3% from a year earlier. 

Too much Federal government spending, too much Fed monetary stimulus, Omicron helping created labor shortages, etc. But the real killer has been ENERGY prices. Note that natural gas, gasoline and WTI crude oil were falling in November/December helping to slow PPI growth by a smidge. BUT energy prices are skyrocketing in January. So … look for higher PPI in January.

Here is the painting by Thomas Hart Benton that drove “Brokeback Biden” to try to destroy fossil fuel production. Or at least this is Washington DC’s idea of what Oklahoma and Texas are like.

Waiting For Godot: US Inflation Jumps To 7% YoY As Real Hourly Earnings Growth Crashes To -2.32% (Taylor Rule Now 17.84% Versus Current Fed Funds Target Rate Of 0.25%)

This is like the Samuel Beckett play “Waiting For Godot.” Except we are waiting for Jerome Powell and The Federal Reserve to do something.

December’s consumer price index (CPI) is out and its a doozy, though expected. The CPI year-over-year (YoY) rose 7% in December.

If we exclude food and energy, CPI rose by 5.5% YoY.

Thanks to Biden’s assault on the energy sector, energy prices are up nearly 50% YoY.

REAL average hourly earnings YoY? It has crashed to -2.32%.

And with 7% inflation, the Taylor Rule model suggests a Fed Funds Target rate of … 17.84%. Bear in mind that the current target rate is 0.25%.

Meanwhile, grocery store shelves remain empty like we are living in Venezuela. Bidenzuela??

Meanwhile, we are waiting for Godot Powell to start taking action instead of jawboning.

Real Estate Hedge Against Inflation? Housing And REITs Did Better Than Inflation, NCREIF Not So Much

Now that inflation has reared its ugly head, how can investors protect themselves against the ravages of inflation?

Back in 1977, Fama and Schwert showed that housing acted as a hedge against inflation. Over the past year as inflation has reached its highest levels in 40 years, home prices have outpaced inflation by 19.08% to 6.8%.

How about real estate investment trusts? The NAREIT all-equity index rose by 35.6% YoY while inflation rose at 6.8%. The S&P 500 index rose 28.9% YoY.

Of course, the NAREIT all-equity index has a beta of 1.276.

How about the NCREIF All-property commercial real estate index? For Q3, the NCREIF property index rose by 5.22%, less than the most recent inflation reading of 6.8%.

So for the past year, housing has beaten the pants-off inflation, REITs have earned a higher return than inflation, and the NCREIF index seems to be rising slower than inflation (but with its lag problems, I anxiously await the Q4 numbers which should be higher.

US Treasury Yield Curve Now Back Where It Stated With Biden At The Helm (Inflation Crushing America And The Yield Curve)

It has been almost a year since Joe Biden has been President of the United States and a Democrat majority took control of The House and Senate. And what has happened to the US Treasury yield curve slope over the past year?

The yield curve is back where it started. There was the “honeymoon effect” where the curve slope rose. After all, Biden was Obama’s Vice President for 8 years and The Democrats has promised so much in the 2020 election. But by early April, the reality of the massive Federal spending (combined with Fed Stimulypto) began showing what was feared: inflation (blue line) started to grow at a rapid rate of speed. With inflation now at 6.8% YoY,

In fairness to Biden, The Federal Reserve has been overstimulating the economy since The Federal Reserve since Ben Bernanke and the Fed Open Market Committee (FOMC) dropped the hammer on The Fed Funds Target Rate once the rate hit 5.25% in September 2007. They kept cutting it reached 25 basis points (or 0.25%) in December 2008. In August 2008, Bernanke and Company began their “Quantitative Easing” or asset purchasing programs. Between The Fed’s Target Rate and QE, The Fed has continued to overstimulate markets ever since. Under Biden, The Fed Funds Target Rate remains at 0.25% and The Fed’s Balance sheet has grown to $8.79 Trillion (bigger than the entire economies of Japan and Germany put together!).

How about housing? Home prices are growing at 19% YoY while rents are growing at 12.65% YoY.

Energy prices have risen dramatically under Biden. Gasoline is up 46% despite a slight reprieve recently. WTI crude prices are up 64%.

How about food? Beef prices are up 20% and chicken prices are up 10%.

On a positive note, the S&P 500 index has soared … thanks has soared during Biden’s term thanks to Fed stimulus and Federal spending on COVID.

The Build Back Better Act if passed (in its entirety or on a piecemeal basis) will lead to even MORE inflation.

Perhaps Biden’s spokesperson Jen Psaki can recreate the Biden Administration as a lovable, hilarious family like the comic strip Gasoline Alley with old Joe Biden as Skeezix. And insider-trading star, House Speaker Nancy Pelosi as the family matriarch.

What’s Wrong With This Picture? Fed Reverse Repo Usage Continues To Grow Along With Fed’s Balance Sheet (Reverse Repos At All-time High)

I love listening to Fed talking heads (or Fear The Talking Fed). They mostly seem to acknowledge that inflation is a problem and that the excessive monetary stimulus should be reduced.

But then I see the chart of The Fed’s balance sheet and The Fed’s reverse repo operations.

Then we have Federal Reserve Governor Christopher Waller saying that Th Fed could start raising interest rates as early as its March 15-16 meeting, after deciding to end asset purchases sooner than planned. My question is … why wait until the March meeting?

Is it fear of the Omincron Variant (which sounds like a Frederick Forsyth thriller)? Does The Fed not want to rock the boat prior to the Christmas season? The US is at or near full employment, so what is the real reason for delaying a rate increase until March or June? Or the fear that Congress won’t pass Biden’s Build Back Better Act?

Fed Funds Futures infer that one rate hike will occur at the June Fed Open Market Committee (FOMC) meeting and one at the November meeting.

So will Powell get back in the saddle again and actually do his job?