The Great Reset … In Asset Returns (Commodities Soaring, Treasuries Tanking, Home Price Growth Still 4x Soaring Mortgage Rates)

Numerous elites like Klaus Schwab of The World Economic Forum (and Davos fame) are calling for a “Great Reset” in global economies. But perhaps “The Great Reset” in taking place in asset markets … and not in a good way.

Consider what has happened since President Biden was elected. The S&P 500 total return index (green index) has risen thanks to The Federal Reserve’s balance sheet expansion (orange line) with COVID. Until 2022 when the expectation of Fed rate hikes surged from 3 in late December 2021 to 9.4 expected rate hikes over the next 12 months (yellow line).

The US Treasury total return index (white line) has gotten crushed with The Fed’s signals of rate hikes and quantitative tightening (QT). Call it “White Line Fever.” The commodity total return index (blue line) has surged as The Fed’s expected rate hikes have risen from 3 to 9.4 in 2022.

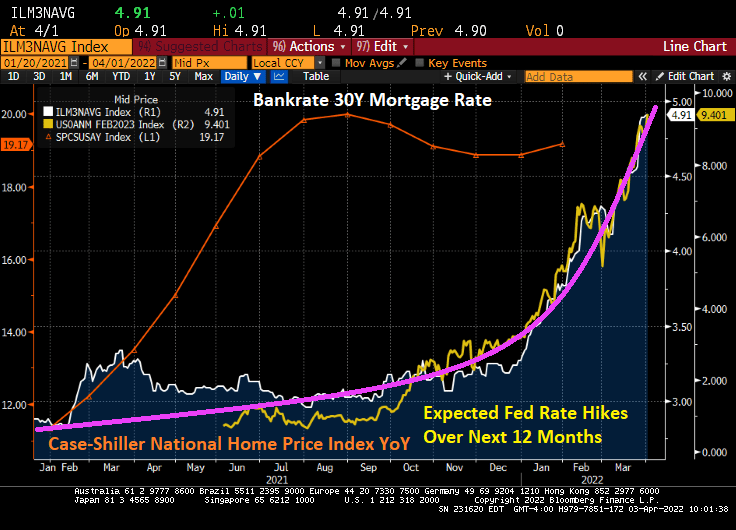
Is The Fed causing a Great Reset in housing? In 2022, we see the surge in Fed rate hike expectations leading the 30-year mortgage rate to be nearly 5%. The last Case-Shiller home price index was for January and it was still raging at 19.17% YoY growth. Let’s see if The Fed’s QT will slow down home price growth. But home prices are growing at 4x 30-year mortgage rates.
I hope that Klaus Schwab and the global elites pick us up on our way down. But probably not.

So let’s see if The Fed still is going to withdraw its “Snake Juice” from the market.

Now A Warning? Dallas Fed Warns That A Housing Bubble Is Brewing (Too Late, Its Already Here!)

This clip from the Bruce Willis and Meryl Streep film “Death Becomes Her” perfectly represents the predicament surrounding The Federal Reserve’s loose monetary policies and housing prices: “Now a warning” after Meryl Streep ingests The Fed’s magic monetary elixir.

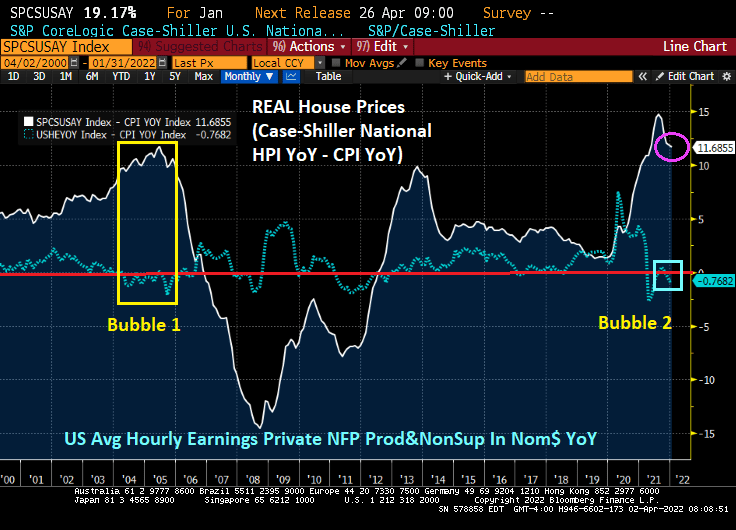
The Dallas Federal Reserve issued a warning recently that a housing bubble is brewing … after the economy drank its magic monetary elixir. We can see the housing bubble clearly (defined as the spread between REAL home price growth and REAL average hourly earnings). Notice that the current housing bubble looks similar to the infamous 2005 housing bubble. And the US is seeing several months of the spread between REAL home price growth and REAL hourly earnings be even higher than the peak of the 2005 bubble.

The Federal Reserve is starting to slow down its asset purchases, so we should see a cooling of the housing bubble. Unless, of course, The Fed changes its tune from quantitative tightening (QT) back to quantitative easing (QE) … again.

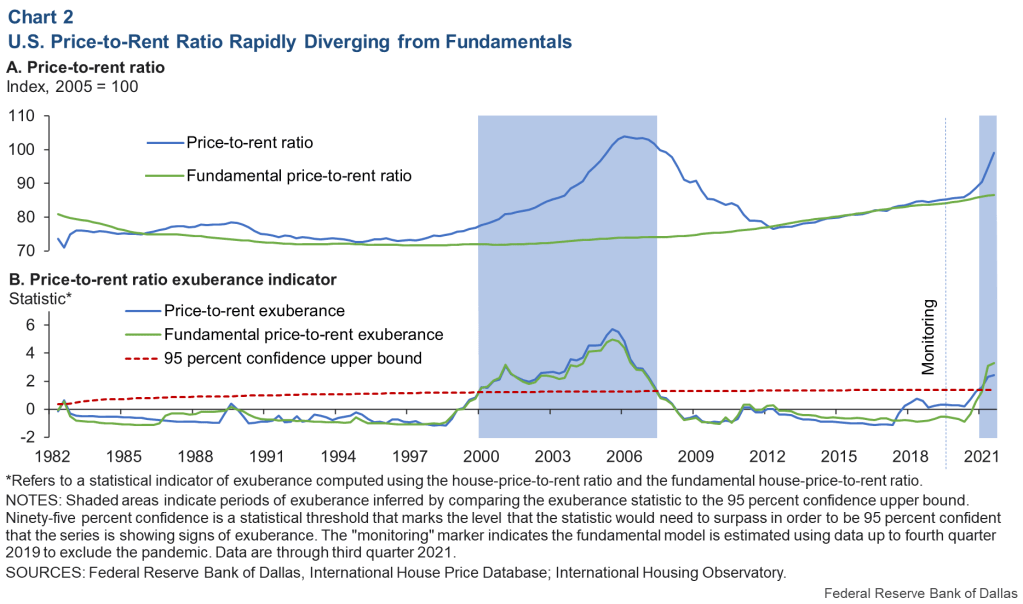
The Dallas Fed has a measure of housing “exuberance” which shows a bubble forming, but not there yet. I like the spread between real house price growth and real hourly earnings better.

The Dallas Fed also has a price-to-rent chart also showing growing exuberance.

But if we look at the Case-Shiller National HPI YoY to US CPI Urban Consumers Owners Equivalent Rent of Residences YoY we see that the US is currently experiencing a price-to-rent ratio higher than the peak of the 2005 house price bubble. What is the culprit? The vast expansion of monetary and fiscal Stimuylpto surrounding the Covid outbreak in early 2020.

So, the Dallas Fed thinks that is a house price bubble is brewing, but it has actually been in the works since QE3 in 2013 (bubble 2), but really took off with The Fed’s stimulypto and Federal COVID spending surrounding the COVID outbreak in early 2020.

Here is a rare video of Fed Chair Jerome Powell at the recent Fed Open Market Committee meeting deciding on removing the toxic monetary elixir from the system.


Here is a video of Jordan Spieth at the Valero Open engaging in putting errors like The Fed’s policy errors.

Wasting Away In Biden/Pelosiville! US Treasury 10Y-2Y Yield Curve INVERTS As Real Average Hourly Earnings Decline -2.678% YoY (30Y Mortgage Rate Rises To 4.90%)

Wasting away again in Biden/Pelosiville, looking for my lost inexpensive gasoline and food. Some people say that Putin is to blame, but we know its Biden/Pelosi’s fault.

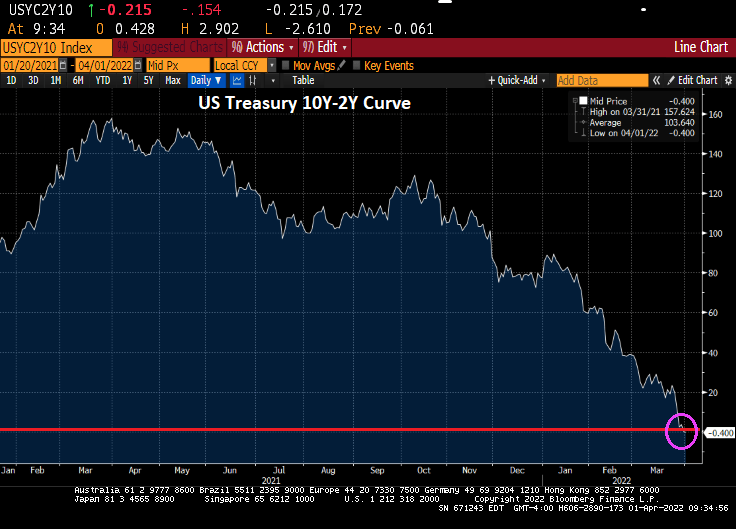
The US Treasury 10Y-2Y yield curve just inverted, generally a precursor to a recession. Called it, nothing but net!

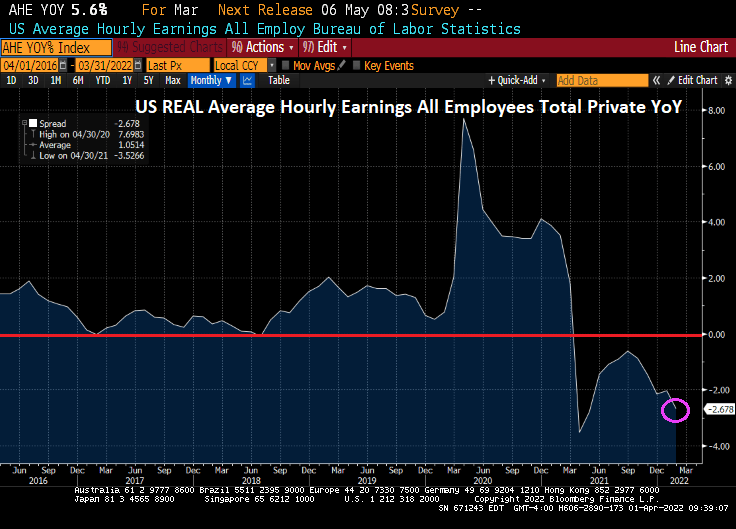
Meanwhile, today’s jobs report shows that Bidenflation is crushing America’s wage growth. While average hourly earnings grew to 5.6% YoY, we are still seeing inflation growing at 7.9% YoY meaning that inflation is reeling hurting the middle class and lower-income households.

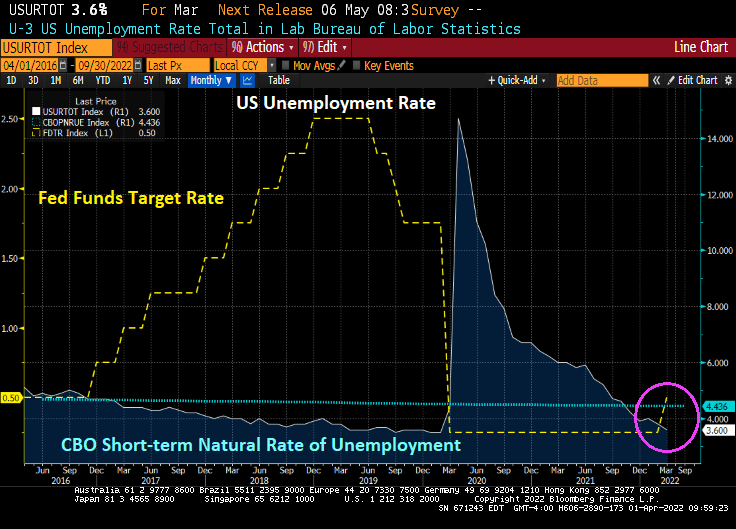
The good news is that the U-3 unemployment rate fell to 3.6%, almost back to the Trump-era unemployment rate of 3.5% prior to the Covid outbreak. And the unemployment rate remains below the CBO’s short-term natural rate of unemployment indicating that the labor market is OVERHEATED.

Today’s jobs report was pretty good, as we would expect from a recovery caused by governments shutting down economies, then reopening them. 431k jobs were added, but less than last month’s jobs added of 678k and less than the forecast 490k.

The number of people NOT in the labor force fell slightly, but it still around 100 million. The number of people holding multiple jobs to overcome Bidenflation rose to 7.5 million.

On the mortgage front, Bankrate’s 30-year mortgage rate rose to 4.90% as the 2-year Treasury rate (yellow) rises and the number of expected Fed rate hikes over the coming year is 9.26%.

The Powellenburg Omen! Will Powell Pop The Asset Bubble Created By The Fed’s Repeated Policy Errors? (Blackrock Rises, NVR Homes Gets Crushed)

As of today, Jerome “Nero” Powell and The Gang at The Federal Reserve have not trimmed the Fed’s balance sheet and have only raised their target rate once under President Biden.

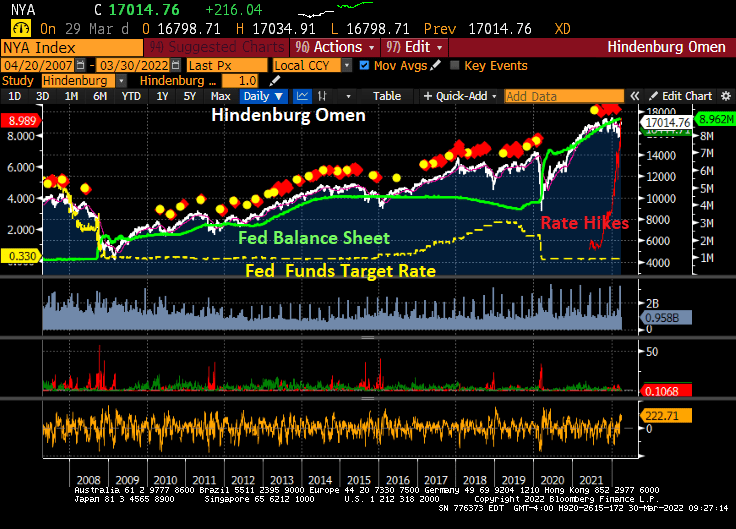
Here is the Hindenburg Omen, named for the catastrophic explosion on May 6, 1937 at Lakehurst Naval Air Station in New Jersey. The Hindenburg Omen was flashing red before the stock market correction of late 2007-2009. But, the Hindenburg Omen has flashed red repeatedly since the financial crisis, yet the S&P 500 index has kept rising. The reason? Repeated policy errors by The Fed leaving monetary stimulus in place for too long leading to a bubble forming in the stock market.
The Shiller CAPE (Cyclically-adjust price-earnings) ratio is at the second highest level since the 1800s. The highest point was the infamous Dot.com bubble and bust in 2000/2001.

Since The Fed continues to say “We have a plan!” to slow/shrink The Fed’s balance sheet and raise their target rate … it has not done anything yet (other than a 25 basis point bump at the March meeting).

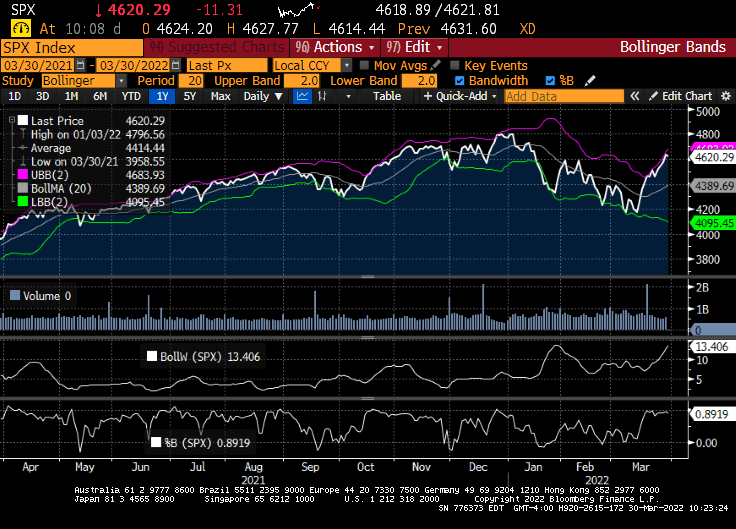
I am not advocating technical analysis for stocks, but the Bollinger Band analysis for the S&P500 index is showing the S&P 500 index near the top band indicating that a decline in likely.

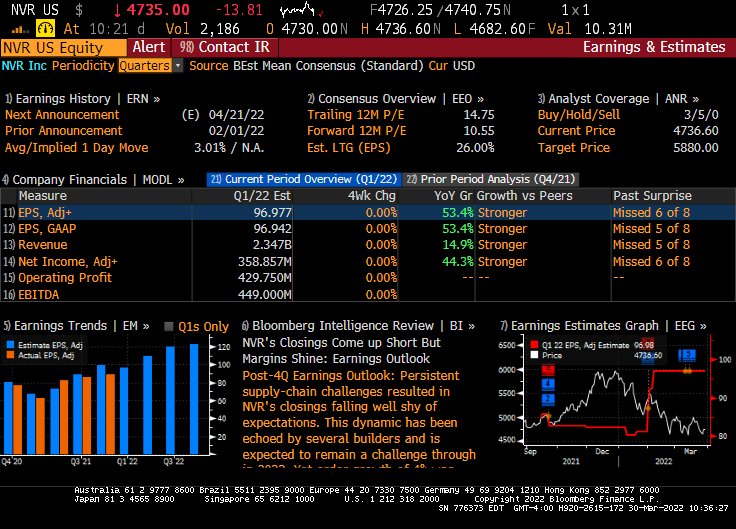
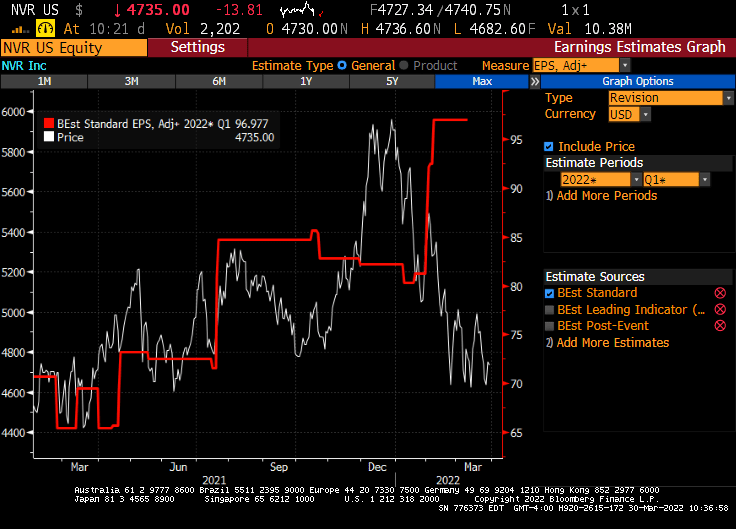
Today, the US equity market in essentially flat given the massive uncertainty about the Russia/Ukraine situation and whether the US economy is slipping into darkness. But this morning, Federal government blessed companies (healthcare, solar energy and Blackrock) are doing quite well, while homebuider NVR is taking it on the chin thanks to hints that The Fed will raising rates.

Now, NVR (Northern Virginia Homes, Ryan Homes) had explosive earnings growth in their February 1, 2022 report.

But the market is pricing in the crushing Fed rate hikes that are expected.

So, will Foul Powell pull a Volcker and raise rates and crush the economy (and stocks)? Or will Foul Powell And The Fed gang let inflation burn out of control, but preserve the massive asset bubbles?

Number 9! Fed Now Expected To Raise Target Rate 9 Times Over Coming Year As Mortgage Rates Rise To 4.54%

Number 9.

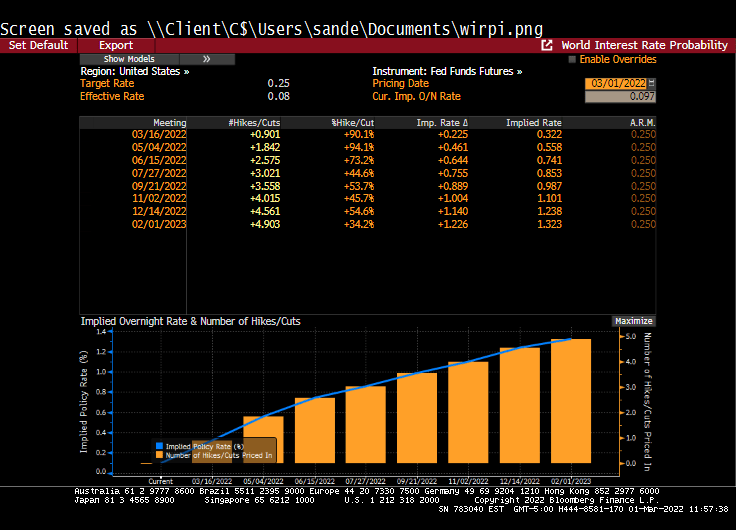
According to Fed Funds Futures data, The Federal Reserve is now forecasting 9 rate increases over the next year.

Fed Funds Futures are pointing to 8.924 rate hikes by the Fed FOMC meeting on February 1, 2023.

The US Treasury 10Y-2Y curve flattened by 5.5 bps today with the entire curve downshifting.

The Federal Reserve reminds me of The Office episode “Malone’s Cones.” They can’t really explain why they kept rates so low for so long (policy error) and seem to risk collapsing the market with rapid rate hikes without much sensible explanation.

Can You Spot The Fed’s Policy Errors? The Fed And Fannie/Freddie’s Demise After 3 Fed Policy Errors (We Are Now In PE5!)

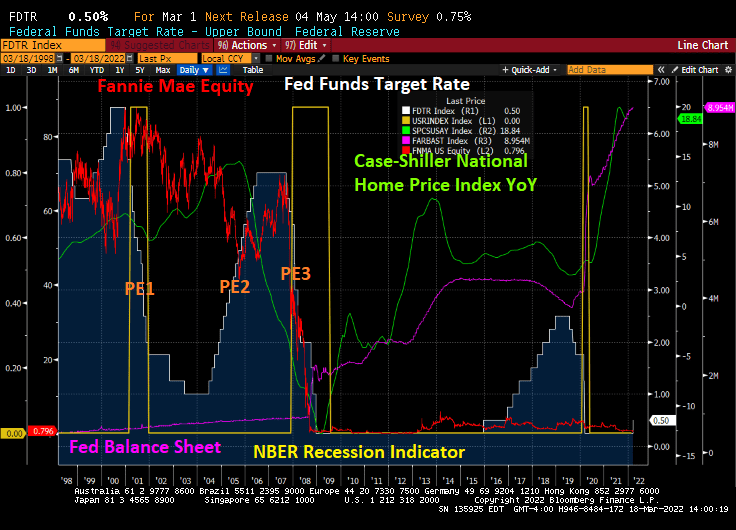
The Federal Reserve is not mentioned in the movies “The Big Short” or “Margin Call”, but The Fed’s policy errors played a big role in the demise of Fannie Mae’s and Freddie Mac’s equity prices.

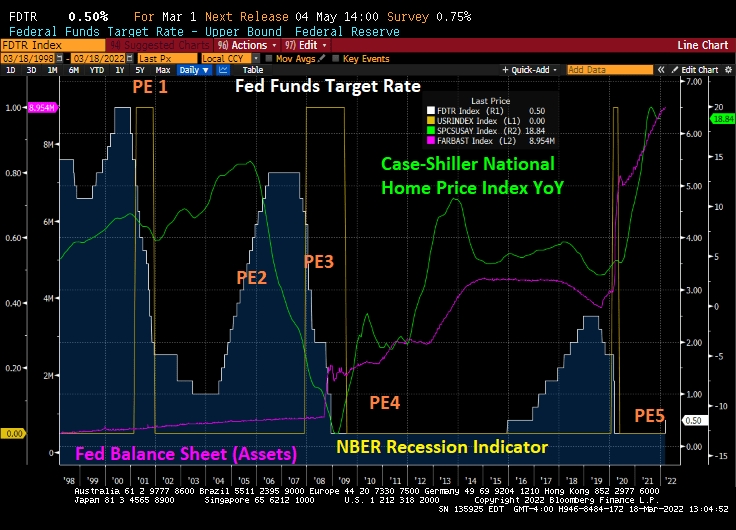
Here is a chart of The Fed’s many policies errors. Let’s start with The Fed lowering rates too fast around the 2001 recession. They pushed their target rate from 6.5% in December 2000 down to 1.75% after one year and then down to 1% (PE1). As home price growth accelerated, The Fed engaged in their second policy error — raising rates too fast resulting in a dramatic cooling of home price growth. Then came Policy Error 3: the dropping of The Fed Funds Target rate from 5.25% in September 2007 to an eventual 0.25% in December 2008.

With the election of President Obama, The Fed engaged in Policy Error 4: keeping The Fed Funds Target rate too low for too long, combined with their massive asset purchase programs (QE).

Finally, The Fed (under Yellen) finally raised The Fed’s target rate ONCE under Obama, but started raising rates once Trump was elected. The Fed also slowed their QE under Trump which as called “Fed policy NORMALIZATION.” Then COVID struck and The Fed engaged in Policy Error 5: keeping rates too low for too long … again while massively expanding their balance sheet.
Fannie Mae and Freddie Mac, the DC mortgage giants were done in by The Fed’s whipsaw Policy Error machine.
Now we are embarking on PE 5: Powell and The Fed Gang not raising rates but signalling that they will. Like the play “Waiting for Godot.”

Consumer Confidence Plunges As Inflation Worsens (UMich Conditions For Buying Homes Declines To 70)

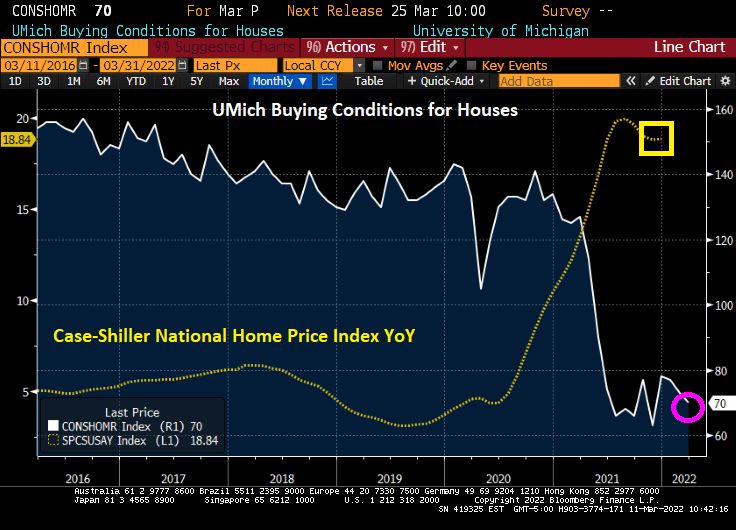
As inflation worsens, the University of Michigan survey of consumers fell again as US inflation worsens.

On the housing front, buying conditions for houses fell to 70 as a result of soaring home prices.

MY confidence in Biden and Congress has certainly declined.

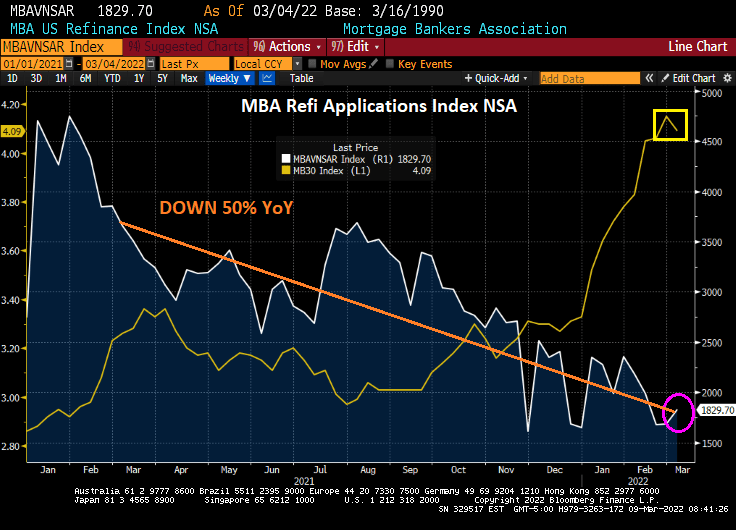
MBA Mortgage Purchase Applications Rise 11%, Refi Applications Rise 9% From Previous Week, But Refi Apps Still Down 50% From Same Week Last Year (10Y-2Y Treasury Curve Continues To Flatten)

The mayhem caused by the Russian invasion of Ukraine is helping drive down interest rates … for the time being … and this is helping push down mortgage rates and increase mortgage applications.

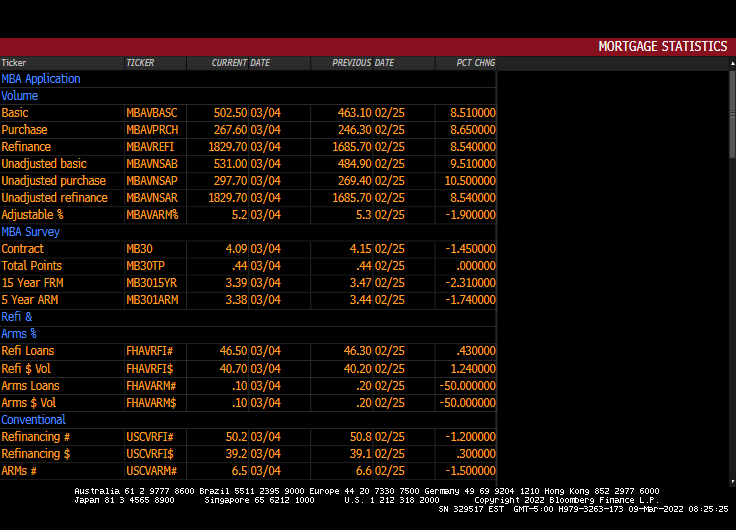
Mortgage applications increased 8.5 percent from one week earlier, according to data from the Mortgage Bankers Association’s (MBA) Weekly Mortgage Applications Survey for the week ending March 4, 2022.

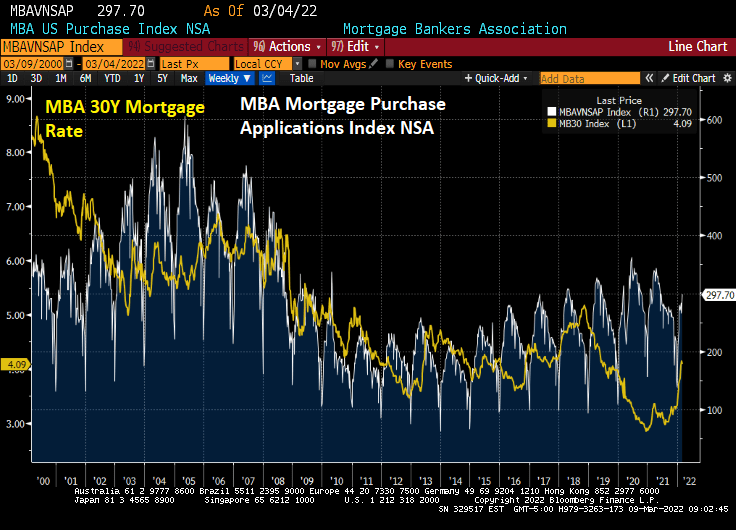
The seasonally adjusted Purchase Index increased 9 percent from one week earlier. The unadjusted Purchase Index increased 11 percent compared with the previous week and was 7 percent lower than the same week one year ago.

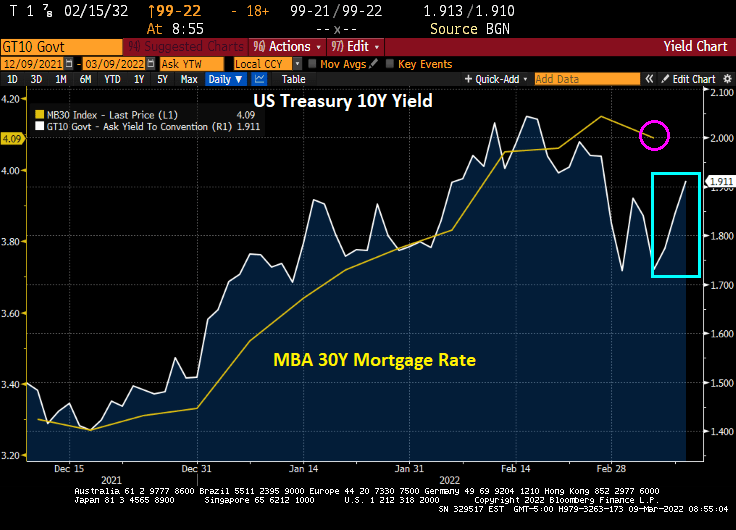
The Refinance Index increased 9 percent from the previous week and was 50 percent lower than the same week one year ago. Diane Olick at CNBC has the hilarious headline “Brief drop in mortgage rates sparks mini refinance boom.” The slight rise in refi applications from the previous week is more of a firecracker going off than a boom given that refi apps are still down 50% from the same week last year.

Bear in mind that the US Treasury 10-year yield is up since the MBA’s reporting week ended on March 4, 2022. So, look for Olick’s mini-refi boom to end as quickly as it started.

Here is the rest of the MBA story.

The MBA Mortgage Purchase applications index typically peaks in mid-to-late April, so we still have another month (seasonality) until purchase applications begin declining again.

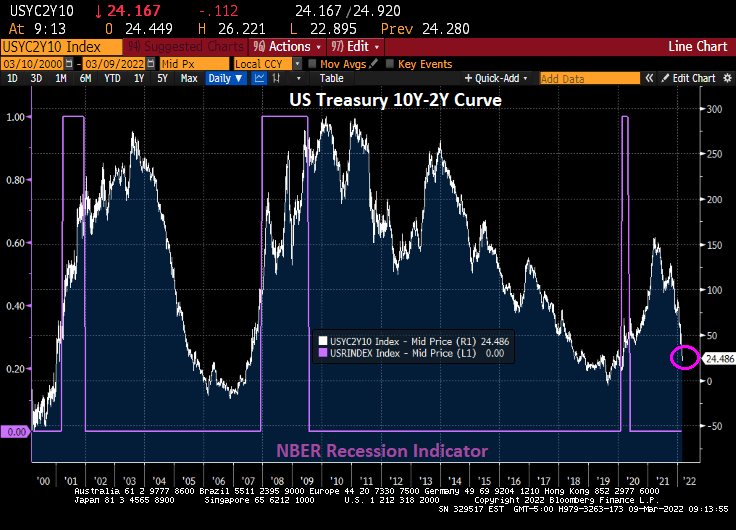
The US Treasury 10Y-2Y curve continues to flatten and is the worst curve recovery in modern history.

The general rise in US mortgage rates is more closely tied to expectations of Fed rate increases than Fed Agency MBS holdings.

Feeling Hot, Hot, Hot! US Home Prices Grew At 19.1% YoY In January (Is US Housing Market Addicted To Gov?)

Feeling hot, hot, hot!

Corelogic released their January housing report and its a doozy.

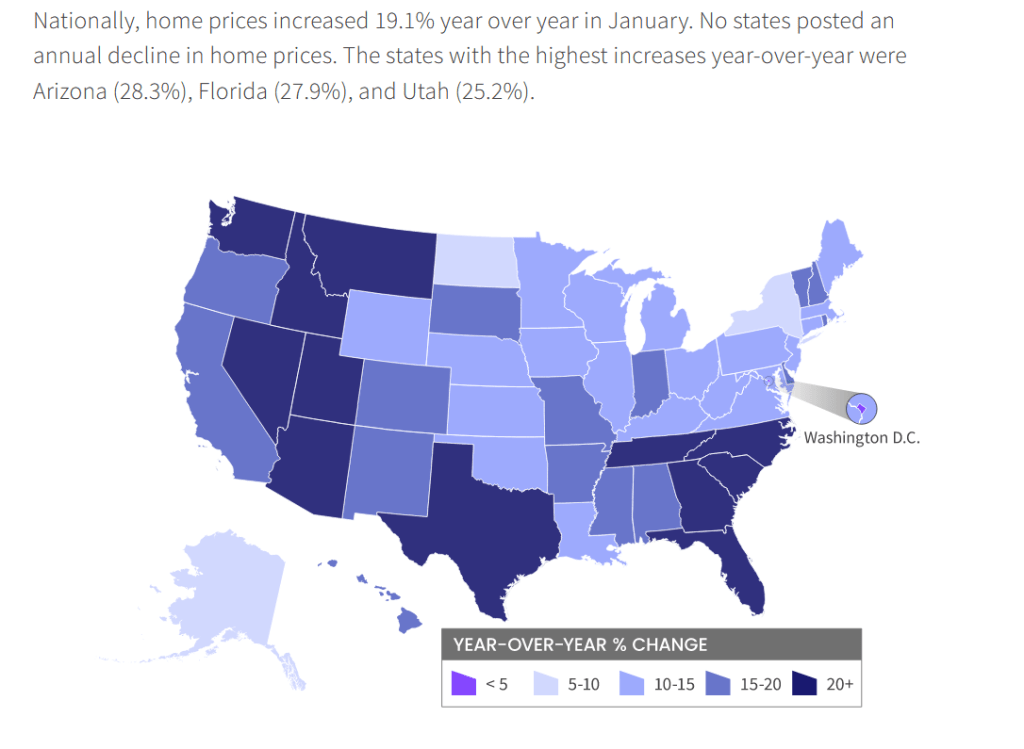
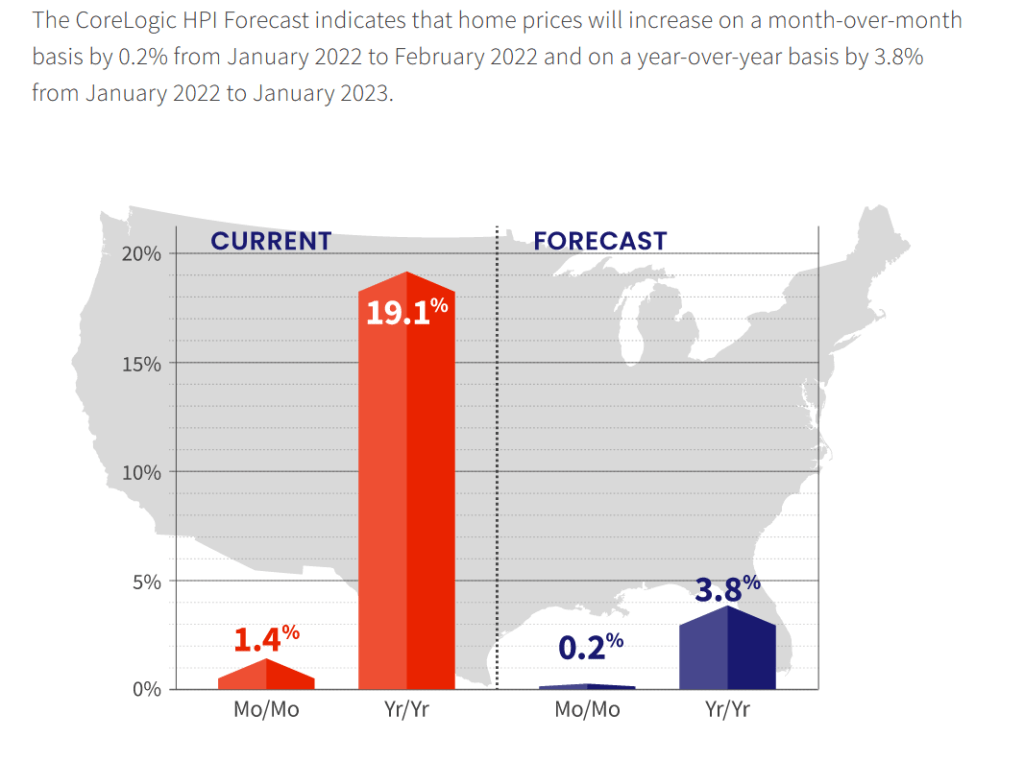
Home prices nationwide, including distressed sales, increased year over year by 19.1% in January 2022 compared with January 2021. On a month-over-month basis, home prices increased by 1.4% in January 2022 compared with December 2021 (revisions with public records data are standard, and to ensure accuracy, CoreLogic incorporates the newly released public data to provide updated results).

But Corelogic is still forecasting only 3.8% YoY growth in 2022.

Home prices are hot, hot, hot in all states except North Dakota and New York. The fastest growing states are lower taxes, higher growth states.

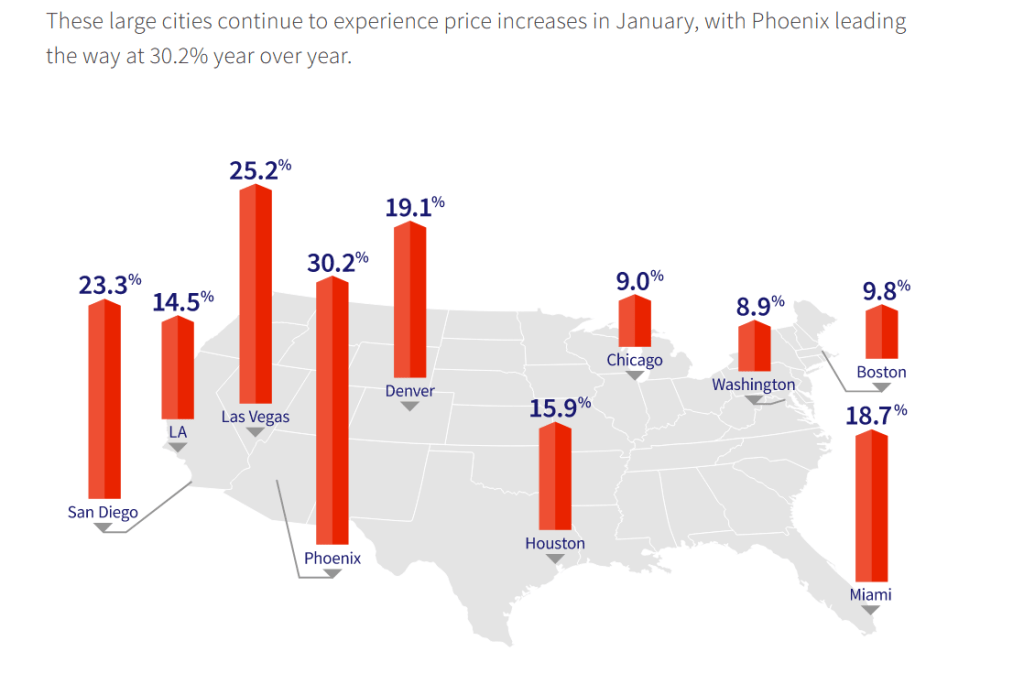
Phoenix, Las Vegas and San Diego are booming. But Chicago and Washington DC are growing at near 9% YoY.

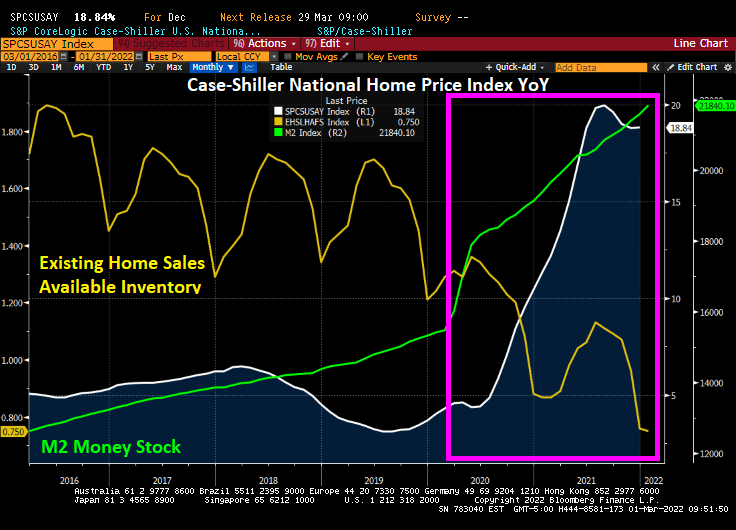
Case-Shiller’s December report show home prices growing at 18.84% YoY thanks to Fed stimulypto and historic low inventory of homes available for sale.

Is the US housing market addicted to gov?

Let’s see if the five expected rate hikes from The Fed materialize.

US 30-year Mortgage Rate Rises To 4.30% As 10-year Treasury Yield Plunges -8.2 BPS (Eurozone Yields Dropping Like A Rock)

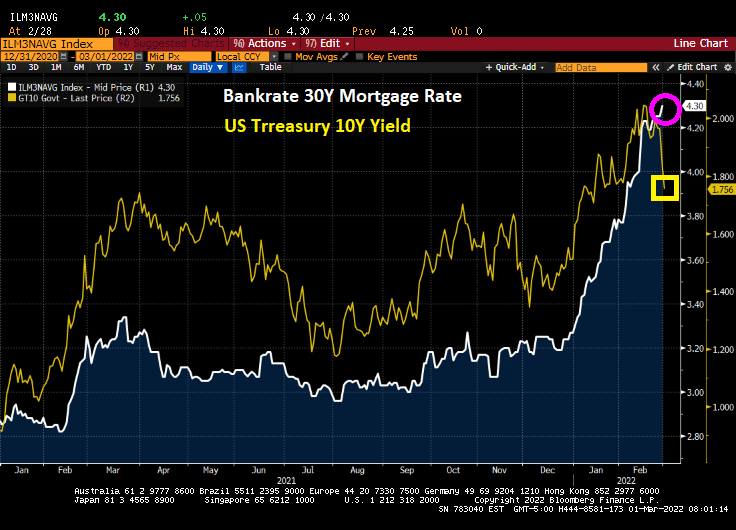
As someone who needs to move to Ohio, I would really appreciate it if mortgage rates would more closely follow the 10-year Treasury yield. But alas, Bankrate’s 30-year mortgage rate just rose to 4.30% as the US Treasury 10-year yield dropped -8.2 basis points.

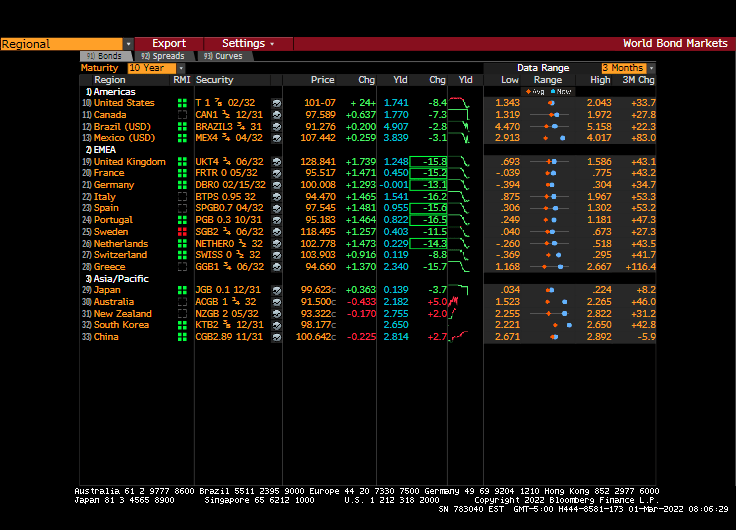
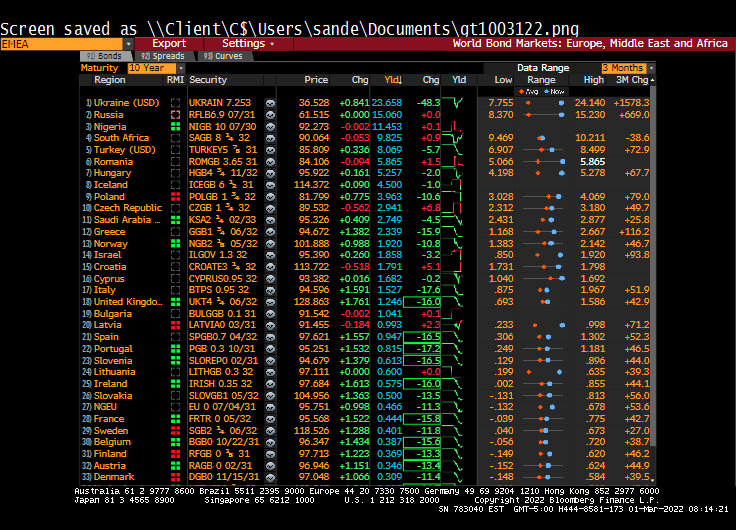
Europe. Middle East and Africa (EMEA) sovereign yields are all down over 10 basis points averaging around -15 bps.

Ukraine’s 10-year yield has plummeted by -48.3 bps this morning.

The anticipated meeting between Russia and Ukraine on Belarus soil was a failure. Likely due to Belarus showing-off their modern air force capabilities.