The National Association of Home Builders market index fell more than expected in September to 46, the lowest reading since 2012 (if I exclude the Covid economic shutdown).
Note that the NAHB market index is declining along with at the increase in the 30yr mortgage rate.
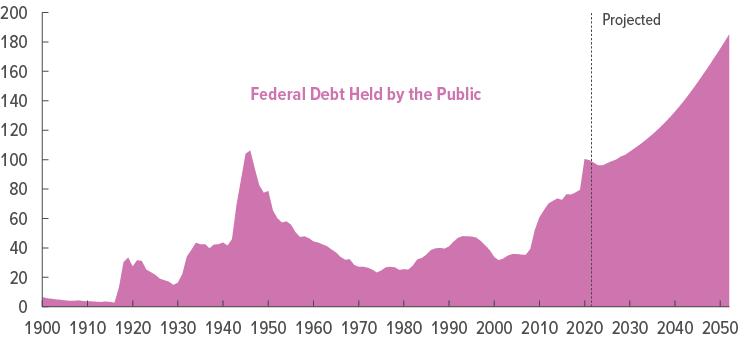
The Federal Reserve’s Open Market Committee (FOMC) will announce their latest round of rate increases on Wednesday, September 21st, at 2pm EST. Will the members of the FOMC discuss the fact that the US debt load is now at a whopping 123% of GDP?? Or will the FOMC only discuss inflation in its deliberations?
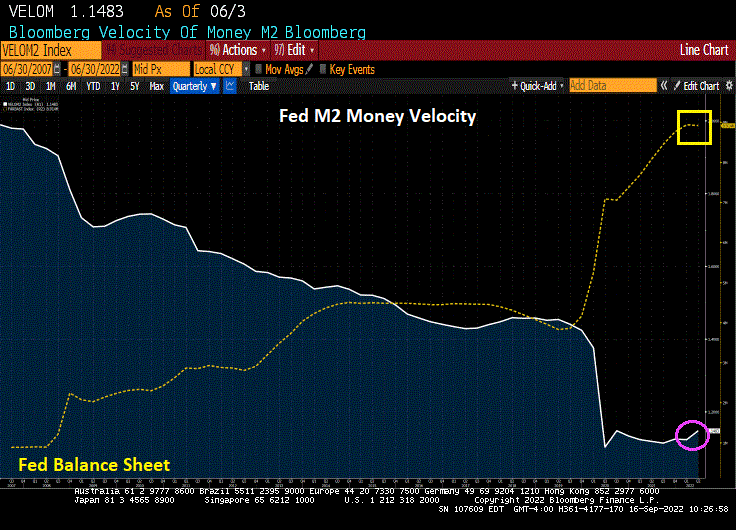
The Fed is expected to raise the upper-bound of their target rate to 3.25%, a 75 basis point increase in a futile attempt to cool inflation. Yet the rampant spending by Biden, Pelosi and Schumer (3 of the 4 Horsemen of the Economic Apocalypse) has raised the Federal Debt to GDP ratio to 123%. Even more disturbing, M2 Money Velocity (GDP/M2 Money) is near the all-time low. Meaning that rampant Federal spending is doing little to increase GDP.
Its a beautiful morning here in Columbus Ohio! Unfortunately, things are not so beautiful for the US economy.
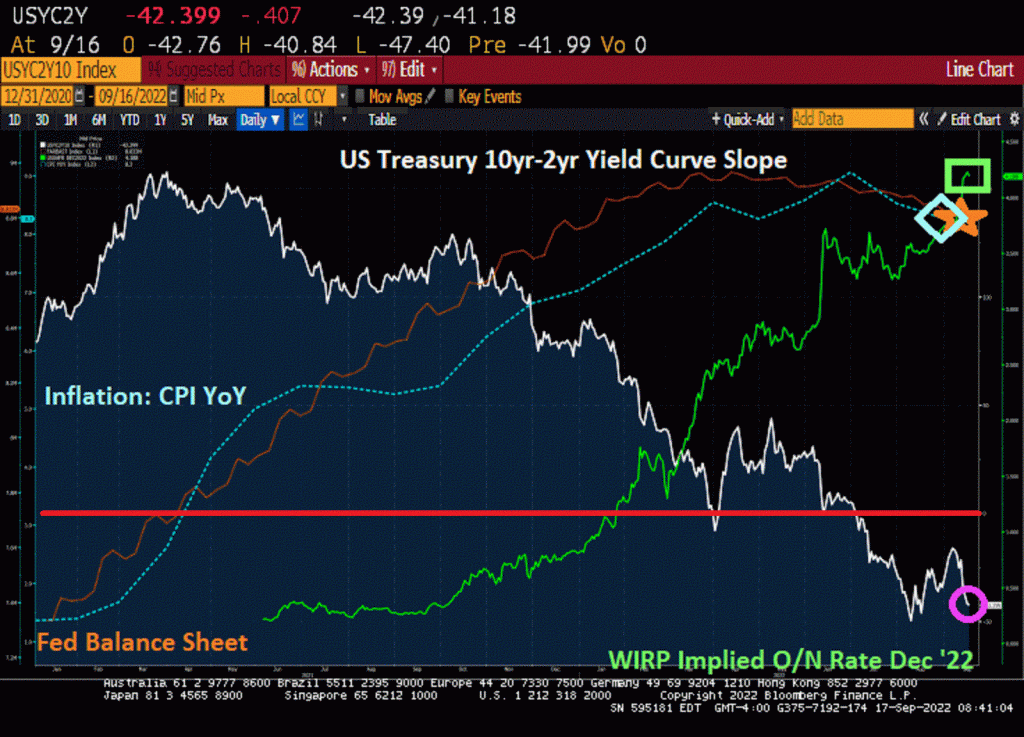
Let’s begin with the US Treasury 10yr-2yr yield curve slope. Historically, the yield curve inverts prior to a recession. As of this sunny morning, the US Treasury yield curve is inverted and sinking further into inversion. Notice that headline inflation (blue line) has increased declined slightly after hitting 40-year highs as The Federal Reserve begins SLOWLY trimming their balance sheet (orange line). The green line is the expectation of Fed rate hikes by the December 2022 FOMC meeting indicating further monetary tightening.
Goldman Sachs Group Inc. cut its US economic growth estimates for 2023 after recently boosting its predictions for Federal Reserve interest rate hikes.
US gross domestic product will increase 1.1% in 2023, economists including Jan Hatzius wrote in a note Friday, compared with a forecast of 1.5% previously. The projection for 2022 was left unchanged at 0%.
Goldman raised its federal funds rate forecast by 75 basis points over the last two weeks for a terminal rate forecast of 4% to 4.25% by the end of 2022.
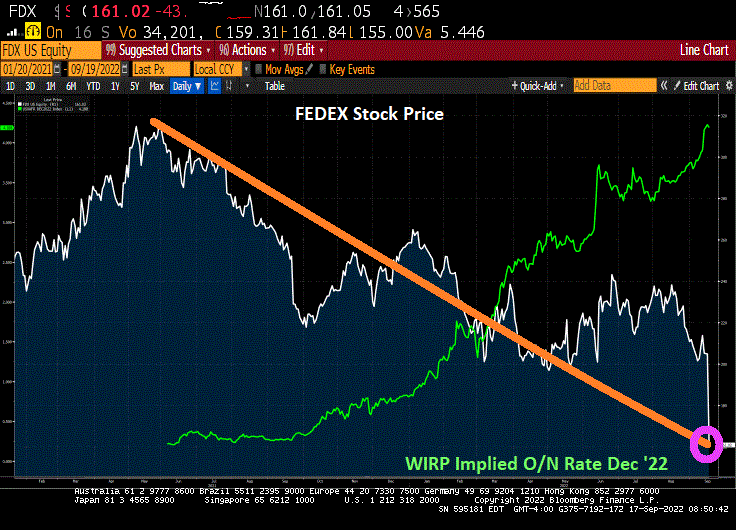
Then we have Federal Express which plunged -43.85 points on Friday. I use this an example on how inflation begat Fed tightening that begat an economic slowdown.
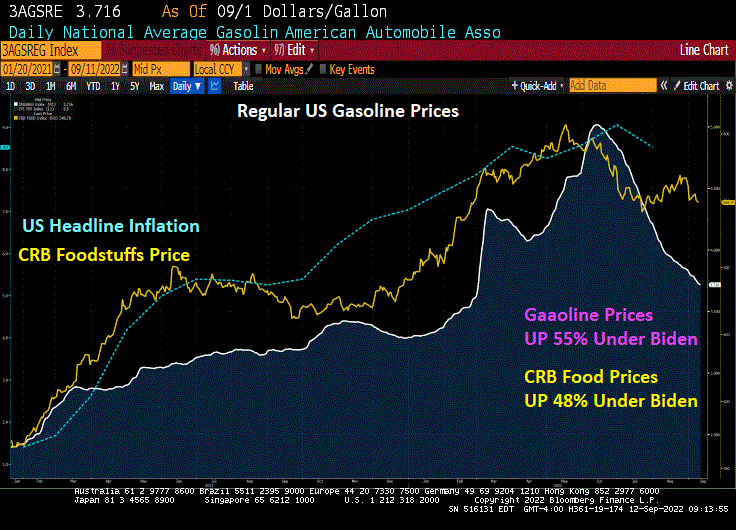
The Biden Administration is cheering the “Inflation Reduction Act” and the recent decline in the rate of inflation to a gut-wrenching 8.3% YoY. Bear in mind that since Biden was sworn-in as President, WTI Crude Oil is UP 75%, gasoline prices UP 54%, food prices are UP 48% and the Strategic Petroleum Reserve is DOWN -32%.
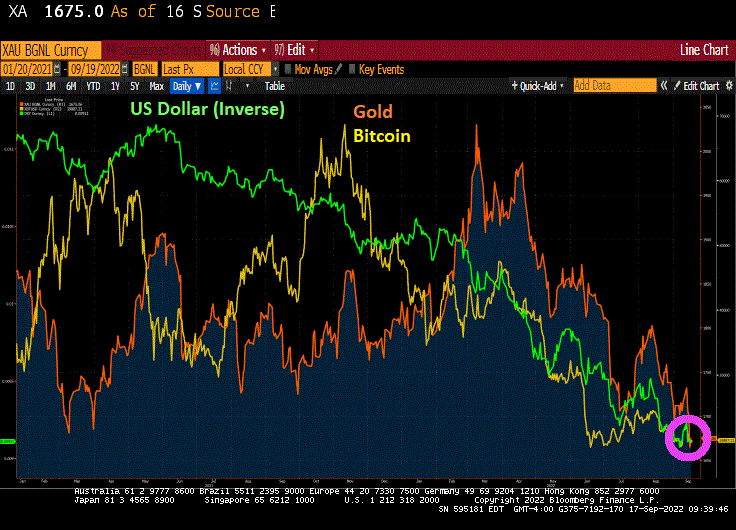
Then we have Gold and Bitcoin relative to the INVERSE of the US Dollar since Biden was installed as President.
As inflation rages thanks to Biden’s energy policies and insane Federal spending, The Federal Reserve is trying to cool inflation (or Bidenflation).
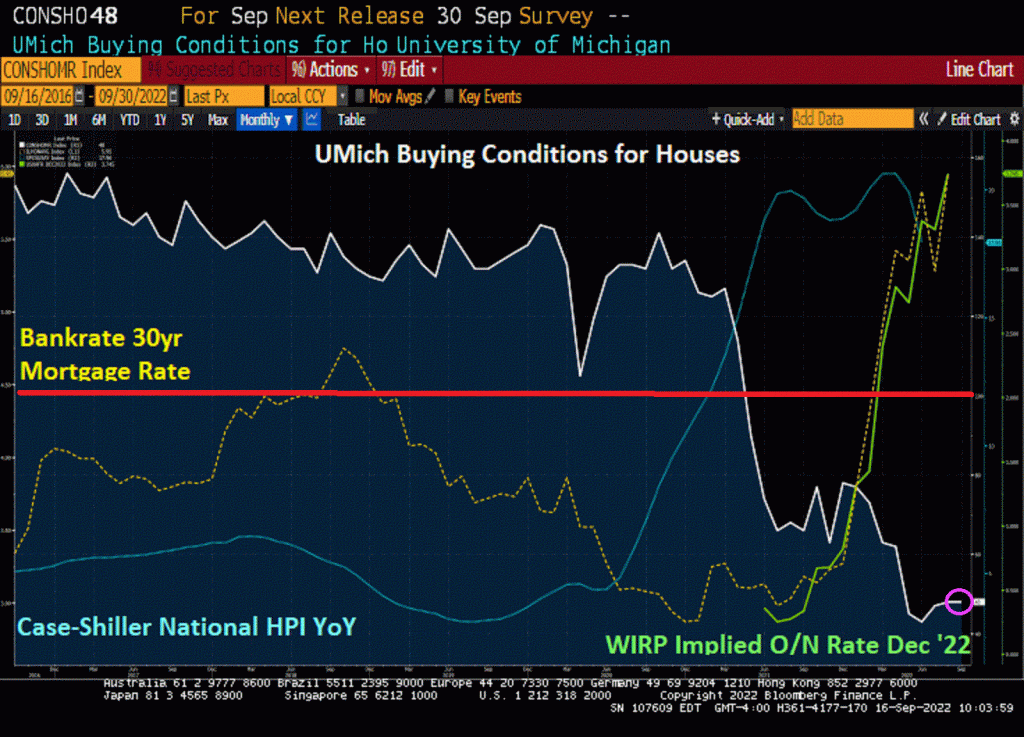
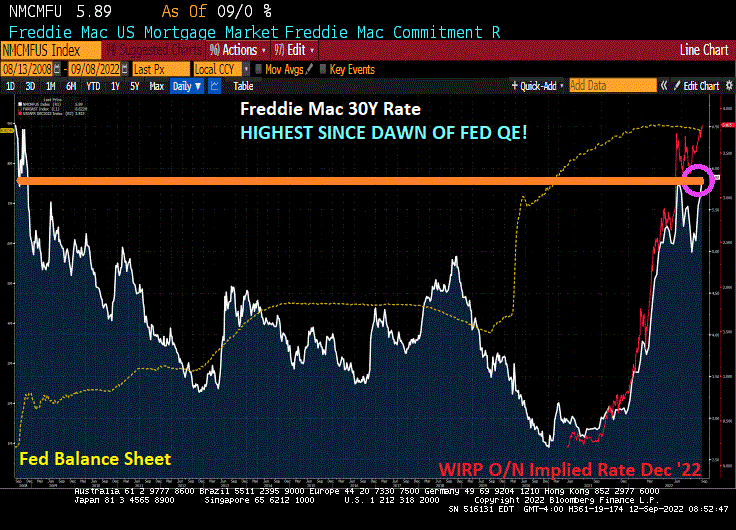
As The Fed tightens, the 30-year mortgage rate has risen to 14 year highs. And home prices are still hot, hot, hot (though slowing). But consumer sentiment for housing remains in the doldrums (UMich Buying Conditions For Houses).
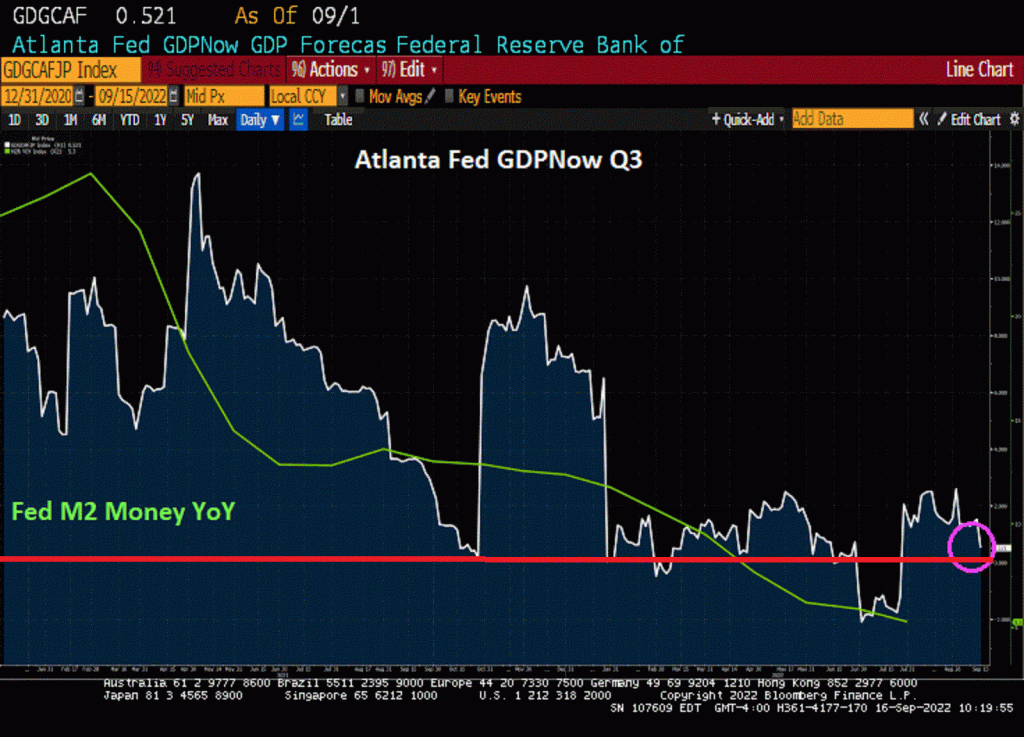
The good news? Atlanta Fed’s GDPNow real-time GDP tracker shows the US economy at positive growth of 0.521%. Ok, that is kind of lousy given the massive Fed stimulus and Federal spending since Covid.
M2 money velocity demonstrates the lousy return of Fed/Federal government “investment”.Near the lowest level in US history.
So, The Fed will have to destroy the US economy to save us from Bidenflation (bad energy policies and out-of-control Federal spending).
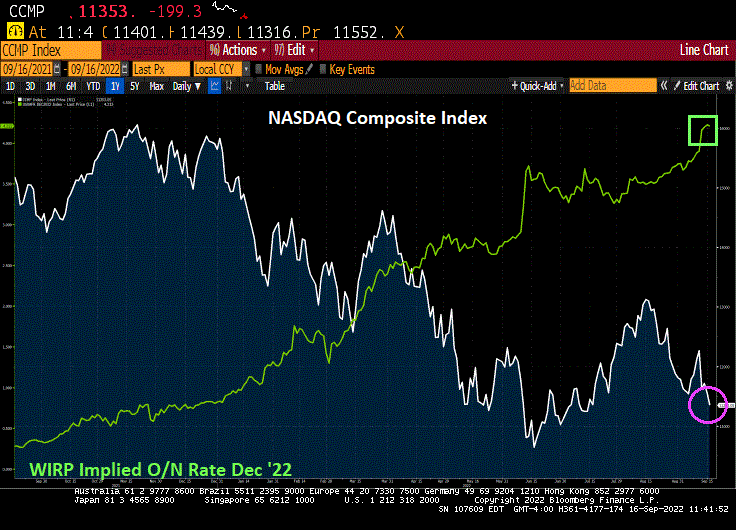
And more good news! The NASDAQ composite index is down only -1% today!
The Philadelphia Fed Business Outlook fell almost -10% in September as The Federal Reserve tightens monetary policy.
On a related note, the share of total net worth held by the bottom 50% in the US (red line) was always higher than the share of total net worth held by the top 1% (blue line) … until The Federal Reserve began QE in late 2008. Under Obama, the top 1% surpassed the bottom 50% in terms of share of total net worth. it equalized under Trump and before Covid. Then the massive QE (and surge in Federal spending) to battle Covid seemingly made the rich even richer and the bottom 50% even poorer. This is Biden’s America … massive Federal subsidies to the wealthy, crumbs for the bottom 50%.
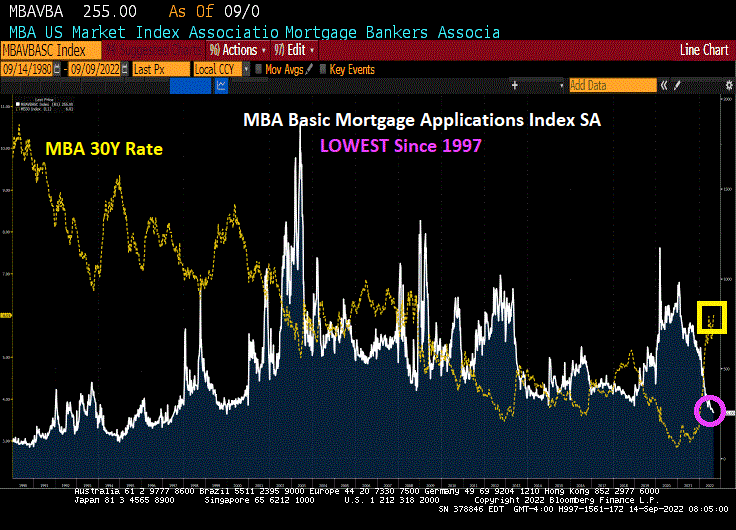
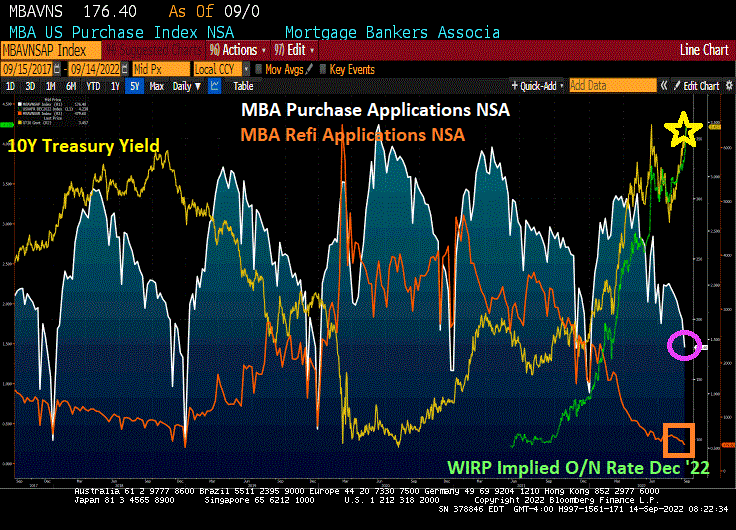
US mortgage applications dropped to the lowest level since 1997. I wonder if President Biden will invite boring crooner James Taylor back to the White House to sing about the collapsing mortgage market? Perhaps he can sing “Shower The People” and change the lyrics to “Shower ON The People.”
Mortgage applications decreased 1.2 percent from one week earlier, according to data from the Mortgage Bankers Association’s (MBA) Weekly Mortgage Applications Survey for the week ending September 9, 2022. This week’s results include an adjustment for the observance of Labor Day. The Refinance Index decreased 4 percent from the previous week and was 83 percent lower than the same week one year ago. The seasonally adjusted Purchase Index increased 0.2 percent from one week earlier. The unadjusted Purchase Index decreased 12 percent compared with the previous week and was 29 percent lower than the same week one year ago.
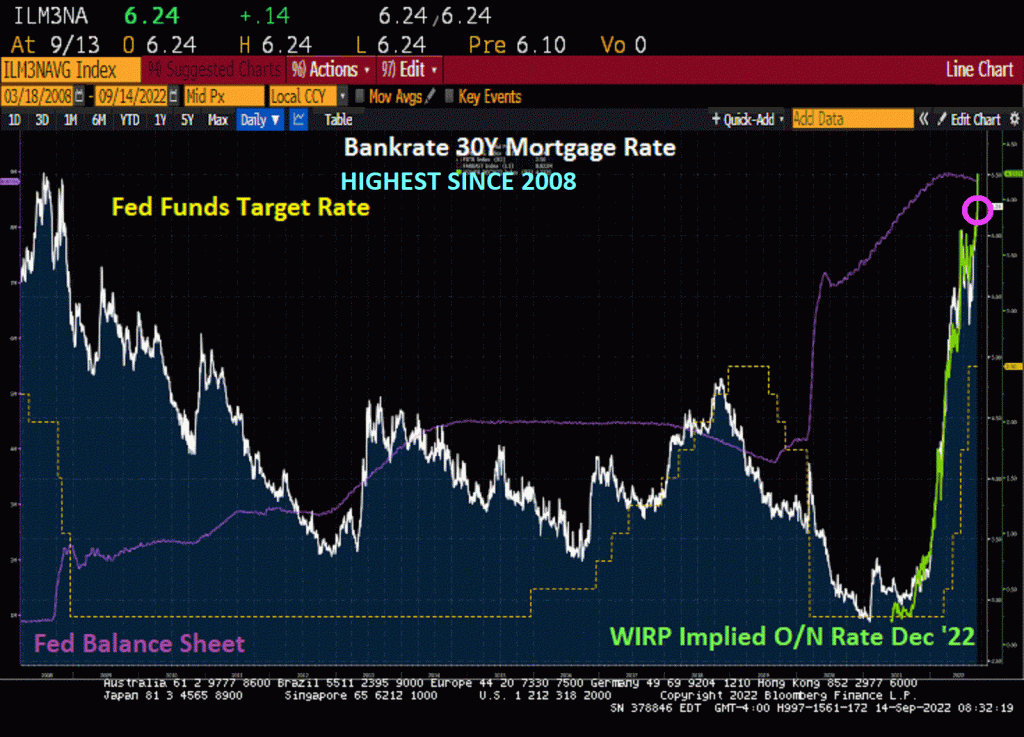
The Bankrate 30-year mortgage rate is now at the highest level since 2008 at the advent of Fed’s QE.
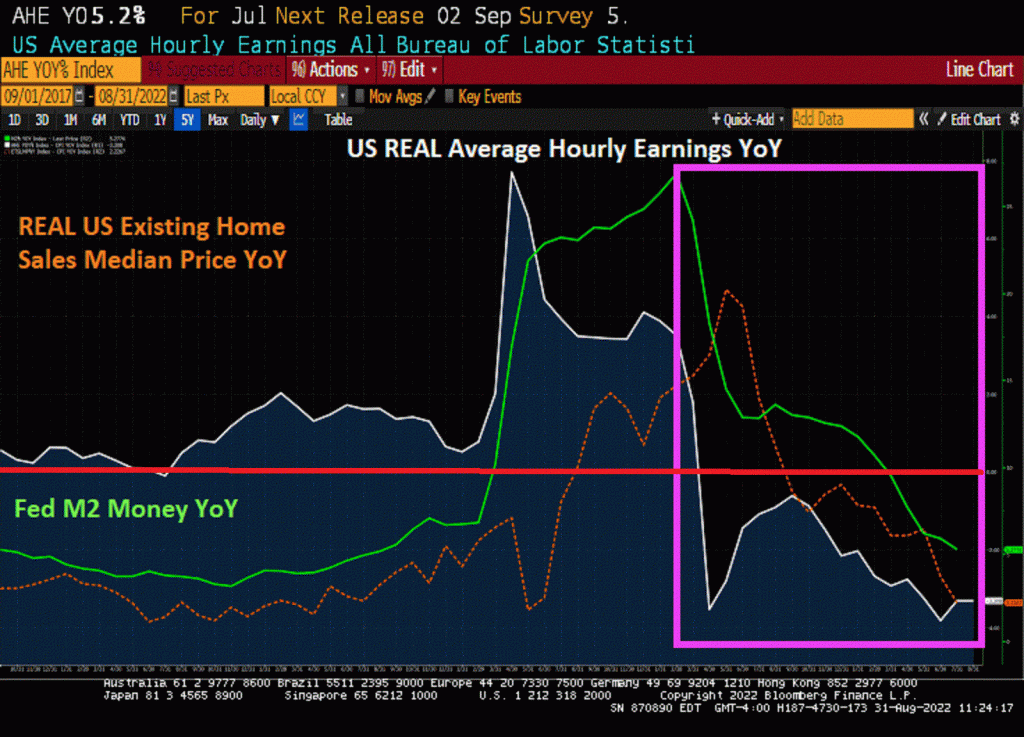
REAL average hourly earnings growth remain in the toilet at -3.06% YoY.
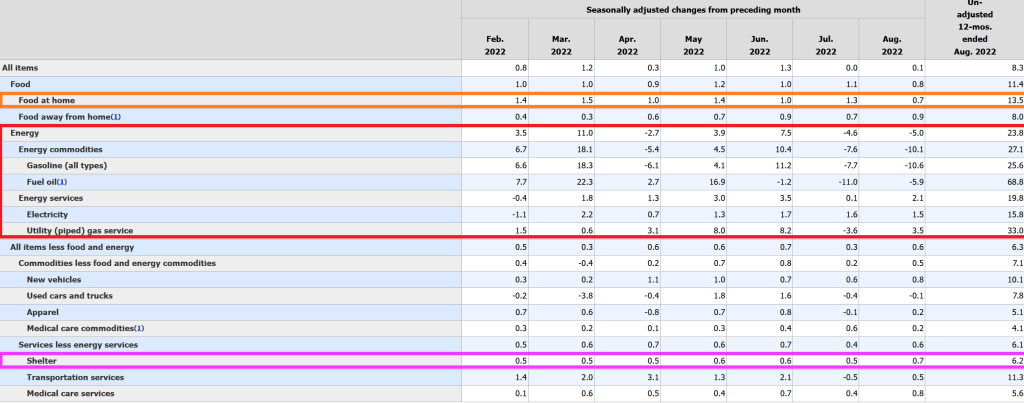
Fuel oil used to heat homes rose 68.8% YoY. Food at home rose 13.5% YoY while rent (shelter) rose “only” 6.2% YoY. Wow, renters are REALLY getting the short-end of the stick from The Fed and the Biden Administration!!
New vehicles are UP 10.1% YoY. Good luck buying those “cheap” electric cars that Mayor Pete Buttigieg trumpets! And wait for the bill when the battery needs to be replaced!!!
Freddie Mac’s 30-year mortgage commitment rate just rose to its highest level since … The Fed initiated Quantitative Easing (aka, fanatical money printing) during the financial crisis.
The good news? The US inflation report is likely to show a slowing of the inflation rate to around 8% YoY and -0.1% MoM. Why? Gasoline prices are cooling thanks to the global economic slowdown.
While gasoline and food prices are falling, CORE US inflation, the inflation rate excluding food and energy, is expected to rise to around 6.1% YoY and +0.30% for August.
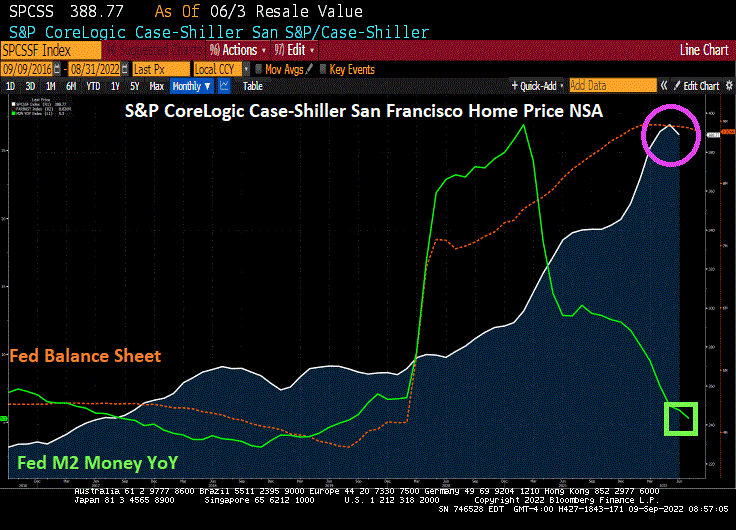
The US housing market is facing stress thanks to The Federal Reserve’s “war on inflation.” As The Fed starts trimming its excess ballast and M2 Money growth YoY slows to the lowest since Pre-Covid, we are seeing housing markets like San Francisco beginning to experience declines in home prices.
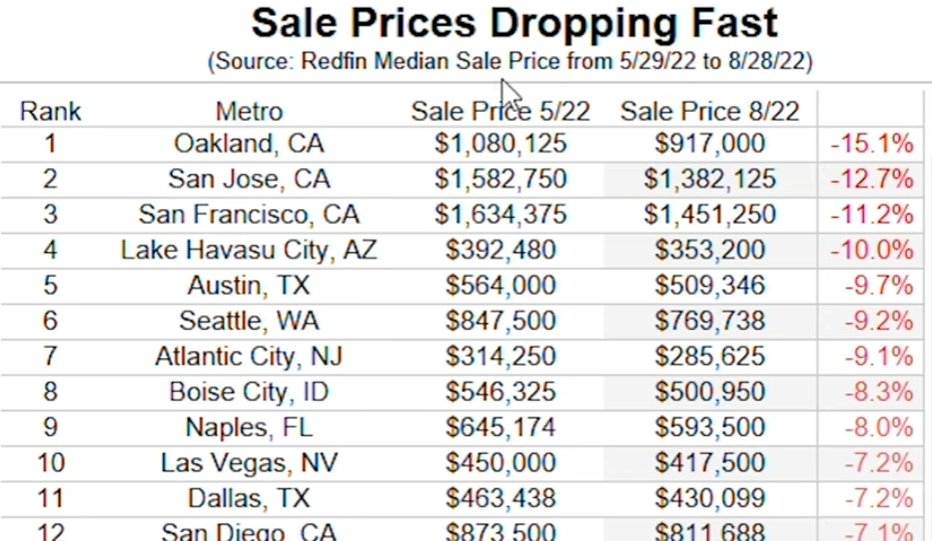
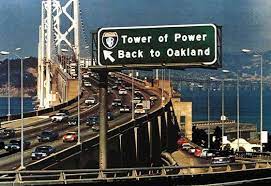
According to Redfin, Oakland California is leading the nation in terms of declining sales prices at -15.1% over a 3 month period. Followed by Silicon Valley and San Jose at -12.7%. San Francisco is in third place at -11.2% (I will ignore Lake Havasu AZ since it is teeny but does have one of the London Bridges) and Austin TX is in 5th place at -9.7%.
When inflation is so bad that REAL wage growth is negative (-3.31% YoY), I would hardly call that a strong economy for the middle class and low-wage workers.
We also see that REAL home price growth (existing home sales median price YoY – CPI YoY) has slowed to only 2.23% YoY in July.
As The Fed tightens, it is only growing to get worse.
















You must be logged in to post a comment.