The Fed Boogie! Homes Above $800,000 Drive Bidding Wars in U.S. Housing Market As Fed’s Stimulypto Persists

Massive Federal stimulus (both fiscal and monetary) have led to bidding wars among the wealthiest Americans. Despite clamoring for The Fed to increase rates and speed-up the shrinking of The Fed’s balance sheet, nothing has happened … yet.

(Bloomberg) — Home buyers willing to spend almost a $1 million are competing the most for a piece of the red-hot U.S. housing market.

Homes priced between $800,000 and $1 million saw the highest rate of bidding wars at 64.6%, followed by 62% for homes between $1 million to $1.5 million and 61.7% for homes above $1.5 million, according to December data from Redfin Corp.

“Buyers should anticipate that they may not win a house until their sixth or seventh bid,” Candace Evans, a Redfin team manager in New York, said in a statement. “If you’re the type of person who falls in love with a house, this is not your market.”
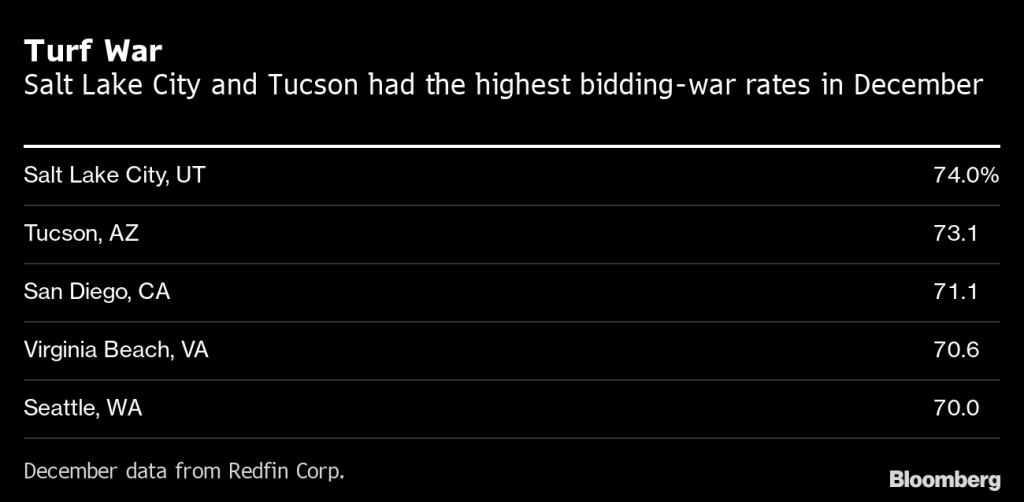
Salt Lake City had the highest bidding-war rate of 37 U.S. metropolitan areas analyzed, with 74% of offers facing competition in December, the firm said. Tucson had a 73.1% bidding-war rate and followed by 71.1% for San Diego.

Prospective buyers are competing for homes as relatively cheap mortgage rates and a proliferation of remote-working opportunities in the wake of the Covid-19 pandemic boost demand for homes in smaller cities. The number of available homes in several of the hottest markets continue to shrink. 

Nearly 60% of home offers written by Redfin agents across the U.S. faced competing bids in December, the firm said. It was the lowest rate in 12 months but an increase from 54% in December 2020 as pandemic-driven demand for housing remains strong.

Vacation homes, which are often pricey and have increased in popularity due to Covid-19, may have contributed to bidding wars in the high-end market, Redfin said. Townhouses had a bidding-war rate of 62% followed by 61.3% for single-family homes, the firm said.

Now its a race against the clock as potential home buyers try to beat Powell and the Gang as they raise mortgages rates.
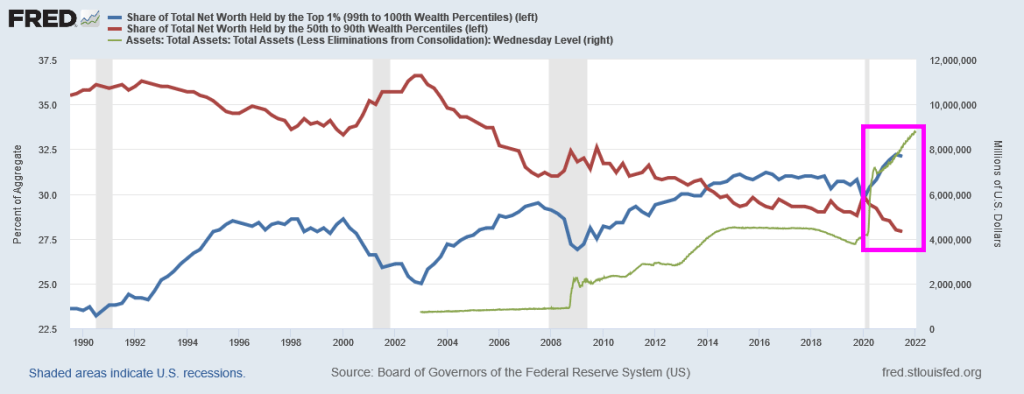
Yes, Federal stimulus has made the top 1% increase their share of total net worth that includes $800,000+ homes.
Try to calm down and listen to Torquay by The Leftovers. Or listen to Danse Fed.

The Empire Strikes Out! Empire Manufacturing Index Slumps To Negative Territory As Inflation Roars (WTI Crude Futures UP 79% Since Jan 1st)

Well, Omicron is hitting hard. Not the virus itself, but governments’ reaction to the virus. The NY Empire Manufacturing Index has tanked into negative territory.

New orders are down 5%.

On the energy front, West Texas Intermediate Crude Oil futures are up 79% since January 1, 2021 while regular gasoline prices are up “only” 50% over the same period.

How about inflation and the Treasury yield curve? Inflation has soared to 40-year highs under Biden as energy prices (WTI Crude Futures) have soared 79%.

Container ships are still backed-up at LA and Long Beach ports. I thought Mayor Pete was supposed to fix the port congestion problem!

Maybe they should play the Darth Vader theme when Biden goes to the podium to stammer.

Fed Gravy Train? Top 1% Net Worth Share SOARING With Federal Stimulypto, Near Highest In History (Bottom 50% Net Worth Share Lowest In History)

Since the 2020 Covid outbreak, the top 1% have been on the Stimulypto gravy train. The top 1% in terms of share of total net worth (blue line) is near the all-time high while the bottom 50% share of total net worth (red line) is at the all-time low.

So, you thought all that Covid relief spending along with Fed monetary stimulus would help the bottom 50%?

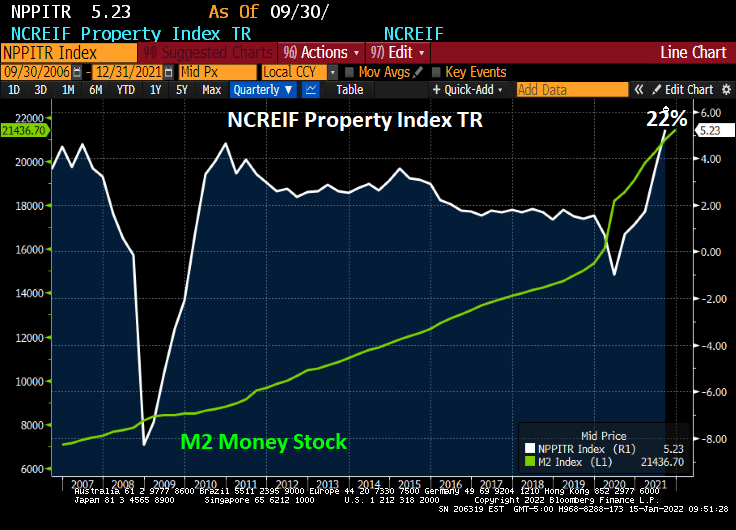
Inflation Nation! Commercial Real Estate Returns UP 22% YoY For Q4 2021 (Versus 19.66% YoY For Case-Shiller National Home Price Index)

Inflation is burning out of control. While home price growth has been off the cherts (as Jean-Ralphio would say), commercial real estate has jumped incredibly at 22% YoY. The Bloomberg charting function hasn’t updated for the Q4 NCREIF report yet so I had to manually write-in 22% on the following chart.

To quote Dean Martin, “Ain’t that a kick in the head.” Commercial real estate returns are now higher than house price growth.

So, what will happen IF The Fed follows through with its monetary stimulus reduction? JPMC’s Jaime Dimon warns that The Fed could hike 7 times in 2022 and not be ‘sweet and gentle’.

But The Fed seems to be stuck in underworld and doing a terrible job at signalling their intentions if Dimon thinks that The Fed could raise rates 7 times in 2022.

People Get Ready! Value Stocks UP For 2022 While Growth Stocks DOWN (As Fed Expected To Withdraw COVID Stimulus)

People Get Ready! There’s a train a coming. Its called The Federal Reserve.

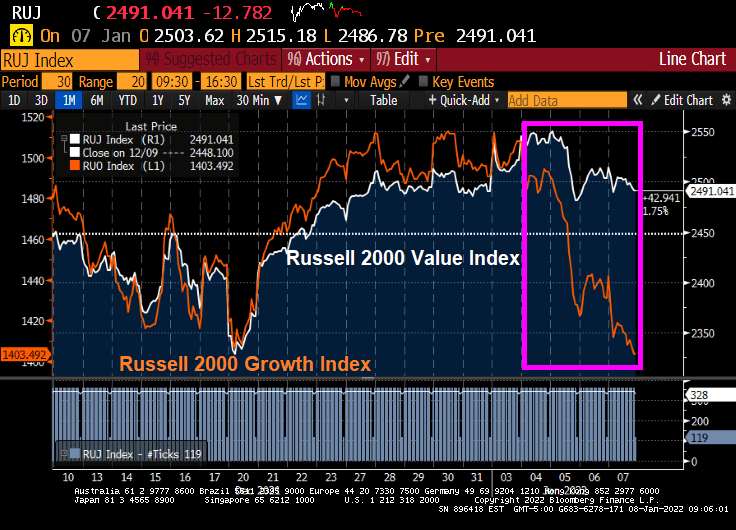
The market is pricing in 3 rate increases in 2022. And perhaps a faster than expected withdrawal of balance sheet stimulus.

As a result, The Russell 2000 Growth index is plunging (orange line) relative to the Russell 2000 Value index (white line) which is down in 2021.

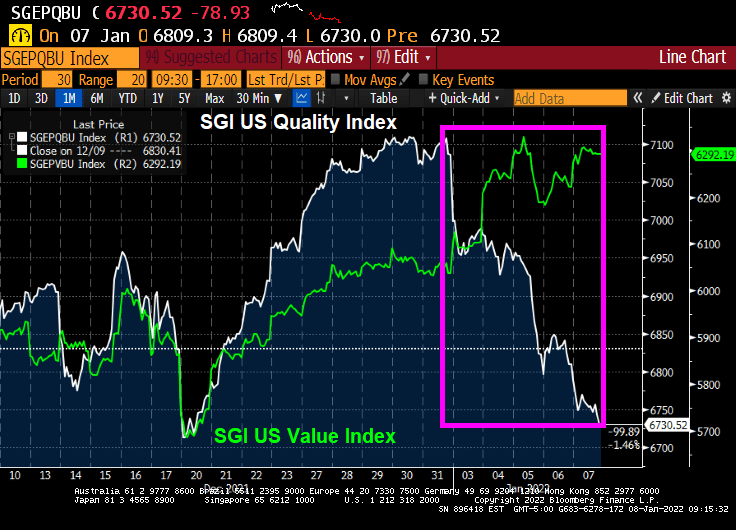
The Société Générale (SGI) US value and “quality” indices are telling the same story. The SGI US “Quality” index is falling like a paralyzed falcon while the SGI US Value index is up for 2022.

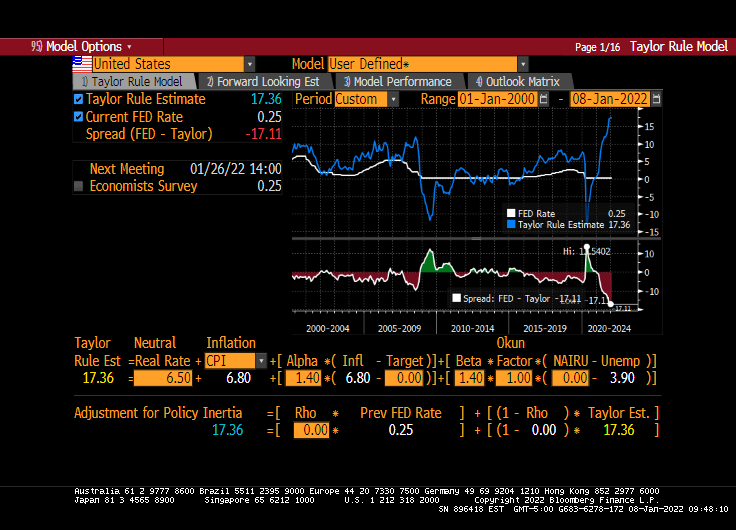
It is somewhat mystifying that markets would be soooooo sensitive to 3 rate increases from The Fed, particularly since the Taylor Rule suggests that The Fed’s target rate should be 17.36%. Even if you don’t like the Taylor Rule or disagree with its inputs, you must admit that the gap between where The Fed is (0.25%) and where they should be (17.36%) is … k-razy.

But here is where we sit.

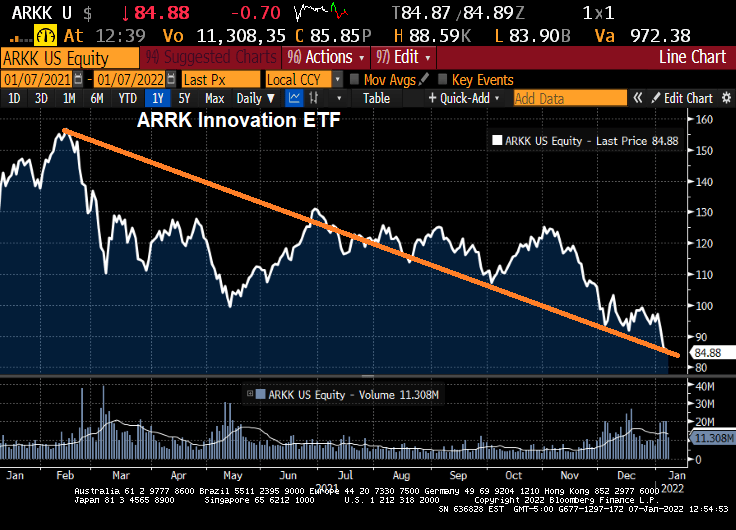
Is ARKK A Dog? ARRK Innovation ETF Down 46% Since Fed 12 (BARKK?)

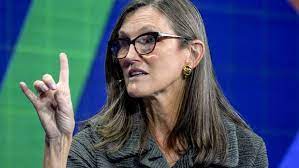
Is Cathie Wood’s flagship fund a dog? Maybe she should rename it BARKK.

ARRK Innovation ETF is down 46% since Feb 12, 2021.

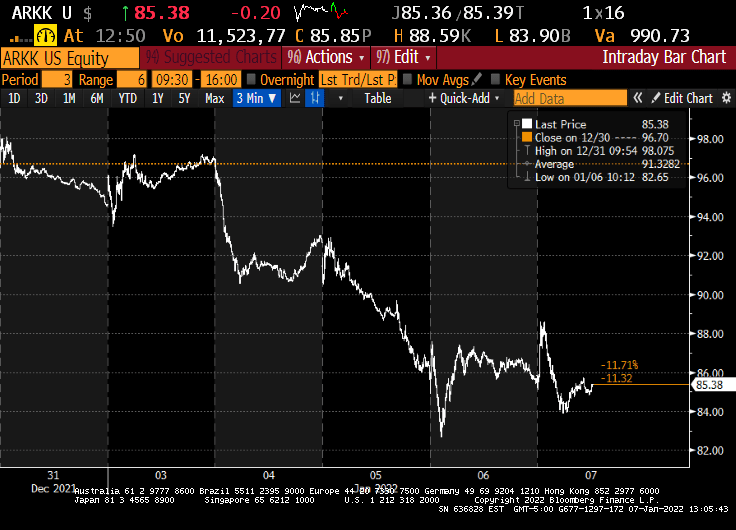
And this year? Same ETF, same dog.

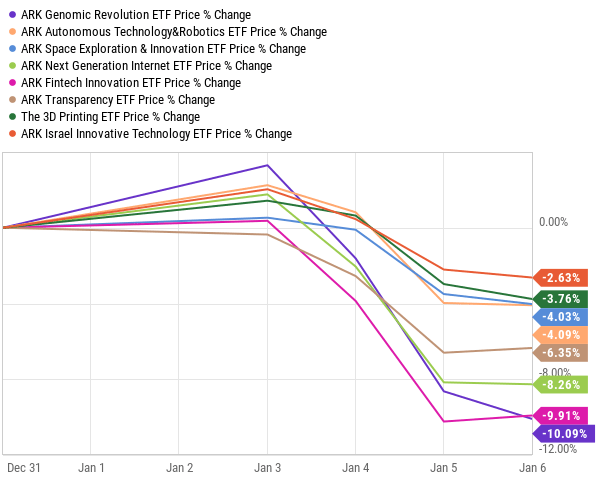
The ARK universe should be renamed the BARK universe.

Way to go Cathie!

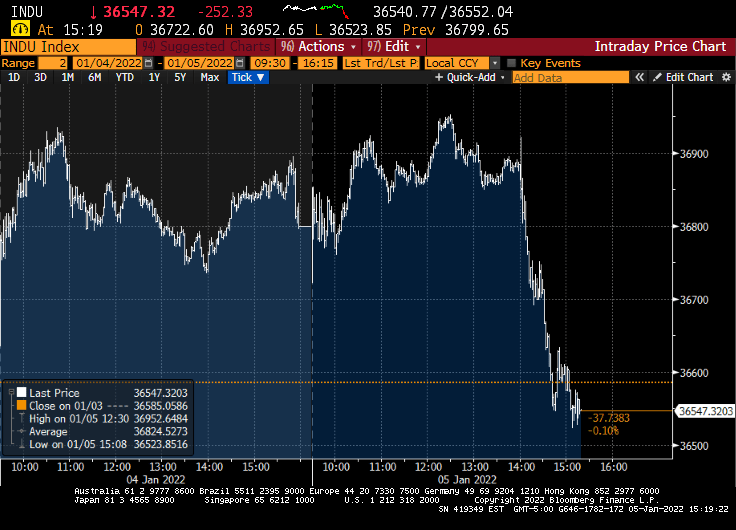
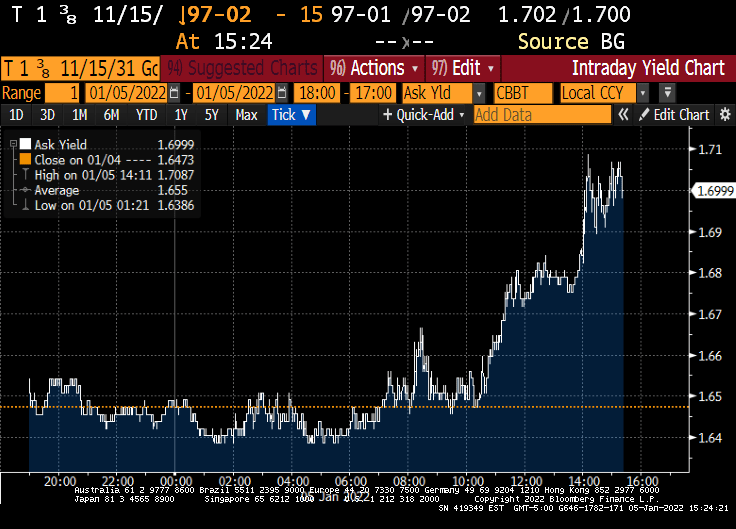
Fed Minutes Flag Chance of Earlier Hikes, Balance-Sheet Rundown (When Jay Powell Speaks, People Listen [Dow Drops, 10Y T-yield Increases])

Federal Reserve officials said a strengthening economy and higher inflation could lead to earlier and faster interest-rate increases than previously expected, with some policy makers also favoring starting to shrink the balance sheet soon after.

“Participants generally noted that, given their individual outlooks for the economy, the labor market, and inflation, it may become warranted to increase the federal funds rate sooner or at a faster pace than participants had earlier anticipated,” according to minutes published Wednesday of the Dec. 14-15 meeting of the U.S. central bank’s policy-setting Federal Open Market Committee, when it pivoted to a more aggressive inflation-fighting stance.

“Some participants also noted that it could be appropriate to begin to reduce the size of the Federal Reserve’s balance sheet relatively soon after beginning to raise the federal funds rate,” the minutes said.

The S&P 500 stock index extended declines following the release and was on track for its biggest loss in more than a month. Treasuries also extended losses and the dollar pared its decline.

At the conclusion of the December meeting, the FOMC announced it would wind down the Fed’s bond-buying program at a faster pace than first outlined at the previous meeting in early November, citing rising risks from inflation. The new schedule puts the central bank on track to conclude purchases in March.

And with the minutes released, the Down dumped.

And the 10-year Treasury yield jumped 5.3 bps on the release.

When Jerome Powell speaks, people listen.

Tiny Or BIG Bubbles? Buffett Indicator, Shiller CAPE At Dangerous Levels Thanks To Fed And Their Champagne Policies

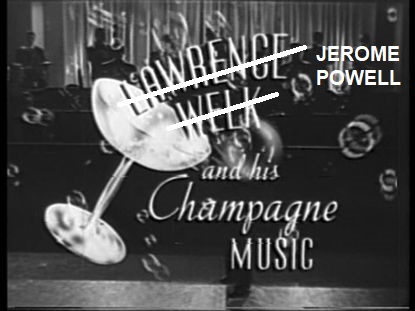
The Federal Reserve Open Market Committee meeting should have a Lawrence Welk bubble machine operating, particularly for their announcements.

When we look at the Buffett Indicator, we can see how The Federal Reserve’s loose monetary policies (or follycies) are driving up stocks to unsustainable levels that may not survive without The Fed’s “Do Ho Big Bubble Policies.”

How about the Shiller CAPE (Cyclically-adjusted Price/Earnings) ratio? While not up to dot.com levels yet, the Shiller CAPE ratio is climbing with the assistance of The Fed and their insane money printing.

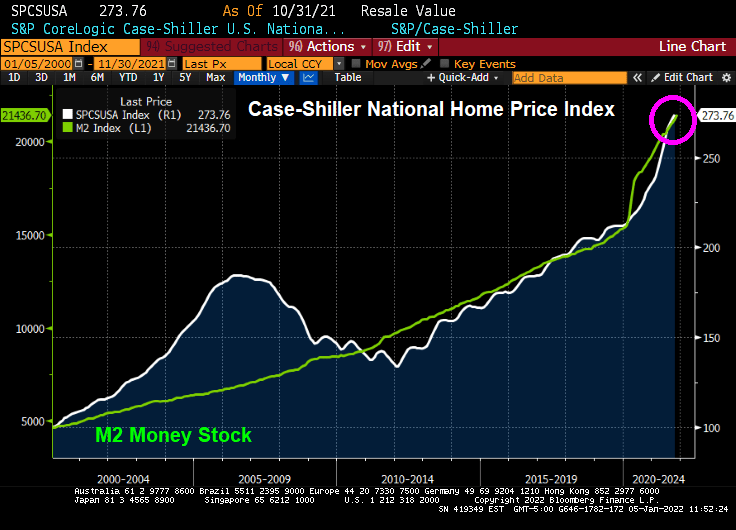
How about house prices? The Case-Shiller National home price index is far above the level last scene during the housing bubble of 2005-2007. Again, with a little help from The Federal Reserve.

I can’t wait to see how the equity market and housing market reacts IF The Fed actually follows through with reducing monetary stimulus. Probably not just adding more stimulus, just reinvesting the Treasury and MBS proceeds (aka, not shrinking the balance sheet).

Speaking of Lawrence Welk and his Champagne Music Makers, watch the blazing-hot electric guitar work worthy of Steve Morse or Jimmy Page in this video.

Here is the new logo for The Federal Reserve.

5-Year Treasury Yield Highest Since Fed COVID Intervention As Canada 10Y Rises 18.7 BPS (Gold, Bitcoin, Ethereum Rise)

Treasury yields rose a second day, with five-year rates hitting the highest since before the pandemic took hold in the U.S., amid increasing conviction that the Federal Reserve will raise rates at least three times beginning in May.

The five-year Treasury note’s yield climbed as much as 3.8 basis points to 1.392%, the highest since Feb. 20, 2020, while 30-year yields bumped up toward their 200-day moving average.

Yields across the curve are rising for a second straight day, after Monday’s selloff lifted the 10-year note’s yield by nearly 12 basis points in its worst start to a year since 2009. The two-year yield topped 0.80% for the first time since March 2020.

At the 10-year mark, we see Canada’s sovereign notes rising 18.7 basis points.

Also at the 10 year mark, we see the US 1-year breakeven inflation rate (red line) surging.

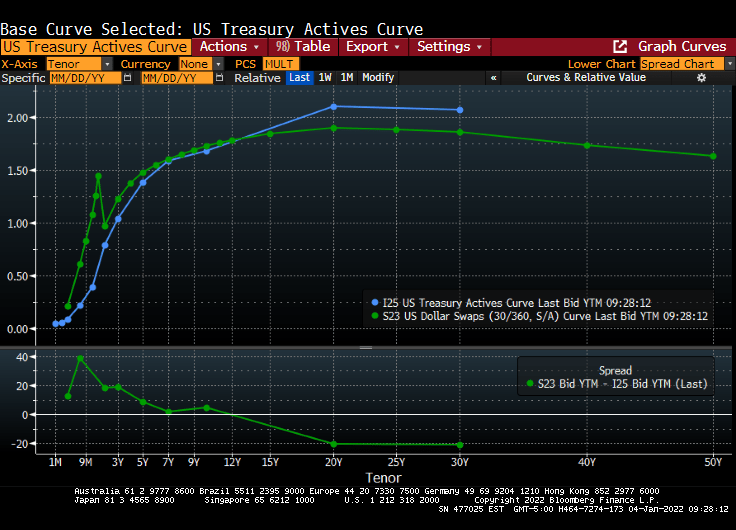
The US Treasury actives curve and Dollar Swaps curve remain steeply upward sloping.

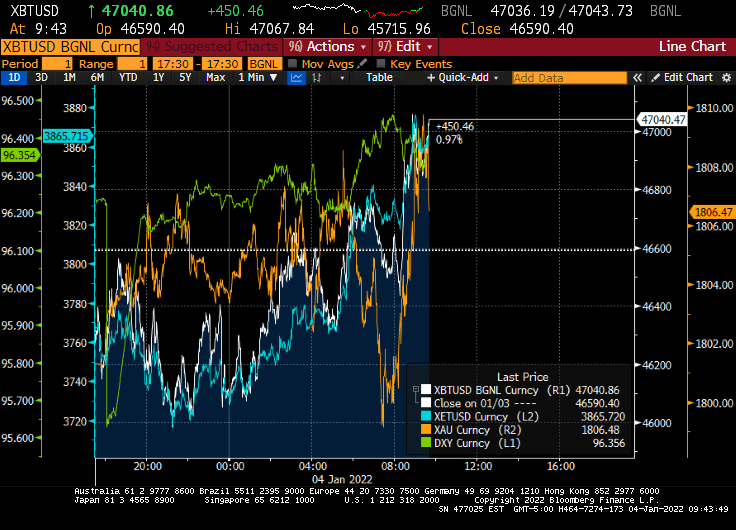
And on the crypto and gold front, gold surged this morning after tanking in the evening, while Ethereum (blue) is doing quite well along with Bitcoin.

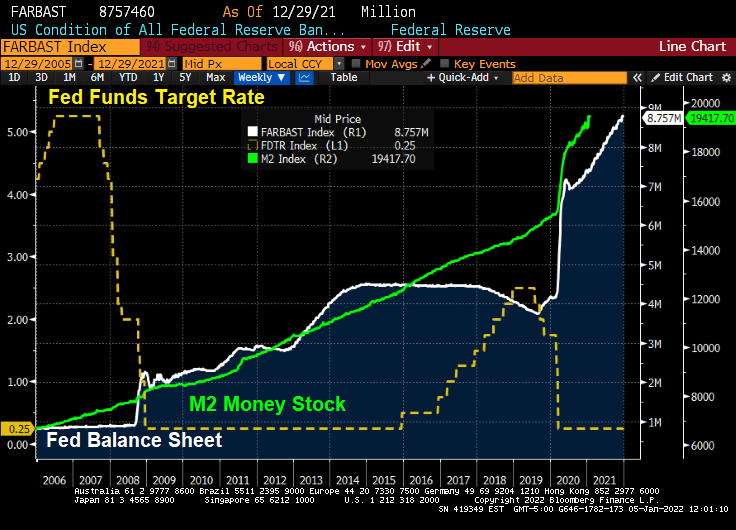
My favorite non-bond, non-alt investment chart. The S&P 500 index charted against The Fed’s M2 Money Stock.

Following my friend Jesse’s habit of posting great French food dishes, here is one from my favorite Parisian eatery, Le Duc de Richelieu. Mmmmmmm.

RIP, Hap Jacobs.

Pfizer’s Covid Booster Shot for Younger Teens Wins FDA Clearance, Stock Drops (But Pfizer Underperformed S&P 500 Index Since Fed COVID Stimulus)

You would think that an FDA approval to give booster shots to millions of new patients would send their stock soaring. It didn’t Pfizer dropped along with the S&P 500 index.

Despite the growth of COVID cases in the US (blue dashed line), Pfizer stock has only gone up by “only” 88% since March 2020. The S&P 500 index rose by 100%.

I under what Pfizer’s performance would be if The Fed wasn’t blowing a hurricane wind at the back of the market.