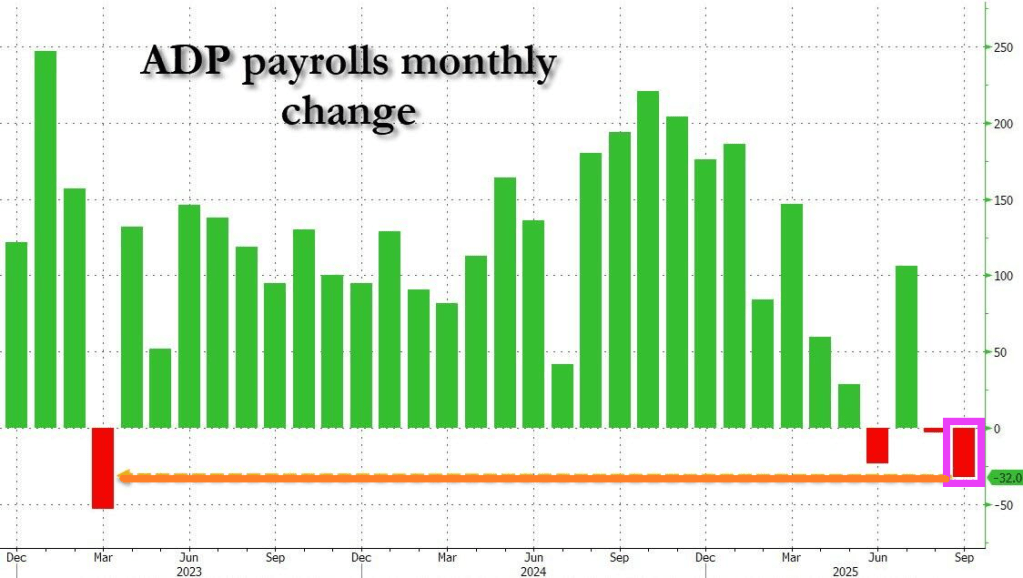
This should get The Fed to cut rates! ADP reported that in September, the US private sector shed 32,000 jobs, the worst print since March 2023.
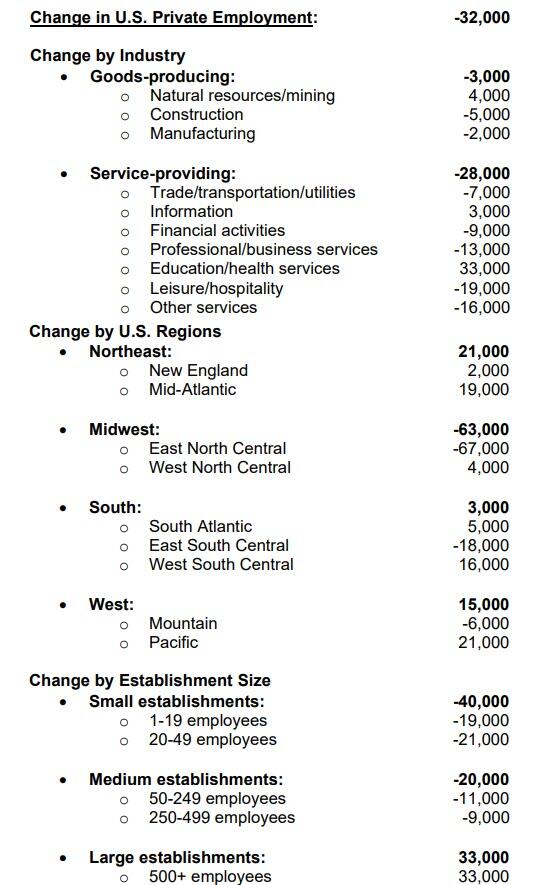
Here is the breakdown.
Confounded Interest – Anthony B. Sanders
Financial Markets And Real Estate
This should get The Fed to cut rates! ADP reported that in September, the US private sector shed 32,000 jobs, the worst print since March 2023.
Here is the breakdown.
Shutdown!
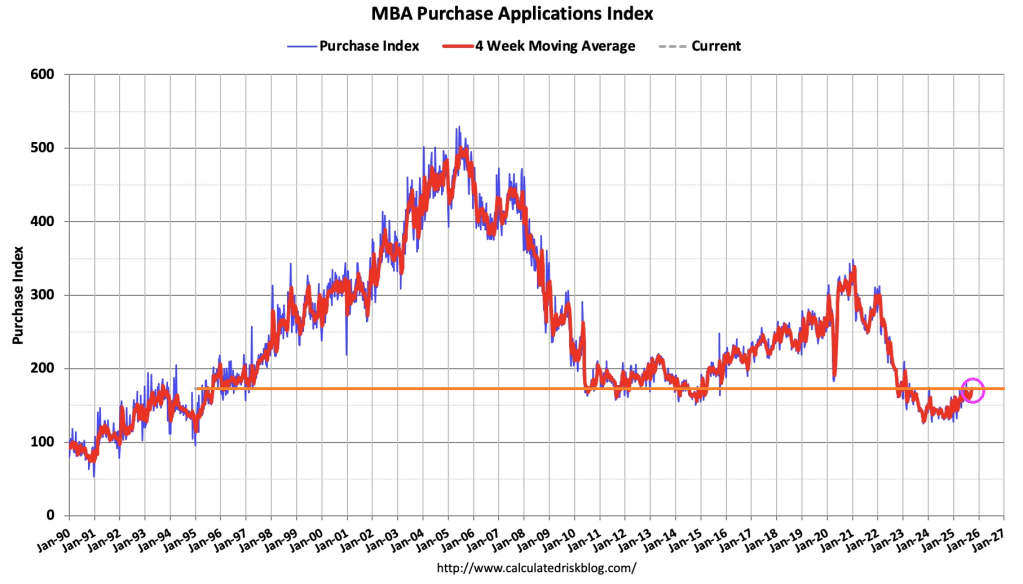
Mortgage applications decreased 12.7 percent from one week earlier, according to data from the Mortgage Bankers Association’s (MBA) Weekly Mortgage Applications Survey for the week ending September 26, 2025.
The Market Composite Index, a measure of mortgage loan application volume, decreased 12.7 percent on a seasonally adjusted basis from one week earlier. On an unadjusted basis, the Index decreased 13 percent compared with the previous week. The seasonally adjusted Purchase Index decreased 1 percent from one week earlier. The unadjusted Purchase Index decreased 2 percent compared with the previous week and was 16 percent higher than the same week one year ago.
The Refinance Index decreased 21 percent from the previous week and was 16 percent higher than the same week one year ago.
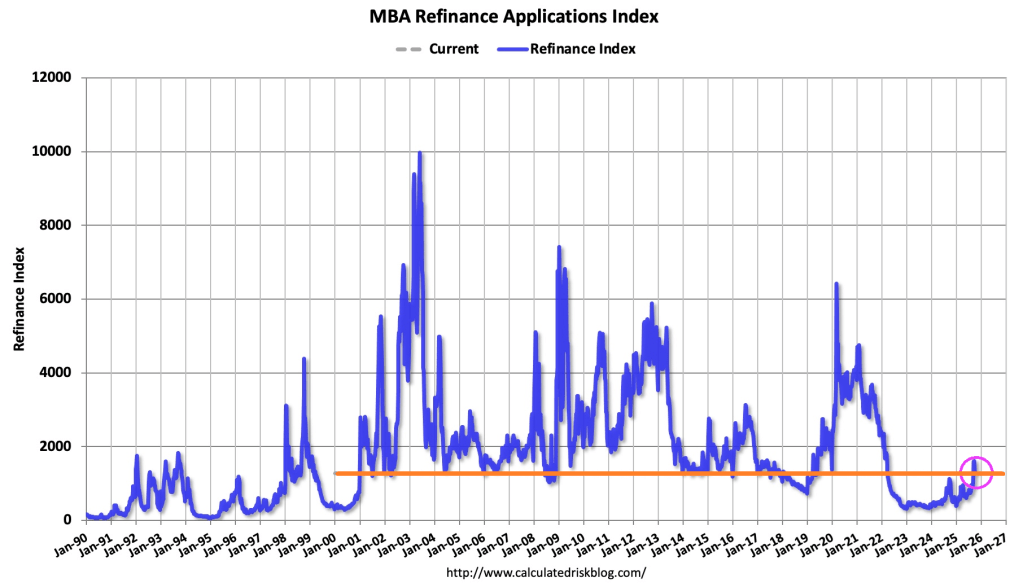
Mortgage rates increased to its highest level in three weeks as Treasury yields pushed higher on recent, stronger than expected economic data. After the burst in refinancing activity over the past month, this reversal in mortgage rates led to a sizeable drop in refinance applications, consistent with the view that refinance opportunities this year will be short-lived.
Yes, the Federal government has shut down.

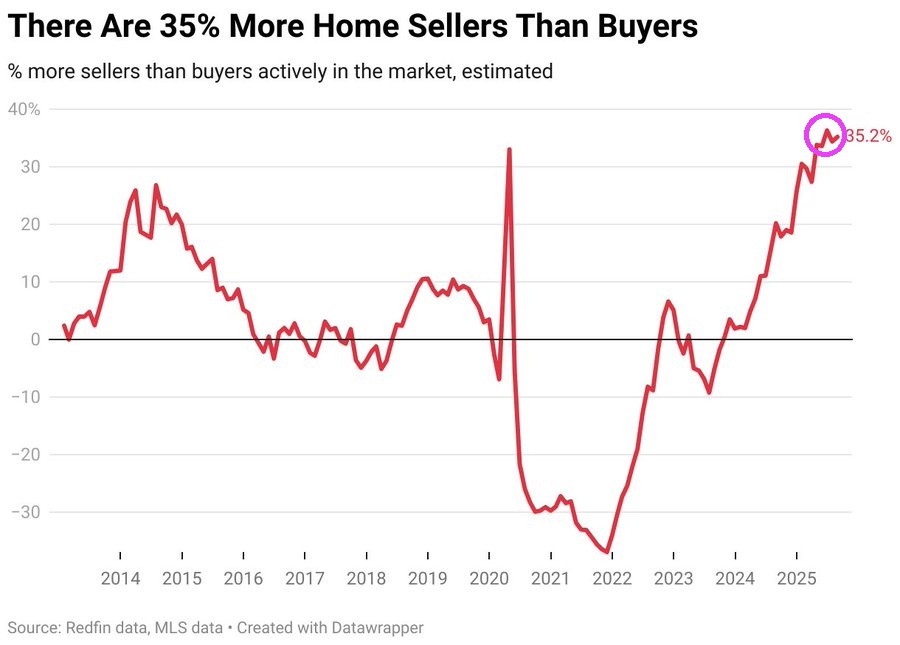
August represents a massive switch from 3 years ago when there were nearly 40% more home buyers and sellers in the US housing market. There are now 35.2% MORE home sellers than buyers!
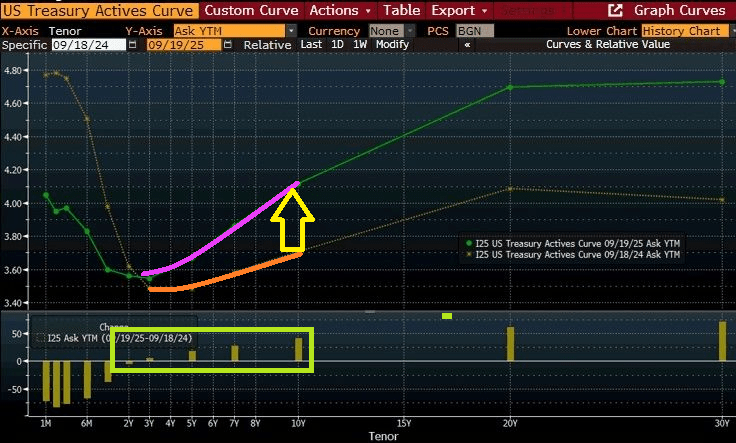
It’s Friday and the US Treasury yield curve is rising/steepening at the 10-year tenor.
As of yesterday, the 30-year mortgage rate fell to 6.17%
Thanks in part to Funky Cold Jerome!

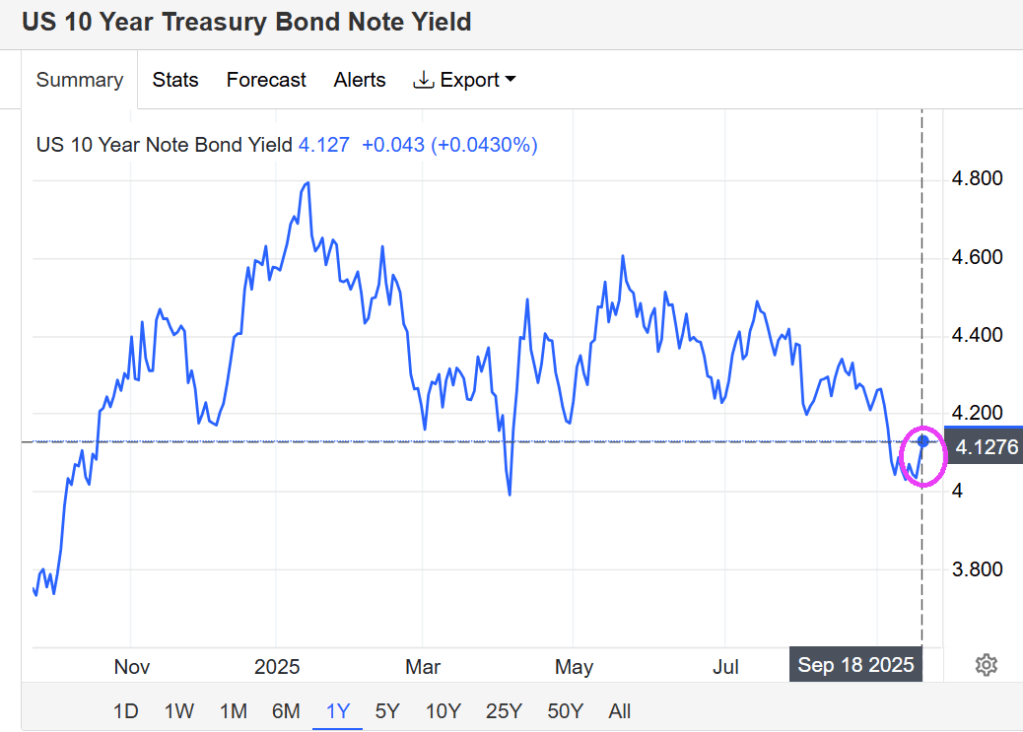
Fed Chair Jerome Powell is the God of Hellfire! We should always wait a day to digest Fed’s annoucements since they often make little sense. For example, yesterday the 10Y yield fell below 4% after The Fed’s announcement … then promplty rose above 4% again. And today, the US Treasury 10Y yield rose to 4.1276%
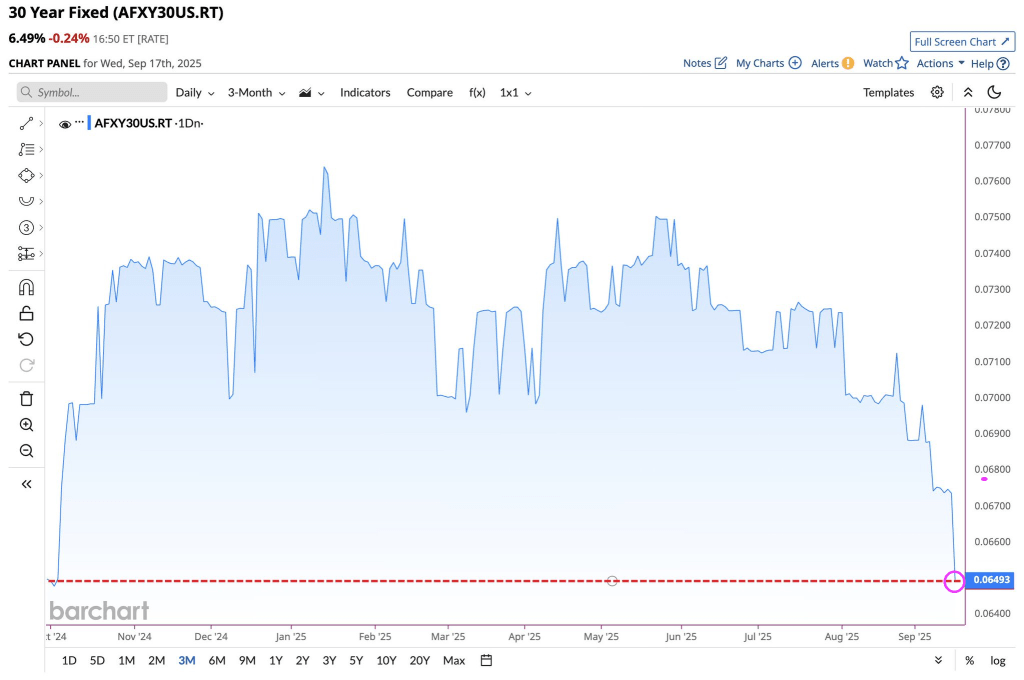
The 30Y US mortgage rate fell to 6.493%.
How about the US Dollar? Similar to the US 10Y yield, volatility reigned following Powell’s muddled message.

Powell rarely is straightforward and never puts cash on the barrelhead.
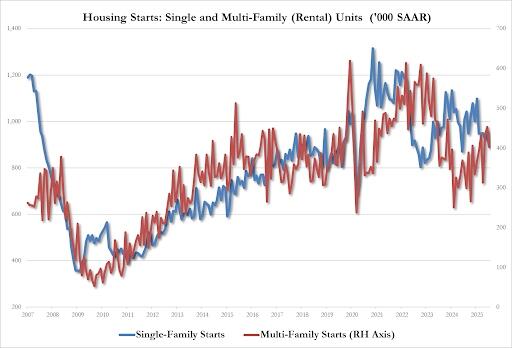
It will take a while to recover from Biden’s “Reign of Error.” According the US Census Bureau, housing starts are 6.0 percent below the August 2024 rate.
Housing starts:
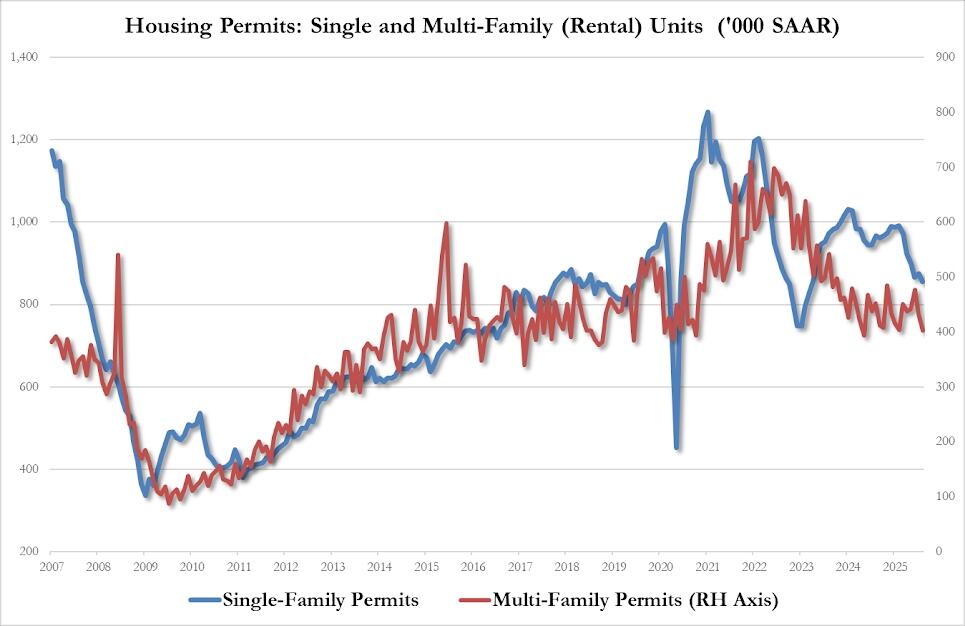
Housing permits?
Let’s see if Powell and The Gang drop rates 25 or 50 basis points at today’s FOMC meeting.
Between The Fed’s persistent policy errors and Biden’s centralized mismanagement of the economy, Biden’s Maladministration is the epitome of a “Reign of Error.”

According to the Bureau of Labor Statistics (BLS), headline inflation rose 0.4% MoM and 2.9% YoY in August.

Shelter (housing) is up 3.6% YoY. Gimme (expensive) shelter!
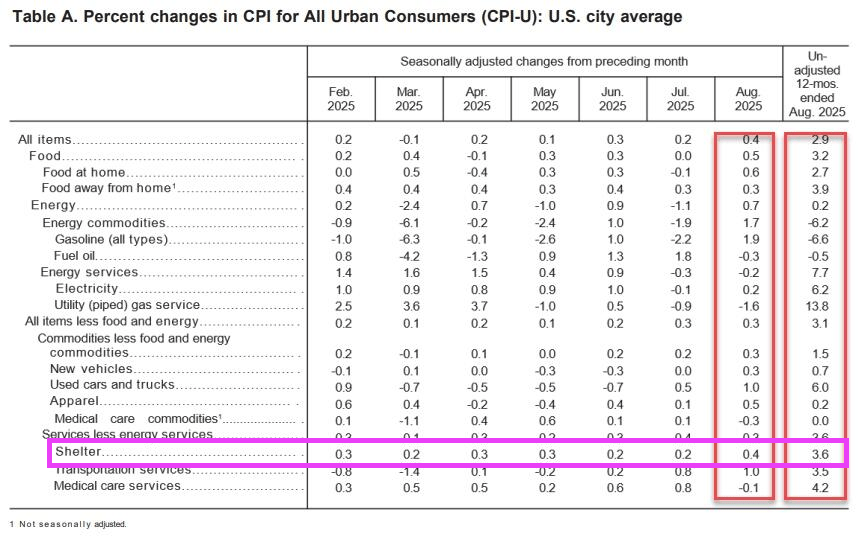
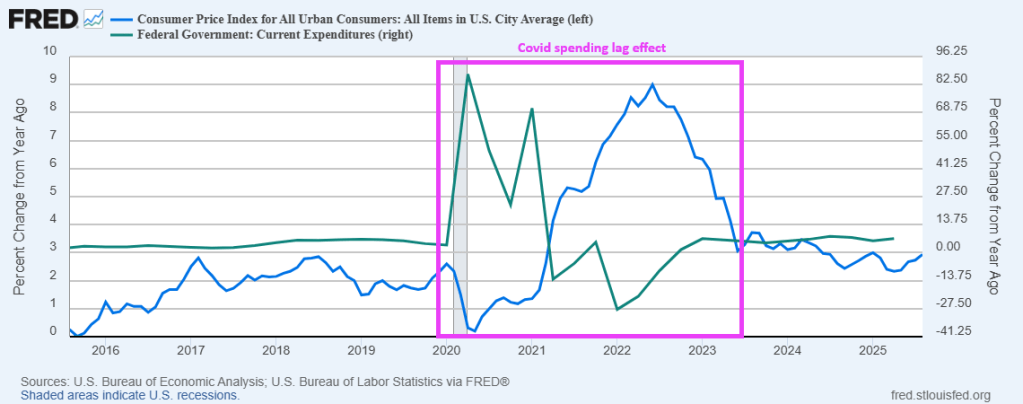
Of course, Federal government spending is the source of inflation. Notice the lag between Covid spending and resulting inflation.
So much for Trump Tariffs causing runaway inflation.
Prayers for Charlie Kirk and his family. I hope they catch the sick SOB that assassinated Charlie.
Yes, the jobs revision for March 2025 is down by 911k jobs topping the last Biden revision of over 600k.
The preliminary estimate of the Current Employment Statistics (CES) national benchmark revision to total nonfarm employment for March 2025 is -911,000 (-0.6 percent), the U.S. Bureau of Labor Statistics reported today. The annual benchmark revisions over the last 10 years have an absolute average of 0.2 percent of total nonfarm employment. In accordance with usual practice, the final benchmark revision will be issued in February 2026 with the publication of the January 2026 Employment Situation news release.
Each year, CES employment estimates are benchmarked to comprehensive counts of employment from the Quarterly Census of Employment and Wages (QCEW). These counts are derived primarily from state unemployment insurance (UI) tax records that nearly all employers are required to file with state workforce agencies.

Here is the breakdown:

Wow. Every month during Biden’s last year in his reign of error was a negative revision.
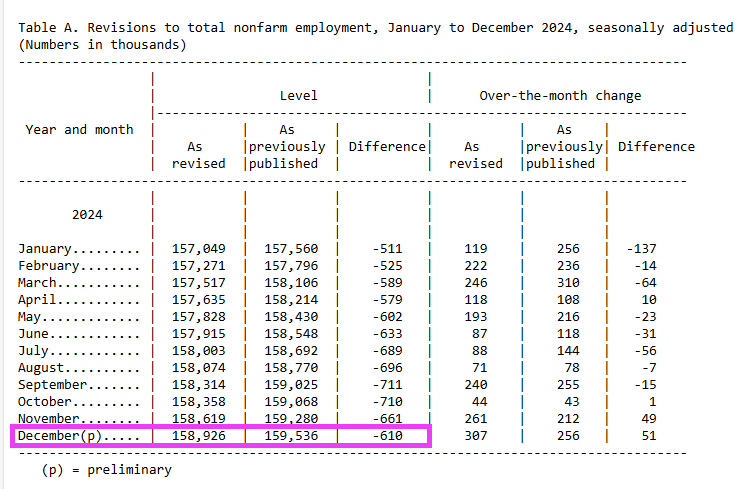
Biden, the inept bozo.

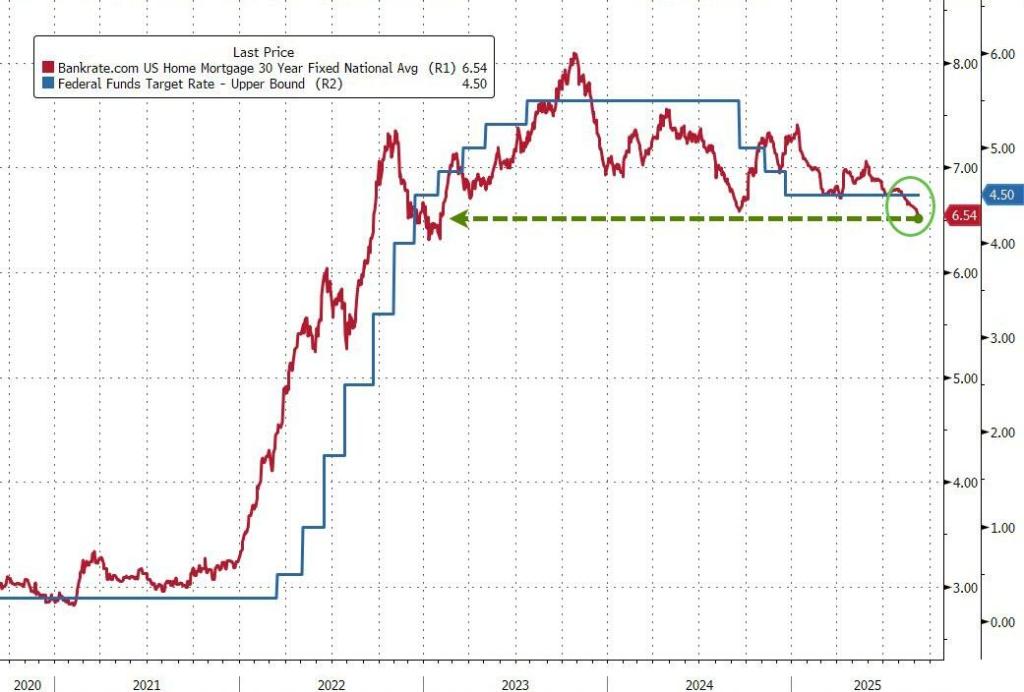
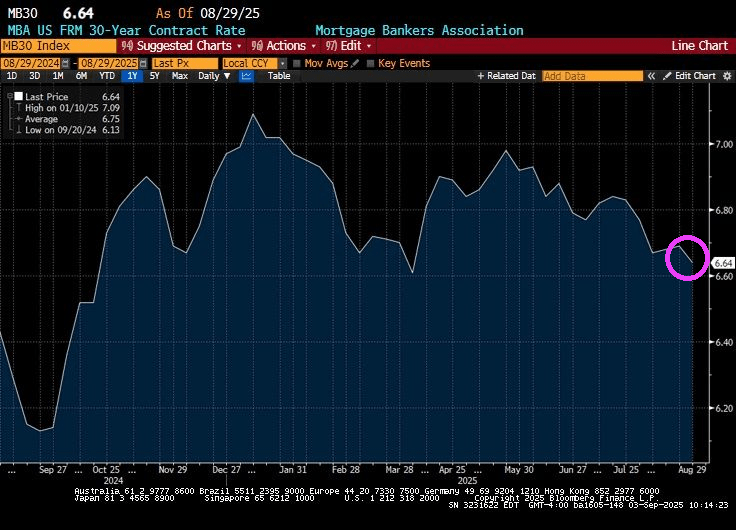
The good news? The US 30-year mortgage rate fell slightly to 6.64%.
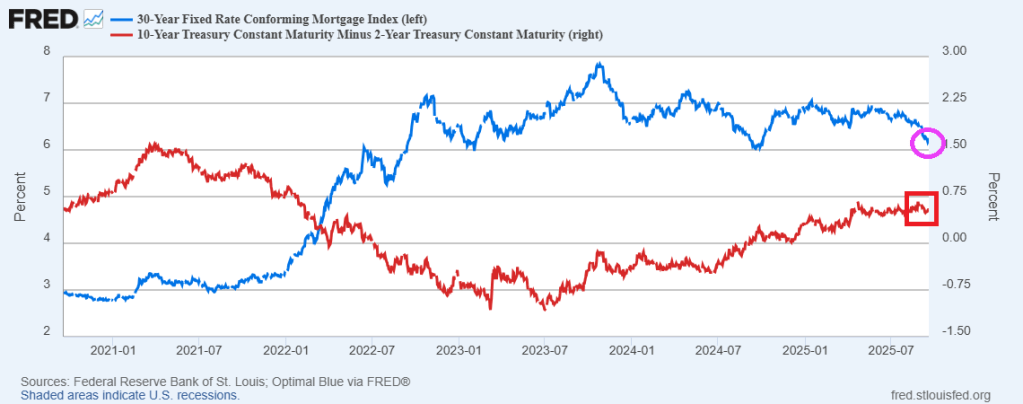
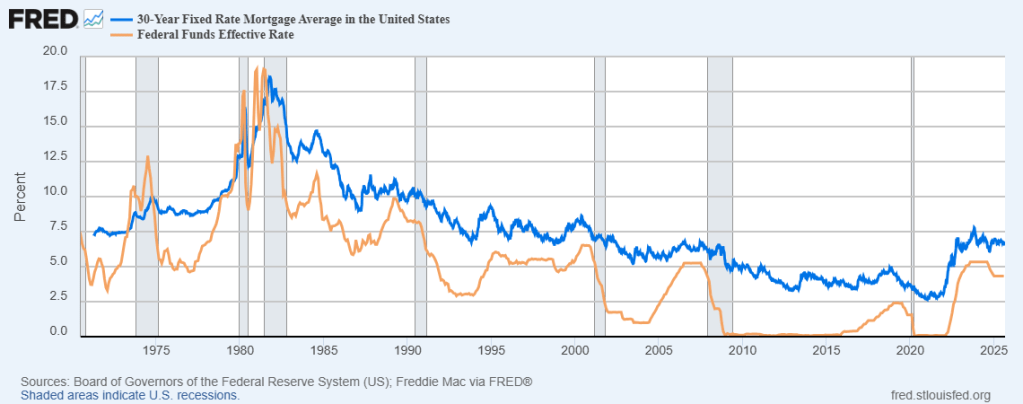
The bad news? It seems to be a milder repeat of the Ford/Carter years of the late 1970s/early 1980s. Rising 10-year Treasury yields and 30-year mortgage rates during the Ford/Carter years … and early Reagan years. The difference? The Federal Reserve is fundamentally different today than previously. With Bernanke/Yellen, The Fed became more “activist” (like Obama/Biden-appoointed District Judges). Powell is returning to the Yellen model of Fed activism … not doing much.
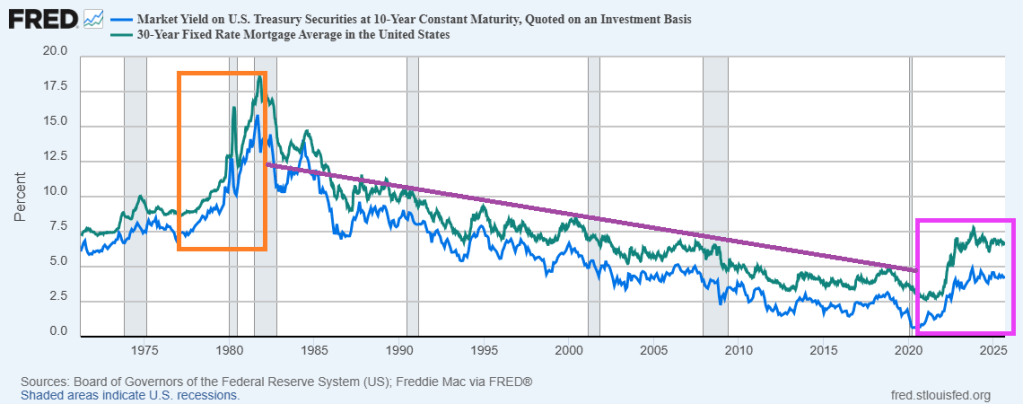
Now the market awaits a rate cut from The Fed at the next FOMC meeting. But 30-year mortgage rates are most closely related to the 10-year Treasury yield than the short-term Fed Funds rate. Theoretically, The Fed could cut their target rate by 25 basis points and mortgage rates could be uneffected. Or even rise.
Here is a video of Fed Chair Jerome Powell trying to lower mortgage rates.

What about the mortgage rates, Fawlty?
US Q3 GDP fell slightly in Atlanta Fed’s GDPNow latest revision to 3.0% from 3.5% last week.

The source of the decline in GDP? Equipment investment fell to 8.9.

From 11.7. Hard to sustain high levels of equipment investment.

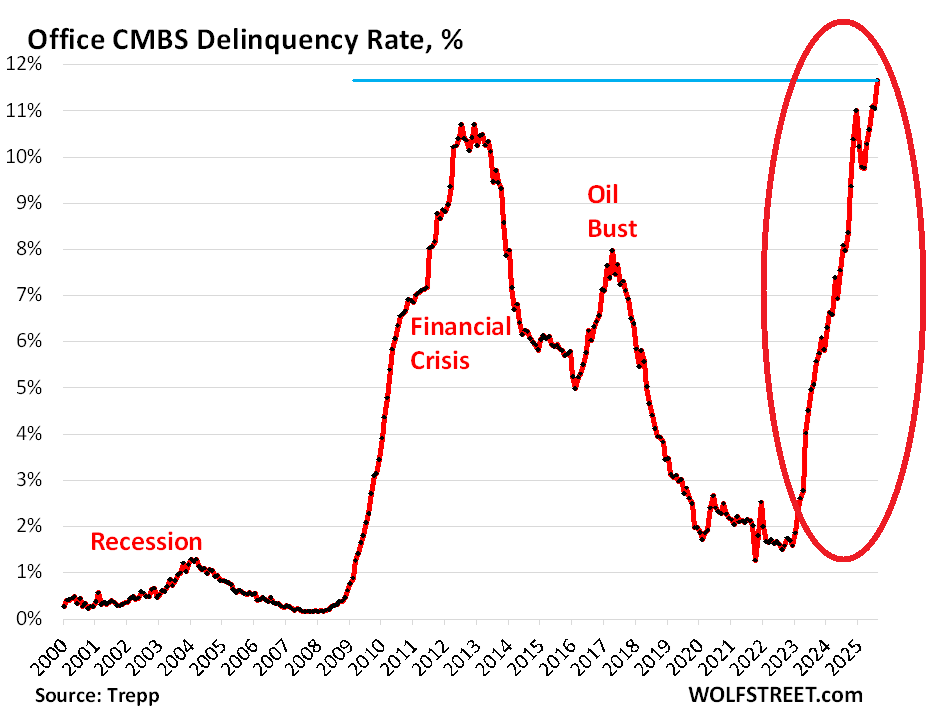
On a related note, office CMBS just hit all-time high. Yes, higher than the financial crisis!!


You must be logged in to post a comment.