The gap between the VIX Put-call volume and CBOE Put-call ratio is the widest since 2006, the precursor of a major volatility spike.
Meanwhile, for those of you interest in railroad regulatory issues, as a general matter, regulations are rarely ever “reversed,:” but rather modified or replaced with changes. No administration would be able to outright “repeal” a major safety regulation because it almost certainly be immediately enjoined by a court and found to be counter to Congressional delegation.
I assume most of the attention will be on this final rule (https://www.federalregister.gov/documents/2020/10/07/2020-18339/rail-integrity-and-track-safety-standards) published and effective on Oct 7, 2020. It is considered”deregulatory” in the sense that it results in an economic or compliance cost savings, mostly owing to a change in the permissible type of track integrity monitoring, and decrease in the resulting number of “slow orders.”
Unlike Pete Buttigieg who apparently did not read the regulations when he blamed Trump, read the actual published “deregulation.” A faulty railcar axel which was the cause of the East Palestine Ohio trail derailment was NOT impacted by the “deregulation.” Instead of Mayor Pete, he should be called “Cheap Shot Pete.”
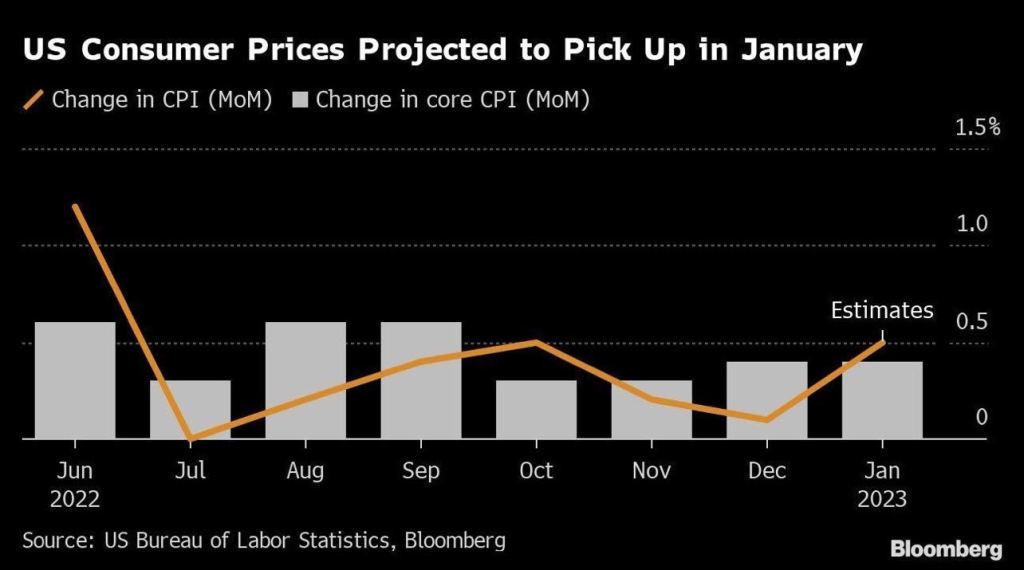
Not really a surprise, but January’s personal spending numbers came in hot at 1.8% MoM. Also, Personal Consumption Expenditures PRICE index (aka, inflation) rose to 5.4% YoY.
Here comes The Fed! The 2-year Treasury yield rose 10 basis points this morning.
The US Federal government reminds me of the Peggy Lee song “Is That All There Is?” Since the outbreak of Covid in 2020 and the absurb spending spree by Pelosi and Schumer, the Federal government has increased their debt by 36% to help pay for the Federal spending spree. That amounts to $54.8 TRILLION in additional Federal debt since January 2020.
What did the US economy get for all that Federal spending? In Q4 2022, Real GDP rose by … 0.91% YoY. Seriously? Is that all there is from $54.8 TRILLION in additional Federal debt?
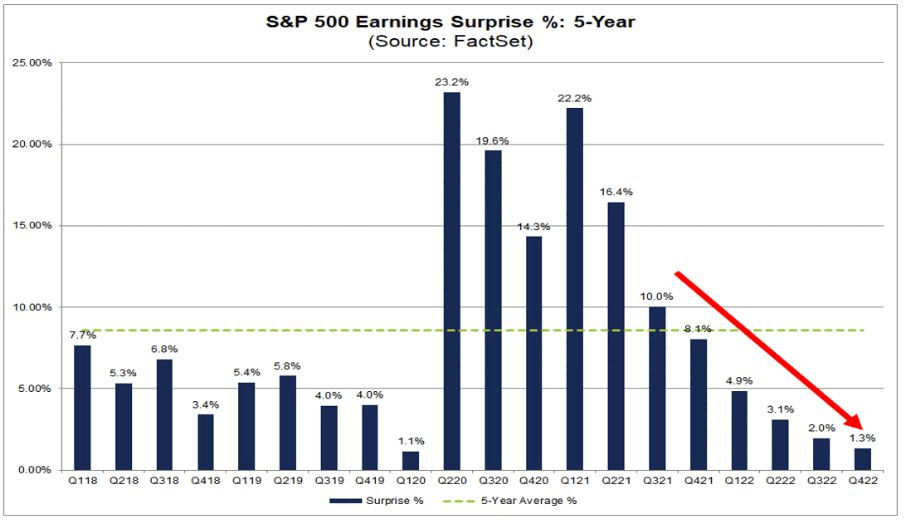
Another bit of lousy news. Look at the trend in S&P 500 Earnings Surprise (5 year).
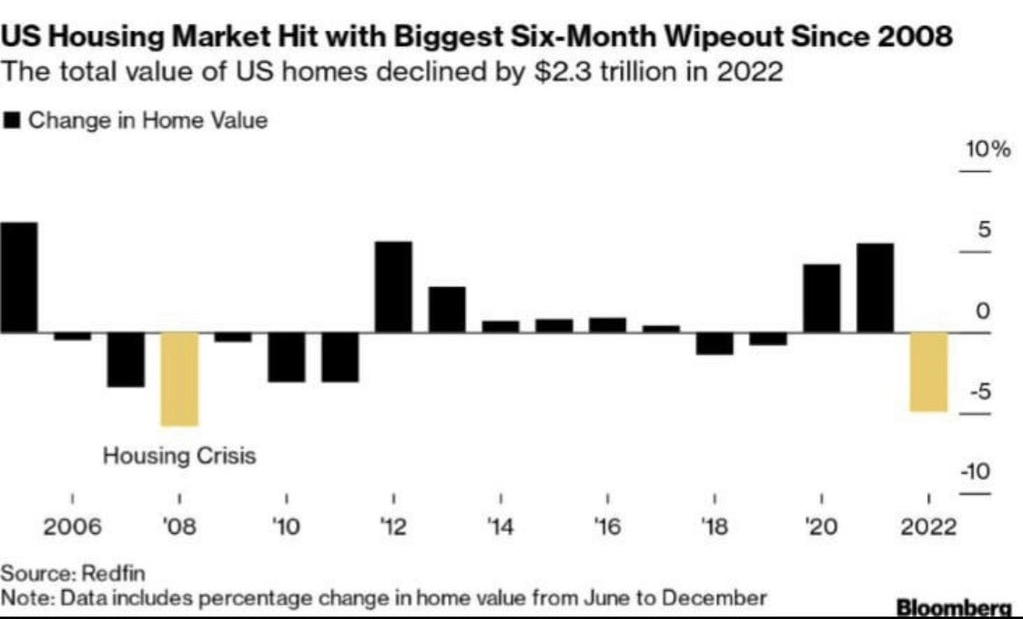
On the housing front, the US housing market was hit with the biggest six-month wipeout since 2008.
At least US Transportation Secretary “Pothole Pete” Buttigieg FINALLY showed up (three weeks after that East Palestine Ohio train disaster). Here is Buttigieg practising for his press conference.
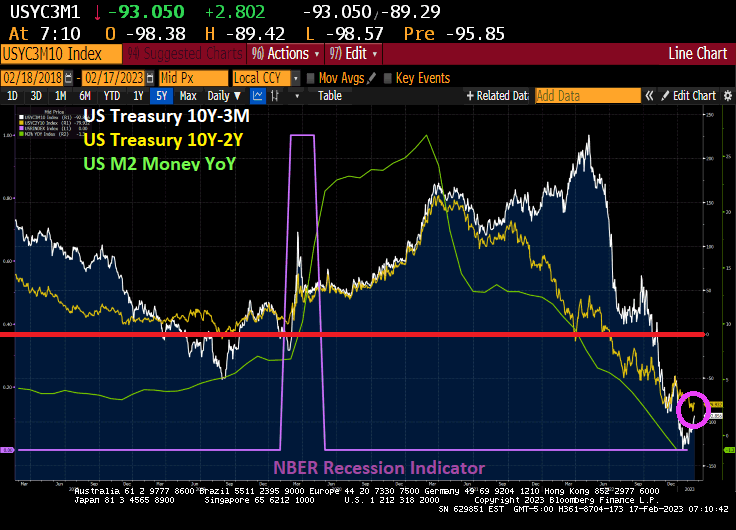
Bull steepenings in the yield curve are generally seen as a precursor to a recession, but they are often preceded by bear steepenings. The 3m30y curve is currently bear steepening, indicating a recession could begin as early as the summer. In fact, the 3m30y curve is now inverted at -94.628 basis points pointing to a recession in summer 2023.
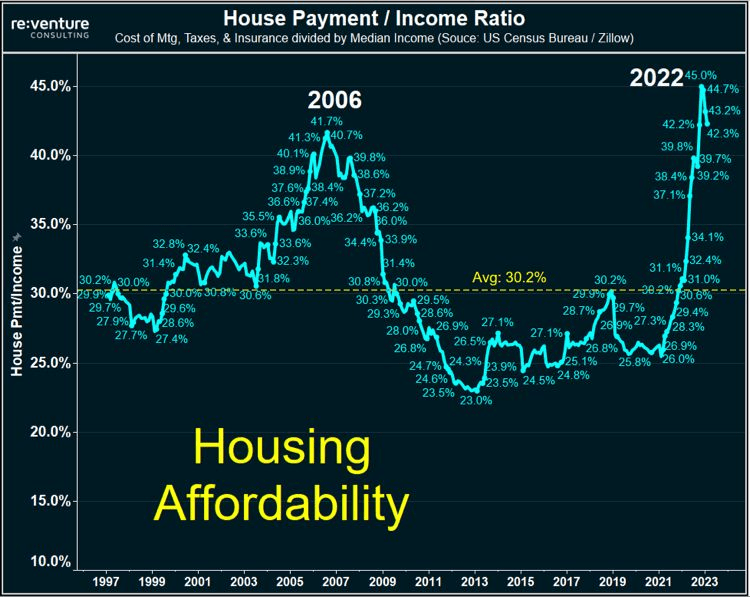
This is happening as the US house payment to income ratio near all-time highs.
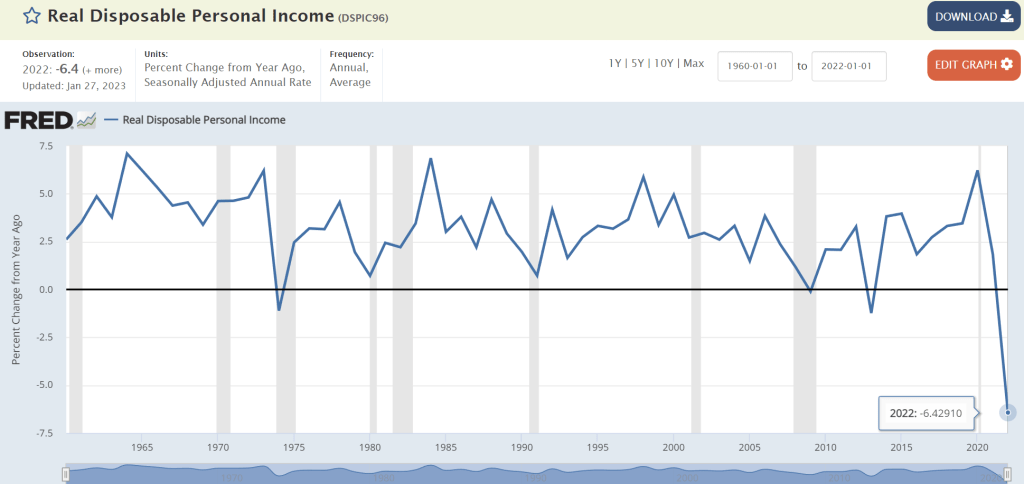
President Biden touts his economic plan as being a great success. But the data says otherwise. Real Disposable Personal Income, for examplge, was down -6.4% year-over-year (YoY) in 2022. That is the WORST reading since The Great Depression.
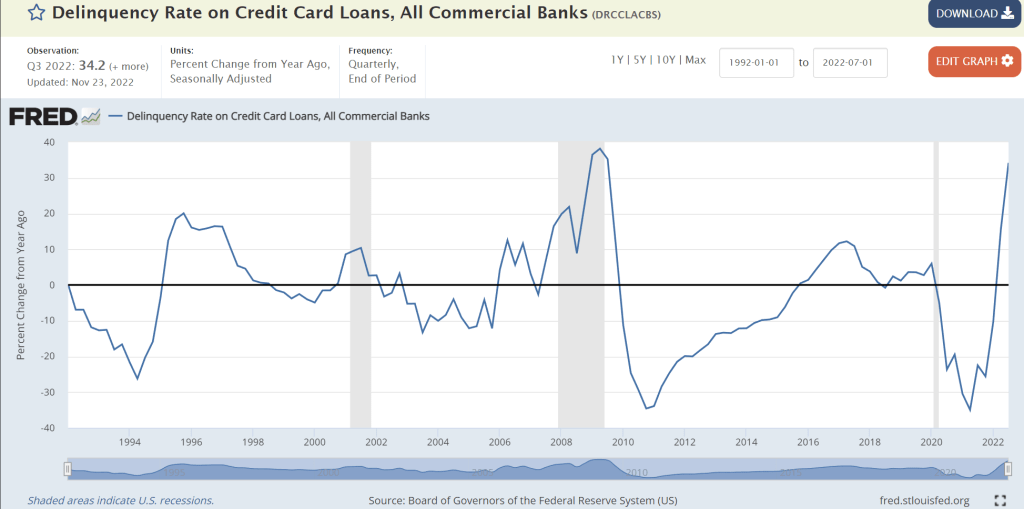
And to cope with inflation, Americans have expanded their credit useage, but credit card delinquencies are through the roof.
So much for “Middle Class Joe” and The Forgotten Man. Biden hasn’t forgotten, he just doesn’t care.
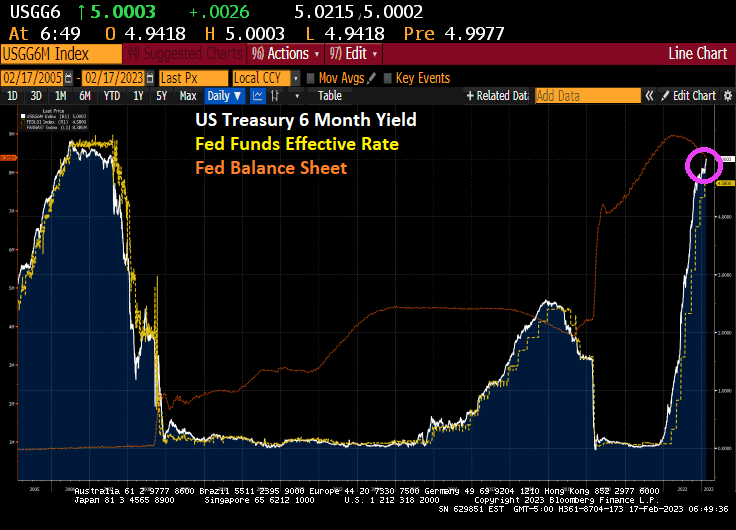
Well, here we are again. Back to 2007 and the housing bubble and subsequent financial crisis. The US Treasury 6-month yield is back over 5%, a yield we haven’t seen since August 8, 2007.
Well, there is one notable difference. The Fed’s balance sheet is still at $8.4 TRILLION whereas it was only $866 billion on August 8, 2007.
The US Treasury yield curve? It remains deeply inverted as The Fed withdraws liquidity.
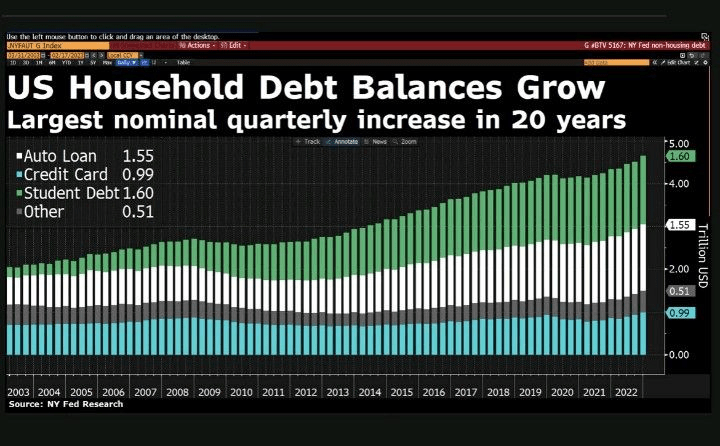
And then we have this diddy. US household debt balances increase, the largest nominal quarterly increase in 20 years.
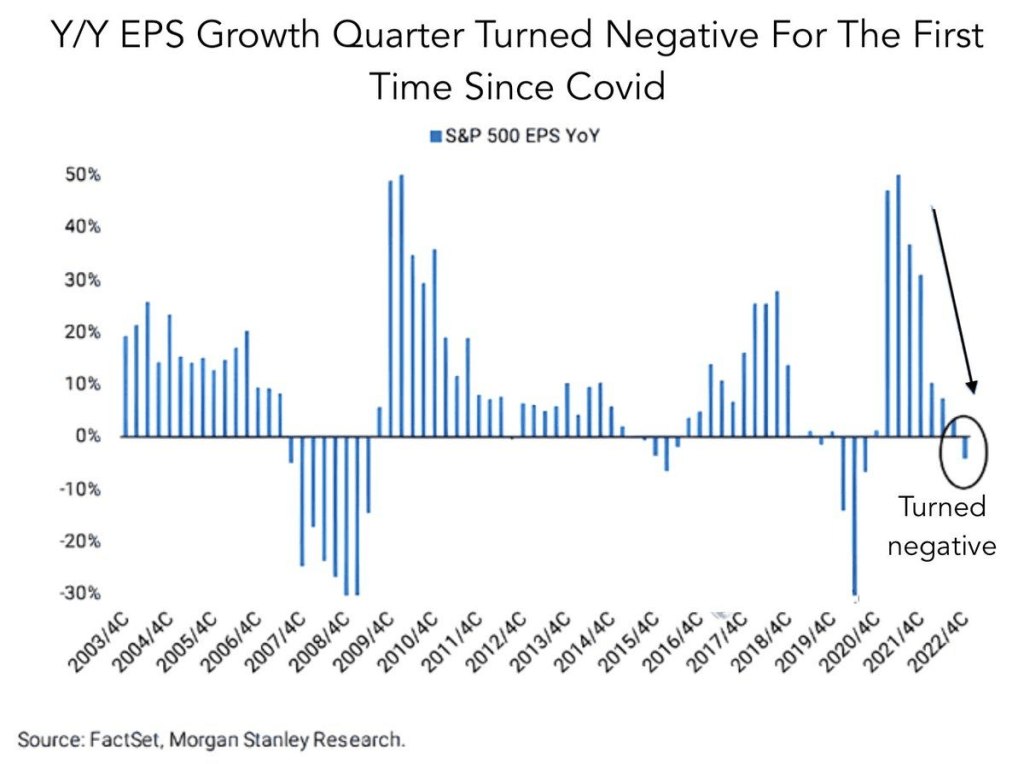
Also, we have the year-over-year EPS growth has turned negative for the first time since Covid.
While much of the US is down from 2022 peaks in home price. but it is The West where home prices are down the most (just like 2008 where the Inland Empire of California, Phoenix and Las Vegas crashed in term of home prices).
Biden’s State of the Union address saw him bragging about his record job creation (actually, it was the private sector, not Biden than created jobs) and historic unemployment rate. What Biden didn’t mention (along with not discussing the porous Mexican border with fentanyl pouring across or why he failed to shoot down a Chinese spy balloon until after it has passed over numerous military reservation) is that the unemployment rate always hit a low point just prior to a recession.
So, here we sit at 3.4% unemployment. But we also see the US Treasury yield curves (10Y-3M and 10Y-2Y) remaining deeply inverted.
The US Treasury 10-year yield is up 5.5 basis points today.
And Bankrate’s 30-year mortgage survey rate is up slightly today.
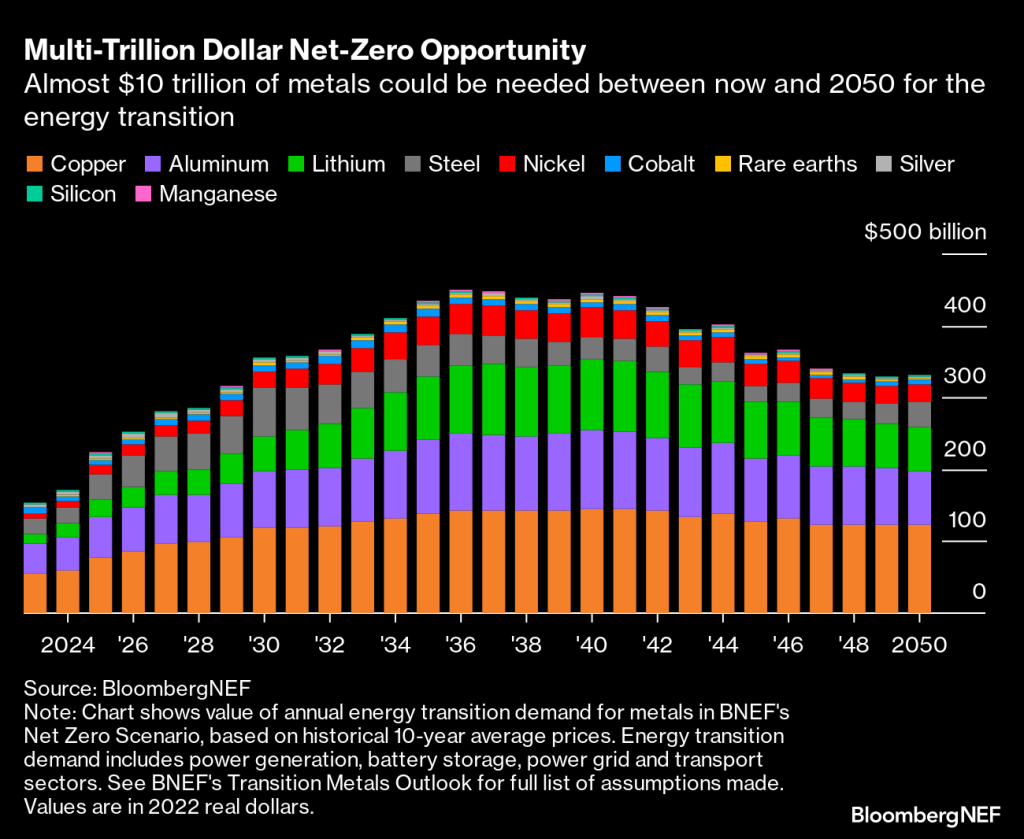
Copper set to be most valuable opportunity in race to net zero
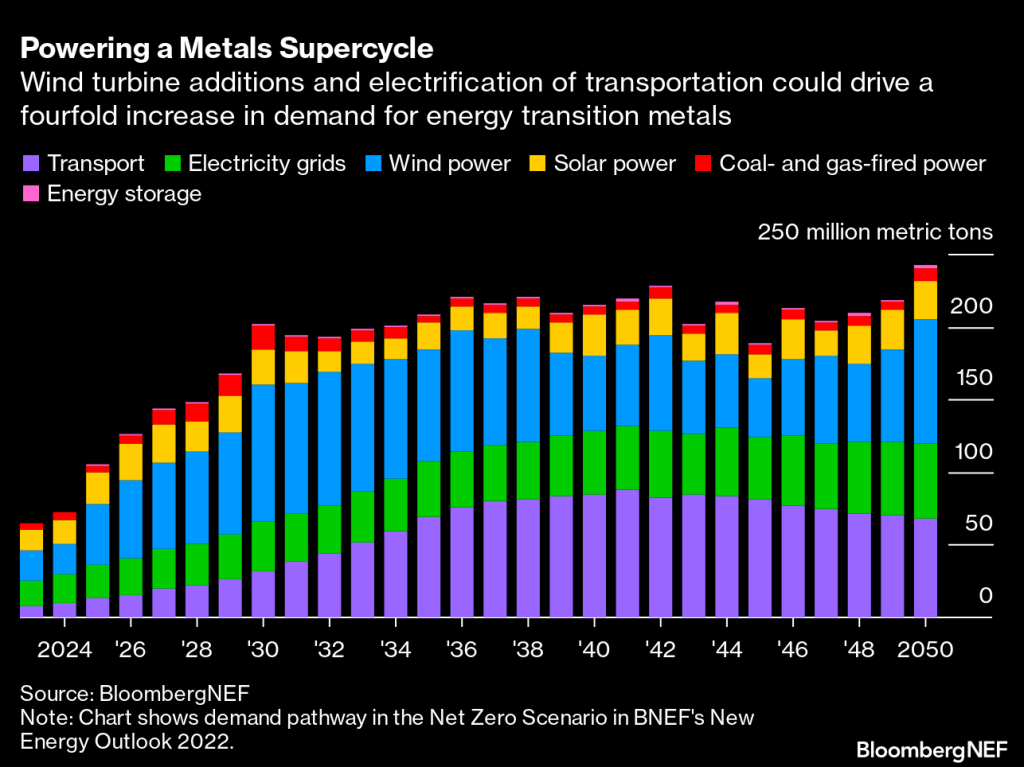
Electric vehicles and wind turbines are main demand drivers
Everything is a race when it comes to the energy transition. A race against time to reach net-zero emissions by the 2050 crunch point; a race to build enough wind turbines and replace gas-guzzling cars with electric vehicles; a race between superpowers to shore up domestic supply chains and capture the economic benefits of decarbonization.
There’s one common thread that runs through them all: the need for metals. A greener future is impossible without copper to expand the world’s electricity grids, lithium for batteries and aluminum for solar panel frames.
Companies are now hunting for more direct access to these essential raw materials as they recognize metals will form the backbone of the energy transition. General Motors Co., for example, announced at the end of last month that it will invest $650 million in Lithium Americas Corp. and help develop the Thacker Pass mine in Nevada. The automaker is also reportedly competing to buy a stake in the base metals unit of mining giant Vale SA, according to Bloomberg News.
What exactly is driving this hunger for metals? Achieving a net-zero world will entail electrifying as much as possible. BNEF estimates the size of the global power grid will have to almost double to 152 million kilometers by 2050, requiring masses of steel, copper and aluminum. This means the expansion of grids will use the most copper out of all energy transition applications, coming in at 427 million tons between now and mid-century.
Clean electrons will need to flow through those grids, enabled by the scale-up of wind and solar power. Wind turbines are projected to consume the most metals overall by 2050 if the world gets on track for net-zero emissions. Today, steel accounts for nearly 90% of the materials used by weight in offshore wind and about 25% in onshore wind, although as turbines get bigger, they will use less steel on a per-megawatt basis. Consumption of rare earth metals such as neodymium will become more intense, however, as permanent magnet generators become more common in turbines.
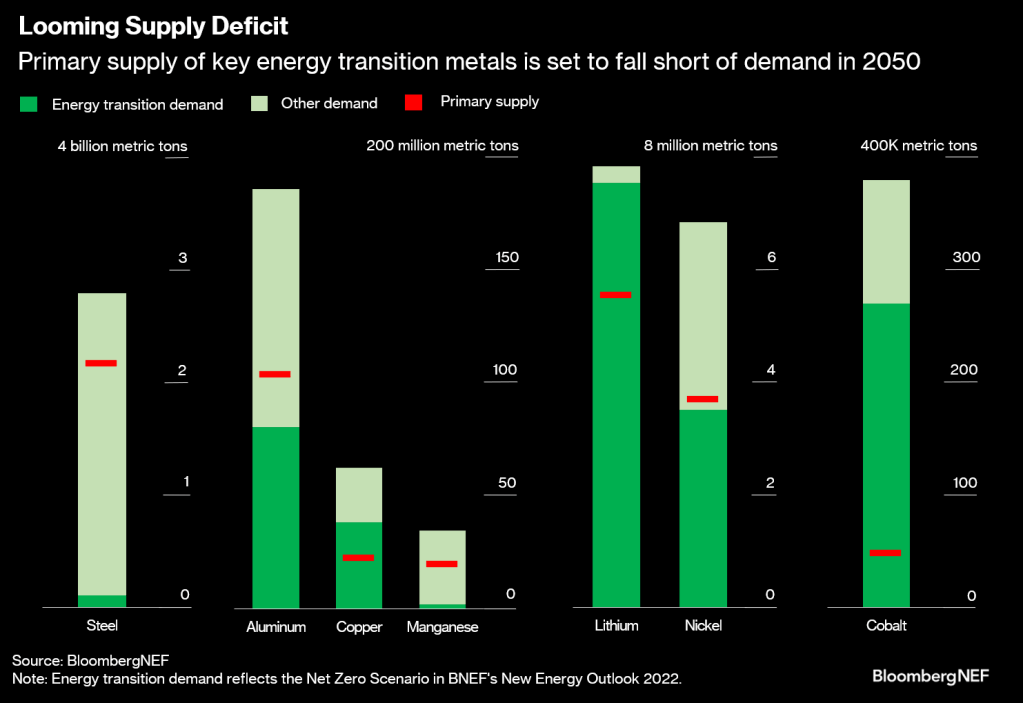
Rising demand for energy transition metals is essentially a given at this point. The real question is whether there will be enough supply. As things currently stand, lots of these metals, including copper and cobalt, are at risk of a shortfall in the coming decades unless current reserves can be supplemented with new geological discoveries and projects, and recycling of old material is stepped up.
Many countries have known resources of metals – in other words, natural occurrences of minerals in high concentrations and sufficient quantities. But not all of these resources have been turned into reserves that can be profitably mined yet. This requires time and investment to go through the exploration, discovery and feasibility stages, and these processes could be thwarted by policy.
Here are metals today.
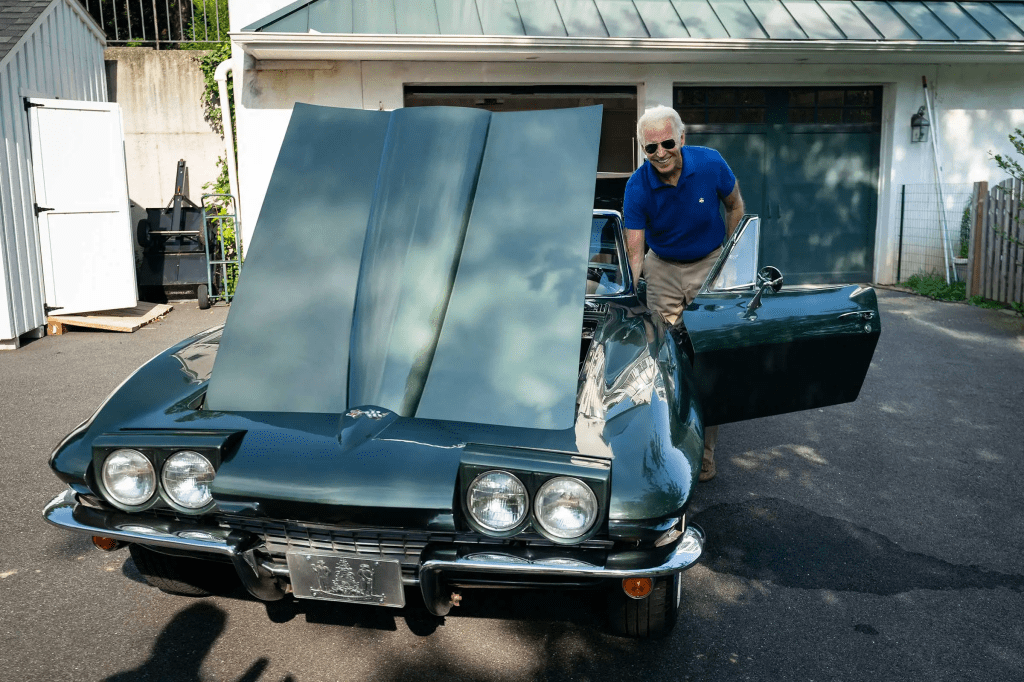
So, people get ready! Whether you agree with green energy policies or not, it is where markets are headed. Personally, I am sticking to my gasoline guzzling cars until I am ordered not to drive them. Stated differently, if Joe Biden can drive a gas guzzling V-8 in a Chevy Corvette, why can’t I?
At least I didn’t leave classified documents in my garage.


You must be logged in to post a comment.