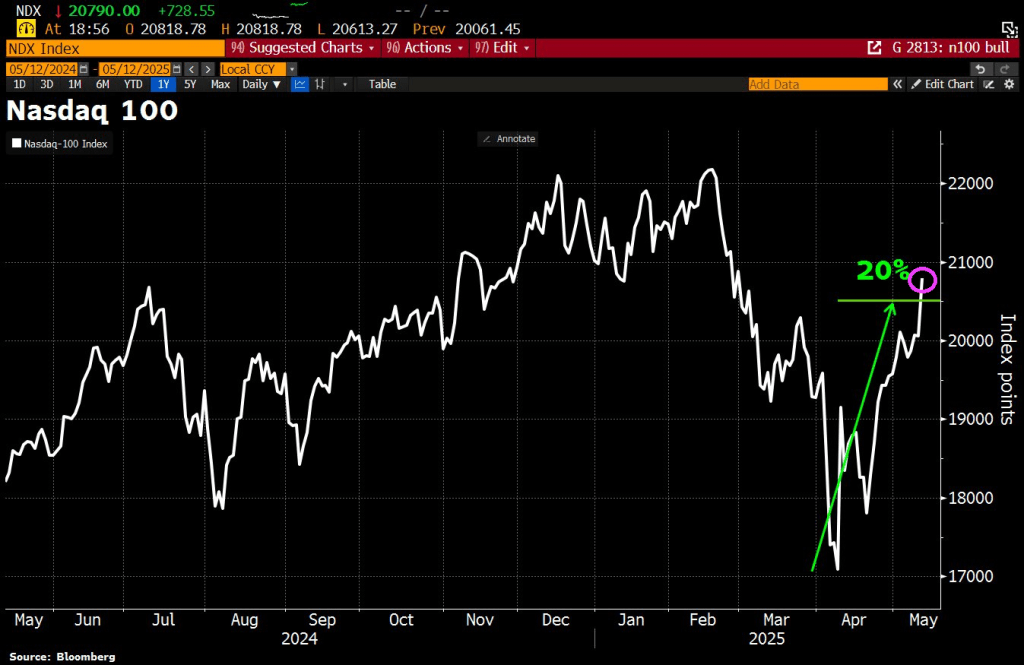
Well, U.S. and China reached an agreement to lower tariffs in a 90-day cool-off period. Despite China claiming they would NEVER agree to tariffs! The result? The NASDAQ 100 rose to its highest level since mid-February.
The April Jobs report blew away the tariff crash hysteria. 177k jobs were added, far better than the doomsayers predicted. Even better, more jobs went to native-born workers than foreign-born workers. Even better still, Federal jobs decreased (thanks to Doge).
The US labor market under the Biden administration “grew” almost entirely on the back of “foreign-born” workers, who – as we also first revealed and eventually was widely accepted – were primarily illegal aliens. But in April, we saw a reversal with native-born workers growing and foreign-born workers declining.
And Federal workers continue to decline.
The good news? The Fed will likely not change rates at the next meeting.
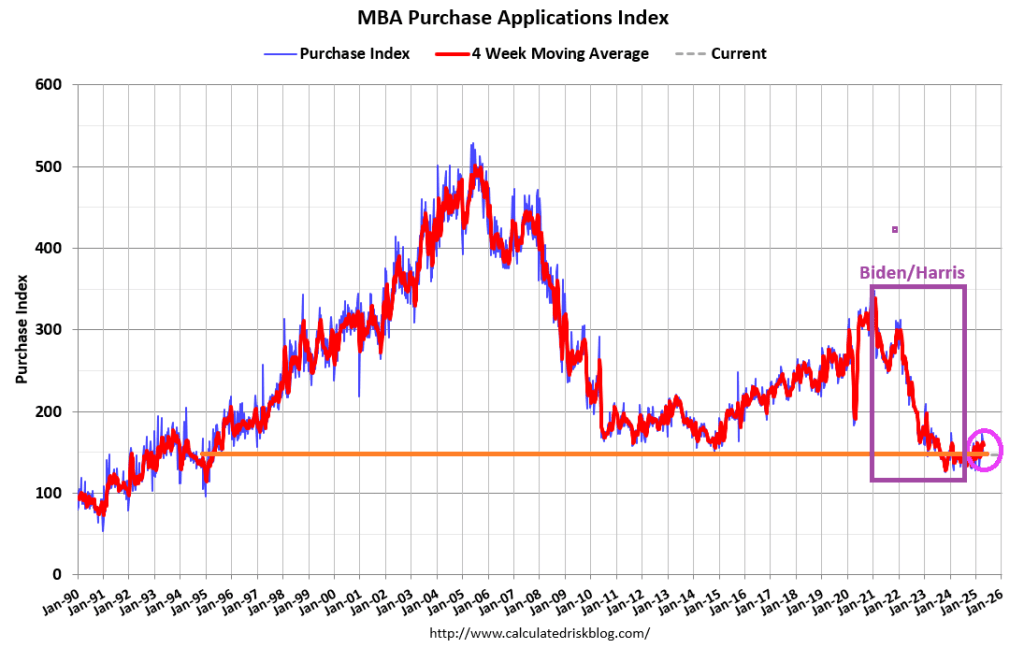
Mortgage applications decreased 4.2 percent from one week earlier, according to data from the Mortgage Bankers Association’s (MBA) Weekly Mortgage Applications Survey for the week ending April 25, 2025.
The Market Composite Index, a measure of mortgage loan application volume, decreased 4.2 percent on a seasonally adjusted basis from one week earlier. On an unadjusted basis, the Index decreased 4 percent compared with the previous week. The seasonally adjusted Purchase Index decreased 4 percent from one week earlier. The unadjusted Purchase Index decreased 3 percent compared with the previous week and was 3 percent higher than the same week one year ago.
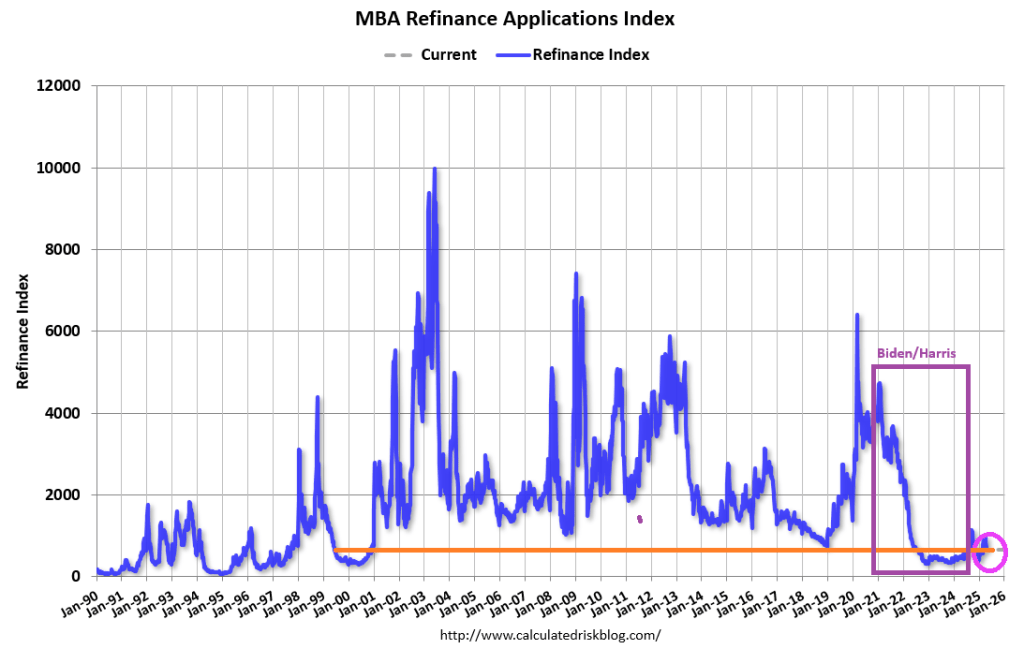
The Refinance Index decreased 4 percent from the previous week and was 42 percent higher than the same week one year ago.
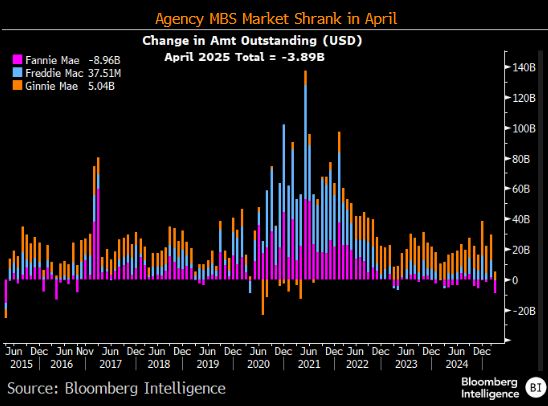
The Agency MBS market shrank in April.
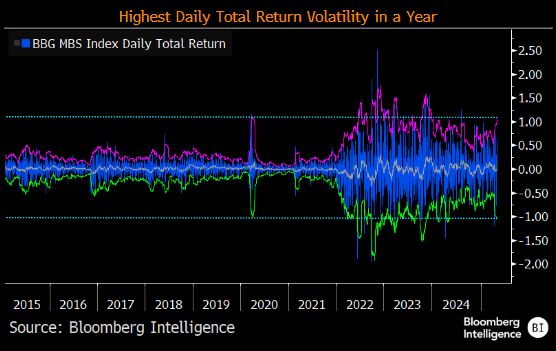
And MBS daily returns have the highest return volatility.
Washington DC is loaded with good ol’ boys. Willing to cut deals with anyone for a slice of financial pie. Like “10% For The Big Guy” Joe Biden.
Money flowing into Treasury funds hit its highest since 2017, by far.
And with the massive expansion of The Fed’s balance sheet with a) the financial crisis and b) Covid crisis, The Fed still has a staggering amount of bonds on its balance sheet, making it vulnerable to interest rate increases.
Like what has happened in 2023 and 2024 under Biden. A fine mess!
Sail away. We are all prisoners of the theft by DC politicians.
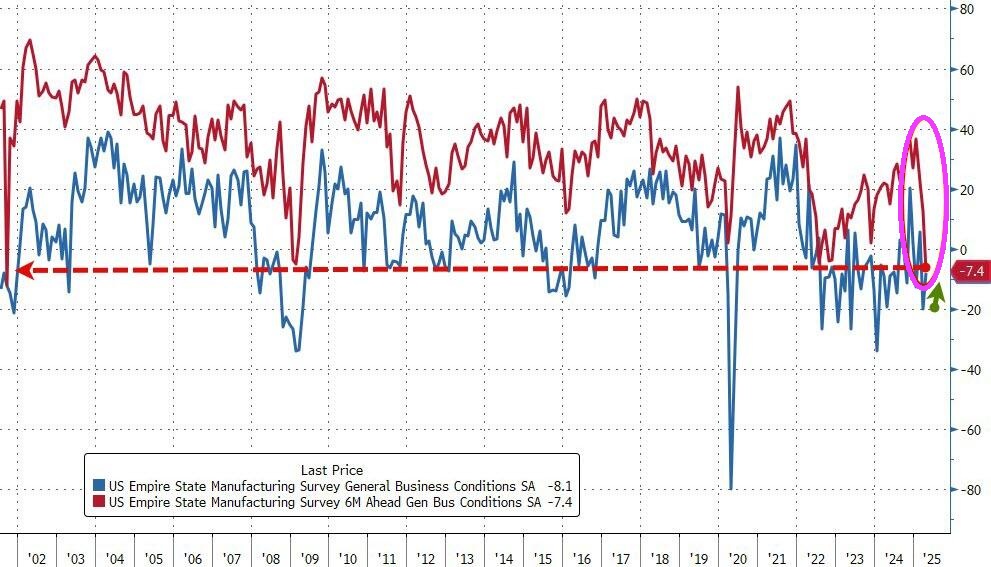
Despite the slump in ‘soft’ survey data, analysts expected Empire Fed Manufacturing to bounce back from March’s tumble to one year lows and they were right with the headline index rising from -20.0 to -8.1 (considerably better than the -13.5), but still negative. However, while current conditions jumped, expectations plunged to the lowest since 9/11/.
Its Monday! Typically we see Blue Mondays. But not with the tariff war between China and the US. We are watching a chess match between Trump and China. Dow futures are up 461 points at 9am EST.
Obama/Biden/Harris/Schumer/Pelosi have let the US be the punks for China. Trump is simply trying to level the playing field and China’s Xie doesn’t like the new equilibrium.
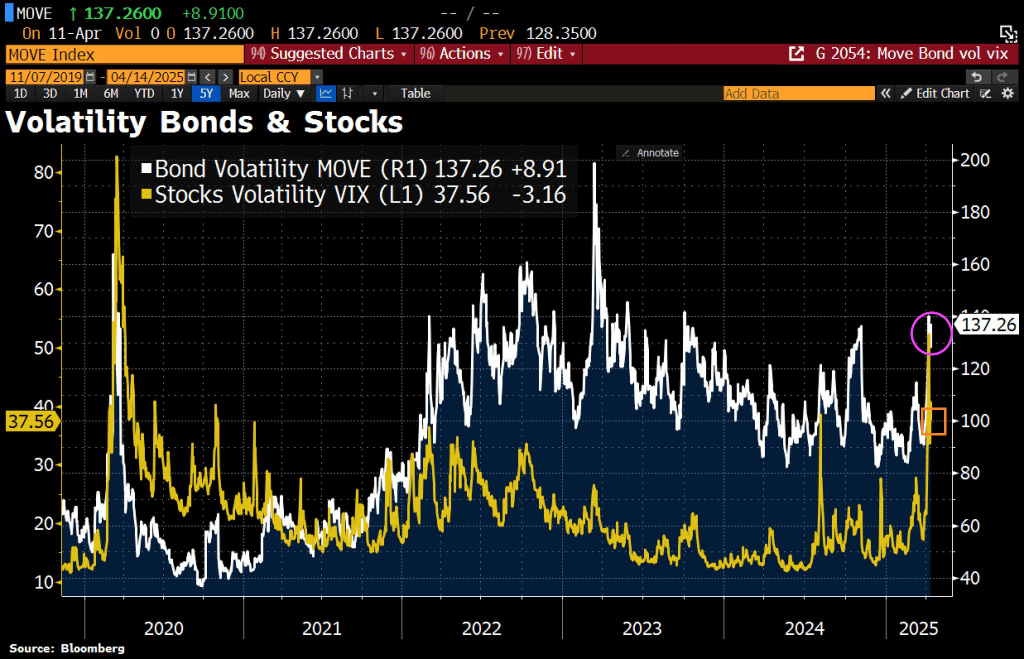
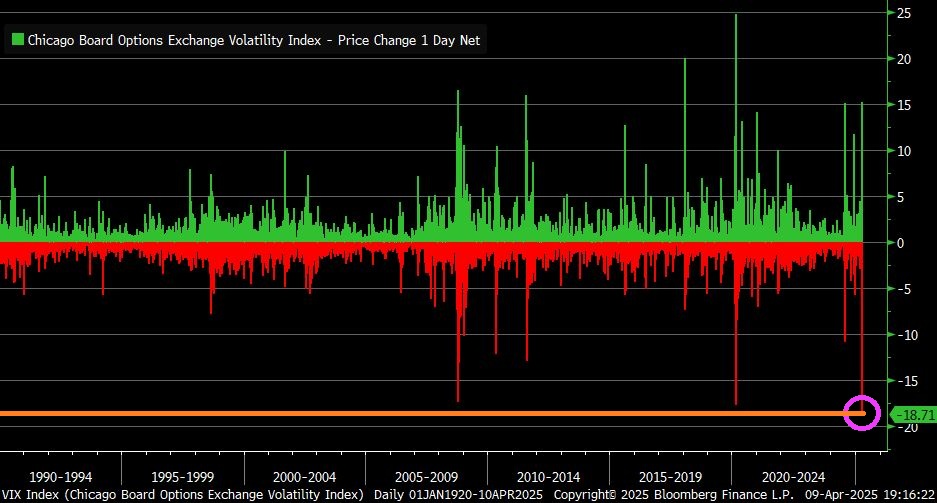
VIX Index fell by 18.7 points yesterday … largest one-day decline in history.
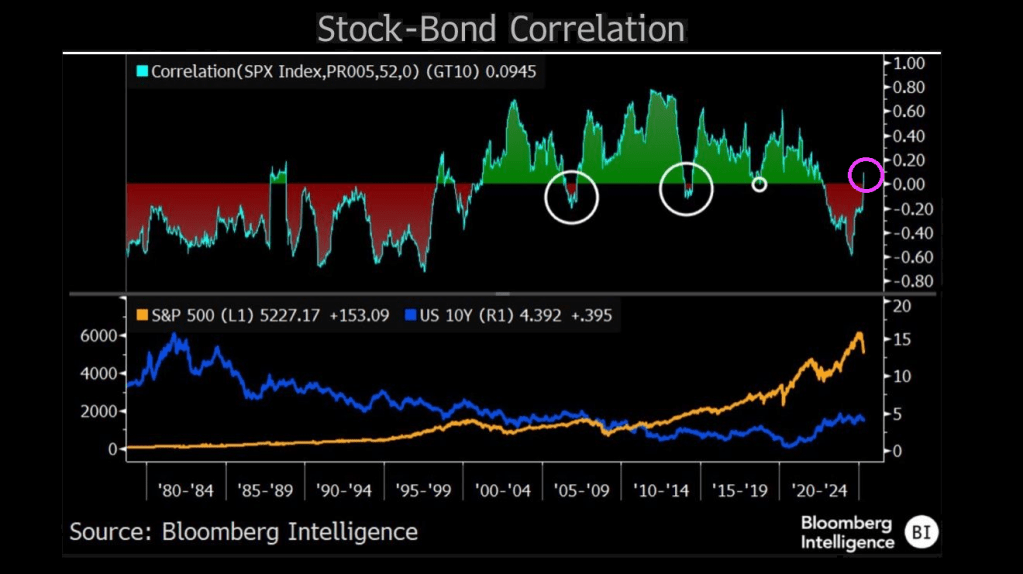
The correlation between stock prices and bond yields has returned to positive territory — hinting at a period of distress in equities and a regime shift in equity and bond markets where recession fears, rather than inflation, may be starting to drive direction of both. The correlation between the two asset classes was positive for the better part of 20 years prior to the pandemic, suggesting equities trended in the direction of yields as inflation mostly coincided with growth. Stocks held a negative correlation to yields throughout most of the 1980s and 1990s, when inflation hurt stocks — and that phenomenon returned for the 2022-24 bear market and recovery period.
Notably, major stock corrections occurred each time the correlation jumped out of its primary regime.
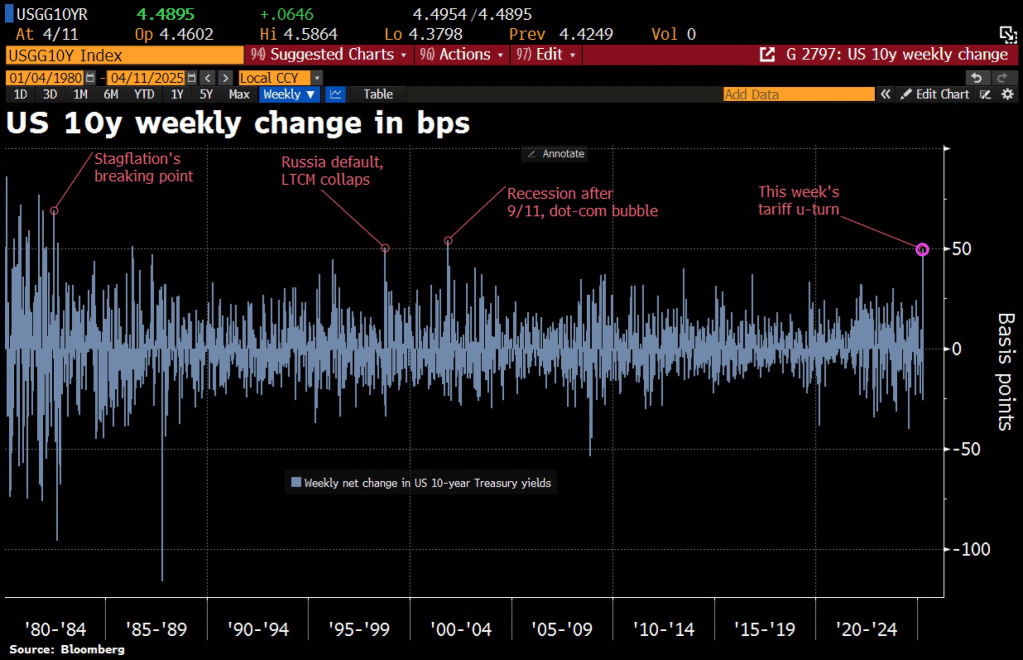
Thunderstruck! The tariff kerfuffle between the Trump Administration and China is causing turbulence in the Treasury market. The 10-year Treasury rate is soaring with China’s counterpunching.
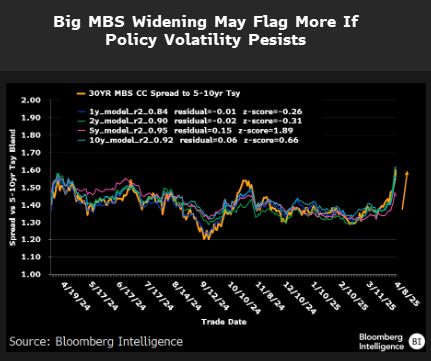
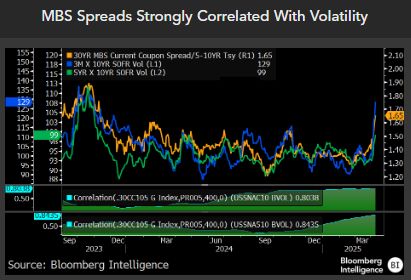
MBS spreads are widening.
Along with volatility.
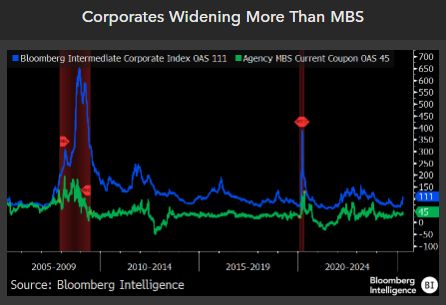
But corporate spreads are widening more than MBS spreads.
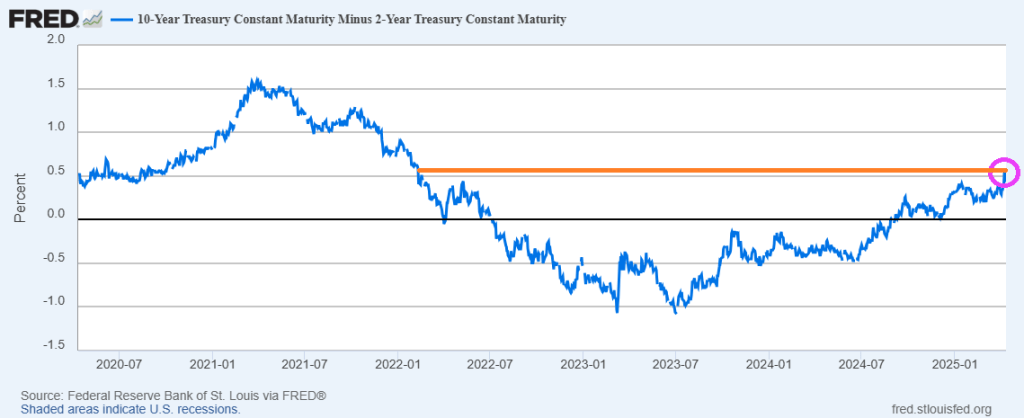
The 10Y-2Y yield curve has risen to the highest level since the early days of “China Joe” Biden.
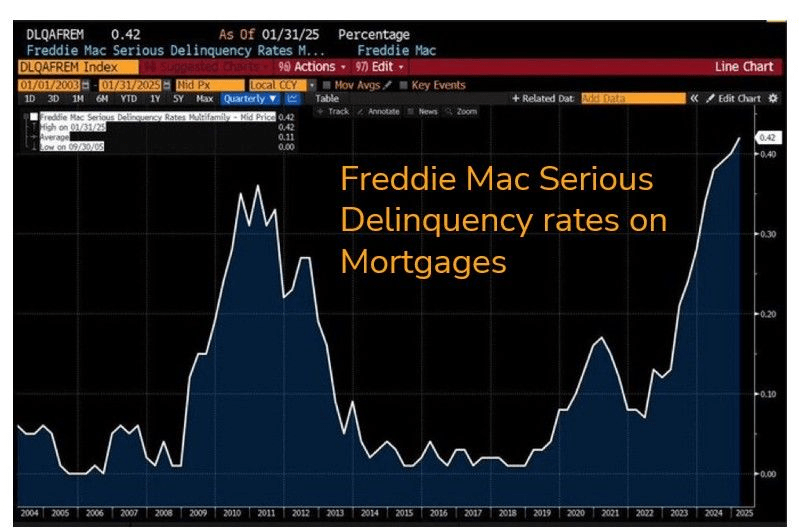
On a related note, Freddie Mac serious delinquency rates on mortgages is now the highest since the financial crisis.
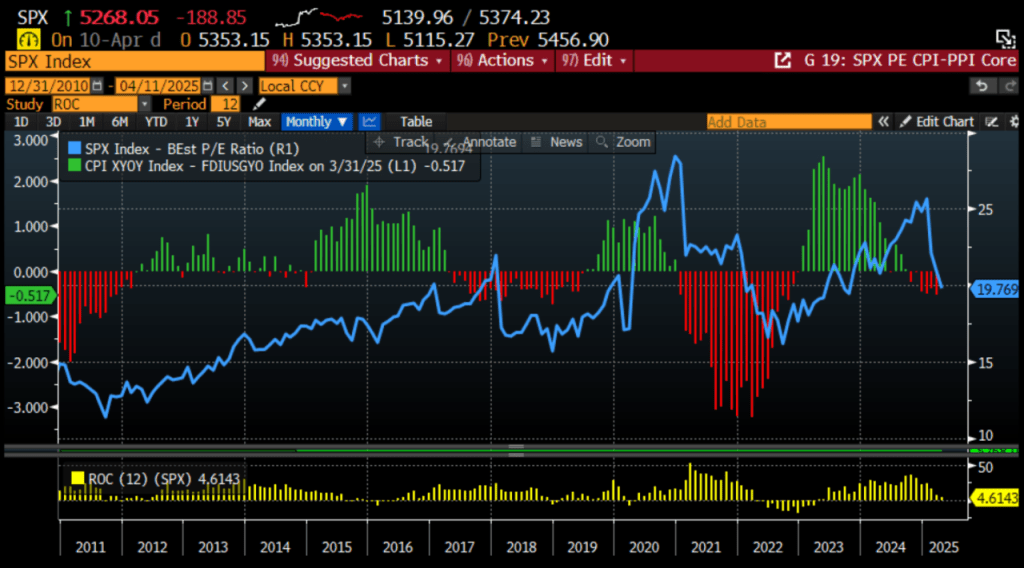
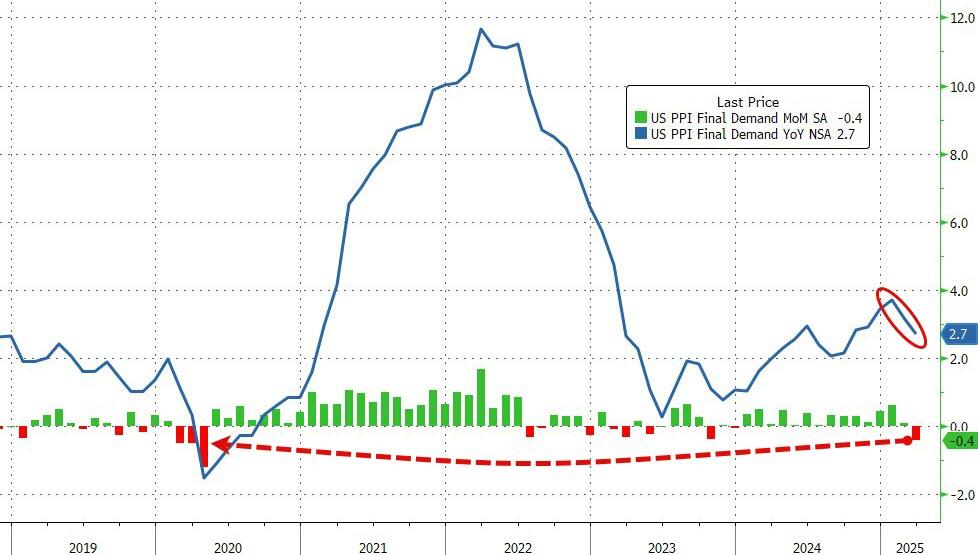
Headline PPI fell (yes fell) 0.4% MoM (dramatically cooler than the 0.2% MoM rise expected), dragging the headline index down to +2.7% YoY.
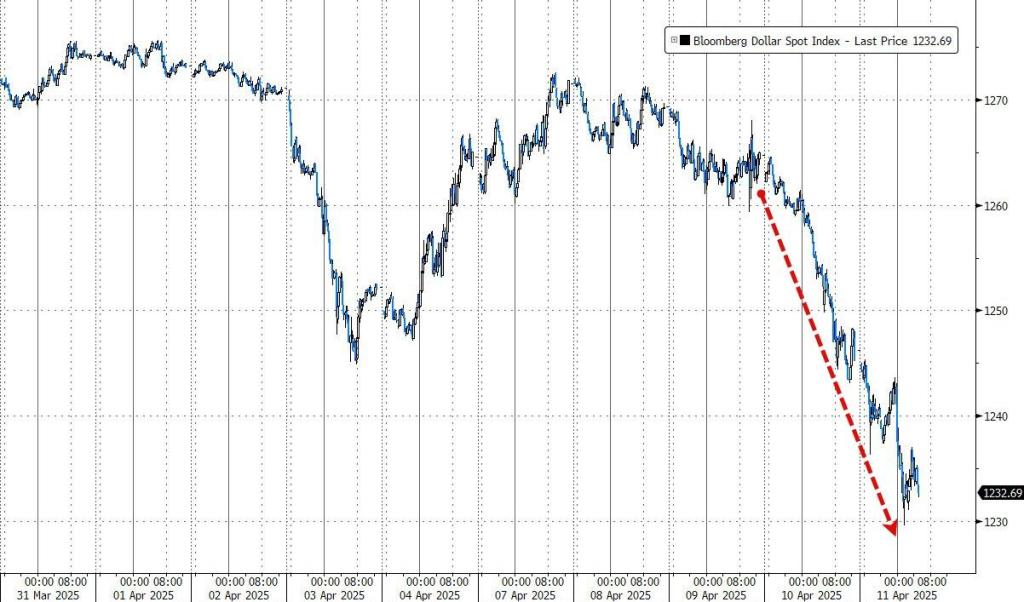
The market is re-assessing the structural attractiveness of the dollar as the world’s global reserve currency and is undergoing a process of rapid de-dollarization.


You must be logged in to post a comment.