The problem with the national debt can’t be fixed with Mitch McConnell still in the Senate and too many Obama-era political hacks still in Washington DC.
The Obama/Biden era began in 2009 and it still exists despite Trump winning the Presidency for 2025. The Obama/Biden regime along with Congressional assistance drove up US Federal Debt to around $36 TRILLION. That is an increase of a staggering 236% since Obama/Biden were sworn into office in January 2009. And Federal spending is up 121%.
Unfortunately, Trump cannot pull a Javier Milei (Argentina’s libertarian President) and obliterate the bloated carcas of Federal bureaucracy. Democrats and RINOs like Mitch McConnell will work overtime thwarting Trump’s efforts to control the bloat.
And don’t forget the $221 TRILLION in unfunded liabilities (promises) that Congress had made to get elected. That will eventually become Federal debt.
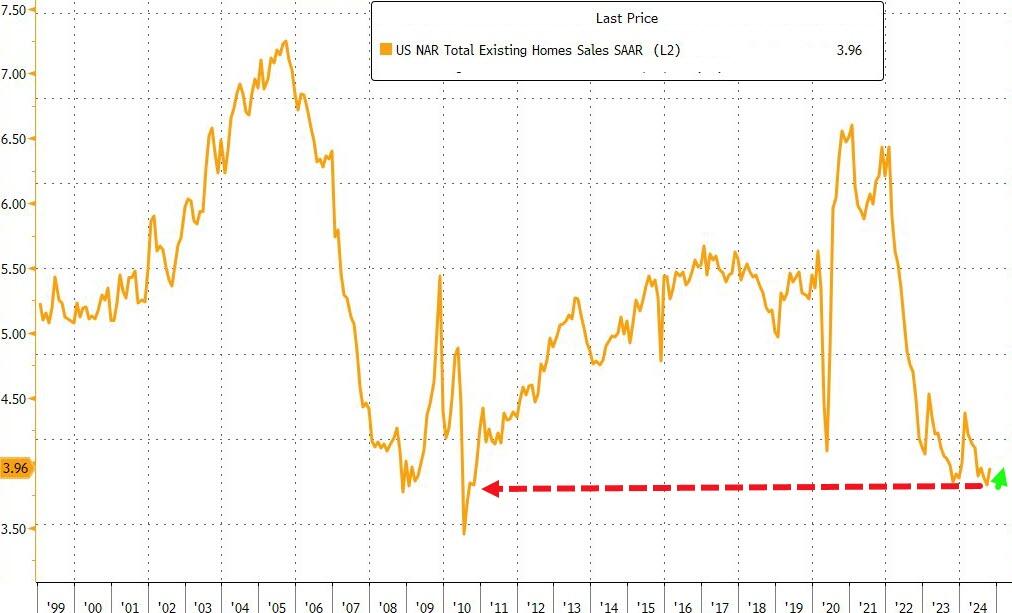
…but in context, that shift up to 3.96mm SAAR homes sold is nothing…
Source: Bloomberg
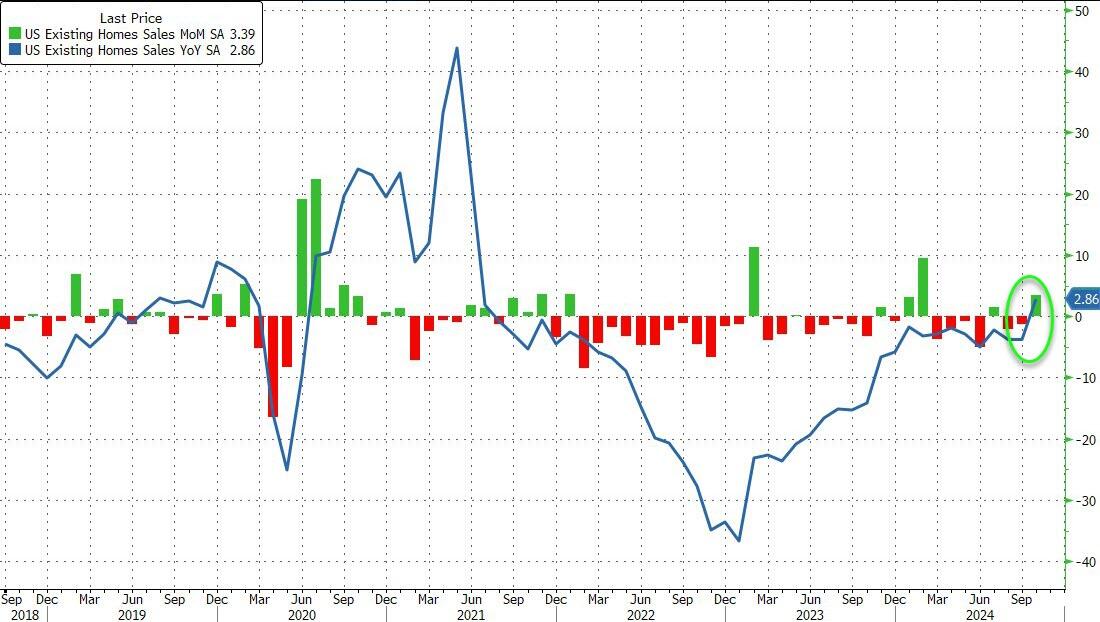
High borrowing costs have led to a shortage of previously owned homes on the market, discouraging many would-be home sellers from listing their properties for sale and having to part with their current low financing costs.
“Additional job gains and continued economic growth appear assured, resulting in growing housing demand,” NAR Chief Economist Lawrence Yun said in a prepared statement.
“While mortgage rates remain elevated, they are expected to stabilize.”
Last month, the inventory of available homes edged up 0.7% to 1.37 million, continuing to trend higher although well below pre-pandemic levels.
Despite the weakness in sales, tight inventory is keeping prices elevated, yielding one of the least affordable housing markets on record. The median sale price last month increased 4% from a year earlier to $407,200, the highest ever for any October, the NAR figures show.
Contract signings rose in all four US regions, led by a 6.7% jump in the Midwest.
Sales of single-family homes increased 3.5% in October; purchases of condominiums and co-ops were up 2.7%
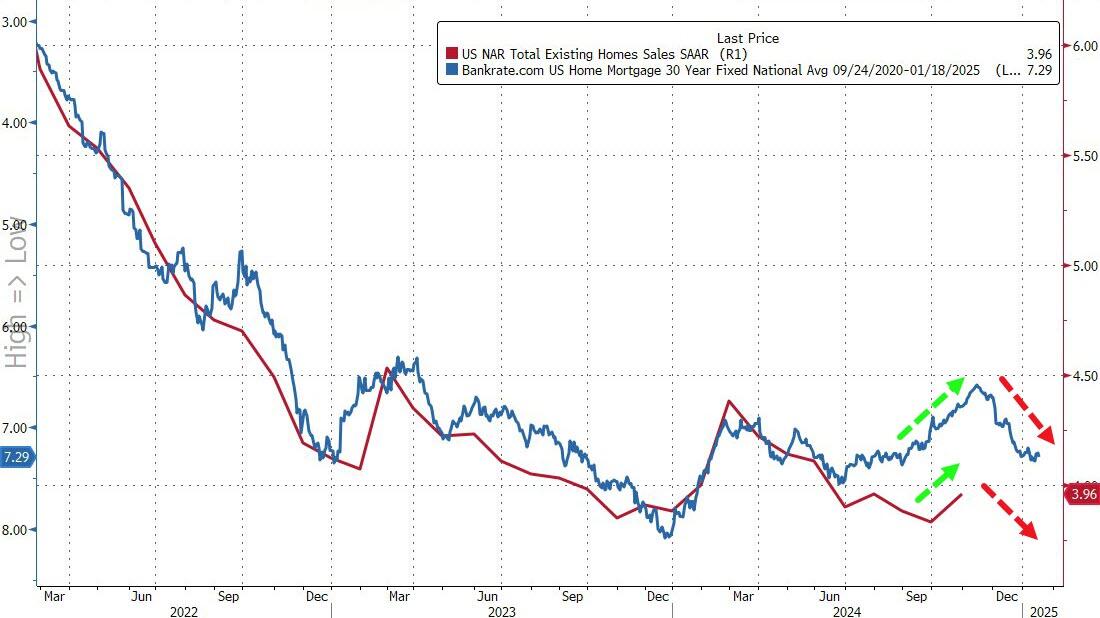
Finally, while that’s all very exciting – a scintilla of growth off almost record lows – the fecal matter is about to strike the rotating object as rising mortgage rates lagged impact threatens…
Source: Bloomberg
In October, 59% of homes sold were on the market for less than a month, compared with 57% in September, and 19% sold above the list price. Properties remained on the market for 29 days on average, compared with 28 days in the previous month. First-time buyers made up 27% of purchases, still historically low.
Fortunately, the Biden/Harris administration is winding down. On the mortgage side, the mortgage market is already gone under Biden/Harris where mortgage purchase applications are down a whopping 60%.
Mortgage applications increased 1.7 percent from one week earlier, according to data from the Mortgage Bankers Association’s (MBA) Weekly Mortgage Applications Survey for the week ending November 15, 2024.
The Market Composite Index, a measure of mortgage loan application volume, increased 1.7 percent on a seasonally adjusted basis from one week earlier. On an unadjusted basis, the Index decreased 1 percent compared with the previous week. The seasonally adjusted Purchase Index increased 2 percent from one week earlier. The unadjusted Purchase Index decreased 3 percent compared with the previous week and was 1 percent lower than the same week one year ago. And down -60% under Biden/Harris.
The Refinance Index increased 2 percent from the previous week and was 43 percent higher than the same week one year ago.
Slowing economy, rising rates, too expensive housing. Not a good sign for the mortgage market.
A recent paper by Michael Stegman, Ted Tozer and Richard Green reminds me of The Who’s song “Won’t Get Fooled Again.” Except that apparently Stegman, Tozer and Green did get fooled again.
I remember testifying in the House of Representatives in Washington DC on the financial crisis and housing markets. I pointed out that low down payment mortgages lending to households with low credit scores was very dangerous. I had the data and presented it to the House committee on financial services.
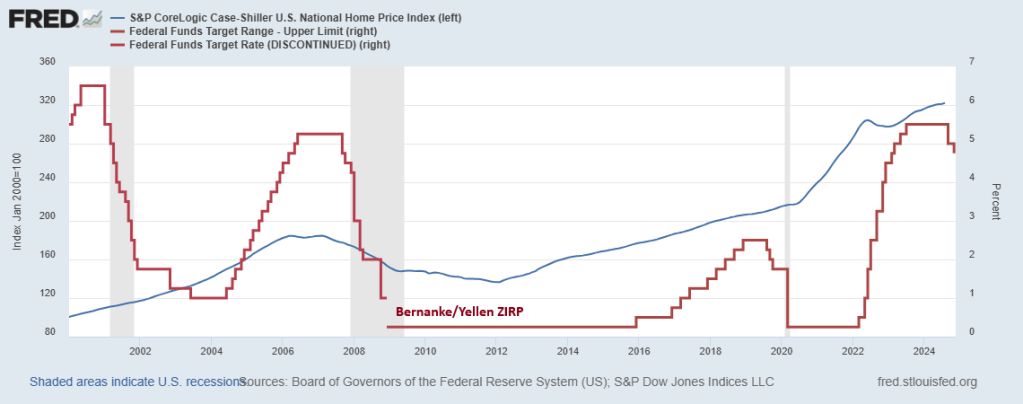
The problem with Stegman et al’s paper is that it ignores The Federal Reserve and Federal spending. After the financial crisis of 2008 when housing prices declined (especially in bubble states like Arizona, Nevada and Florida), Berananke and Yellen adopted a zero interest rate policy that resulted in housing prices rising again. Then we have Powell’s lowering of rates to near-zero following the Covid outbreak and the insane level of Federal spending that ensued helping to drive housing prices to dangerous bubble levels. Making first time homeowner purchases almost impossible.
So, like the 2000s, the pursuit of homeownership will lead to insance policy proposals. If nothing else, the Stegman et al proposal will lead to MORE inflation in housing prices and set the stage for a housing bubble burst of epic proportions.
Apparently, Stegman et al DID get fooled again. Or they just don’t care.
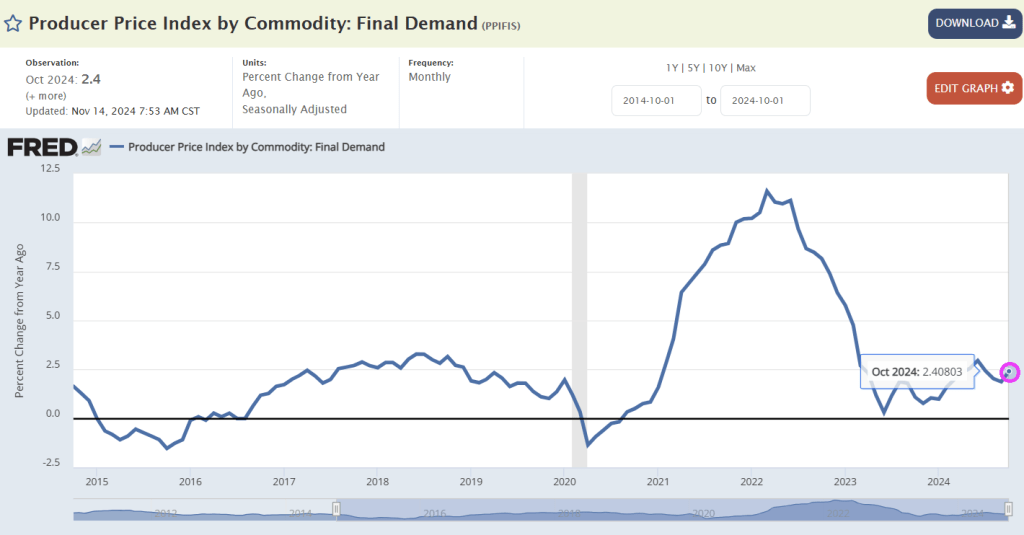
After yesterday’s in line – but really cooler than whispered – CPI which restored hope in a December rate cut, all eyes are on this morning’s PPI print to boost dovish hopes that the Fed’s easing cycle would remain on track. It was not meant to be, however, as the PPI came in hotter than expected across the board on both a monthly and annual basis.
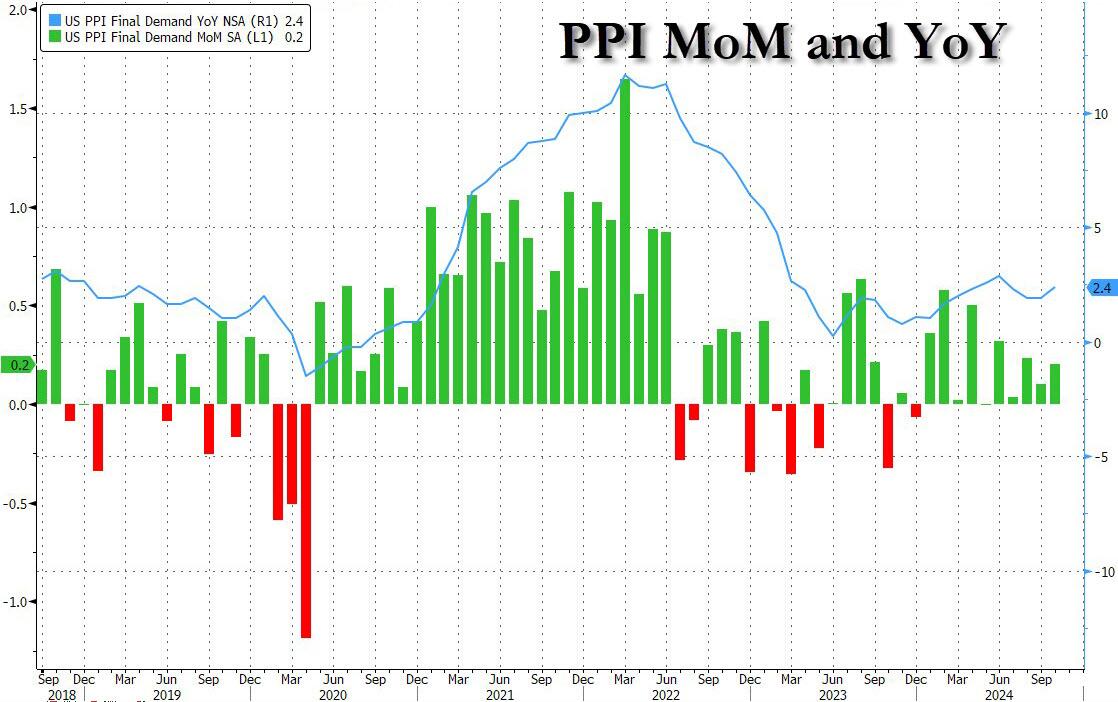
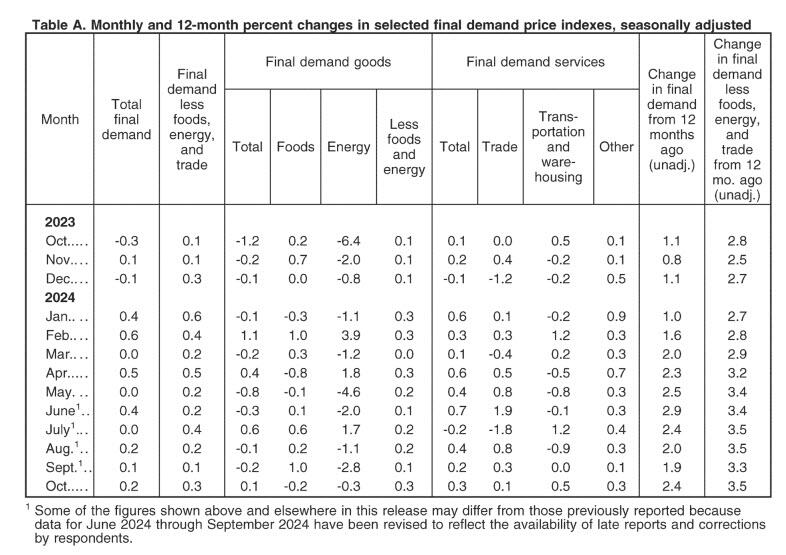
Starting at the top, headline PPI rose 0.2% MoM (in line with the +0.2% expected) but September was revised higher from 0.0% to 0.1%; meanwhile on an annual basis, headline PPI rose 2.4%, higher than the 2.3% expected, with the last month also revised higher from 1.8% to 1.9%.
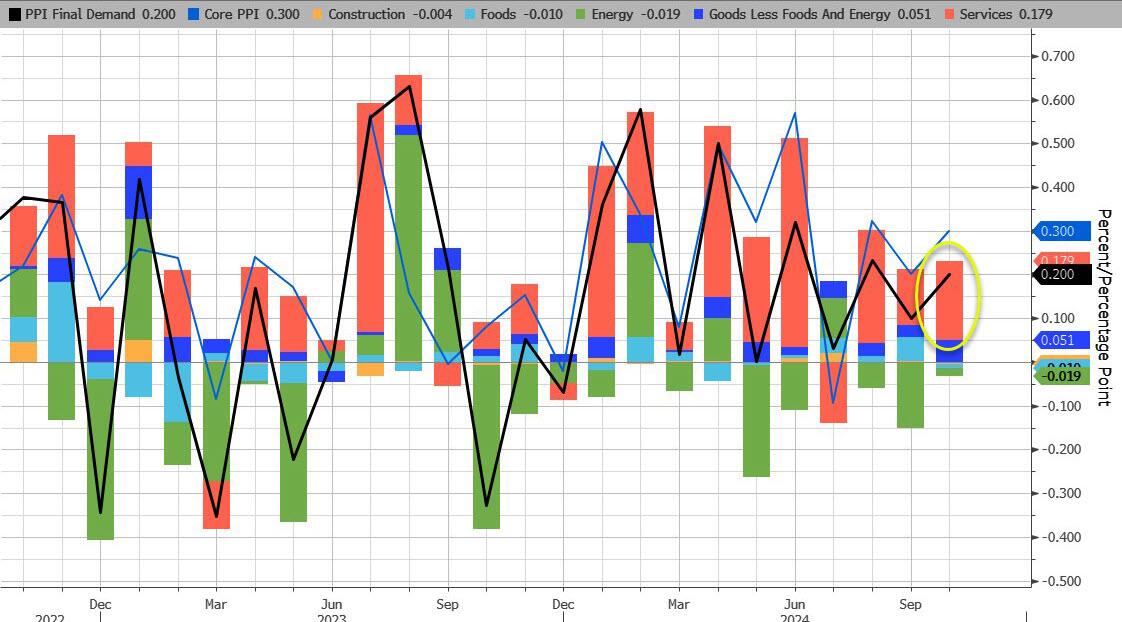
Unlike last month when a drop in energy prices weighed heavily on the headline PPI number, this month energy subtracted just 0.02% from the final print, the lowest detraction since July. Meanwhile, Services added a hefty 0.179% to the bottom line number.
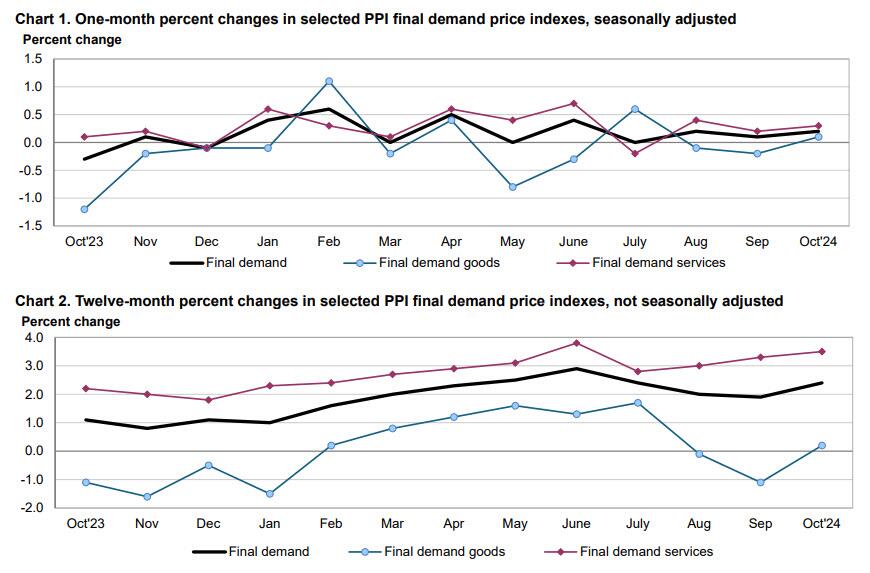
Indeed, according to the BLS, most of the rise in final demand prices can be traced to a 0.% advance in the index for final demand services. Prices for final demand goods inched up 0.1%, the first increase in the index since July.
Taking a closer look at the components:
Final demand services: The index for final demand services increased 0.3 percent in October after rising 0.2 percent in September. Over three-fourths of the broad-based advance in October is attributable to prices for final demand services less trade, transportation, and warehousing, which moved up 0.3 percent. The indexes for final demand transportation and warehousing services and for final demand trade services also increased, 0.5 percent and 0.1 percent, respectively. (Trade indexes measure changes in margins received by wholesalers and retailers.)
Product detail:
Over one-third of the rise in the index for final demand services can be traced to prices for portfolio management, which advanced 3.6 percent. The indexes for machinery and vehicle wholesaling; airline passenger services; computer hardware, software, and supplies retailing; outpatient care (partial); and cable and satellite subscriber services also moved higher.
In contrast, margins for apparel, footwear, and accessories retailing fell 3.7 percent. Prices for securities brokerage, dealing, investment advice, and related services and for truck transportation of freight also declined.
Final demand goods: The index for final demand goods inched up 0.1 percent in October following two consecutive decreases. The advance can be traced to a 0.3-percent rise in prices for final demand goods less foods and energy. Conversely, the indexes for final demand energy and for final demand foods declined 0.3 percent and 0.2 percent, respectively.
Product detail:
An 8.4-percent increase in the index for carbon steel scrap was a major factor in the advance in prices for final demand goods. The indexes for meats, diesel fuel, fresh and dry vegetables, and oilseeds also moved higher.
In contrast, prices for liquefied petroleum gas fell 18.1 percent. The indexes for chicken eggs, processed poultry, and ethanol also decreased.
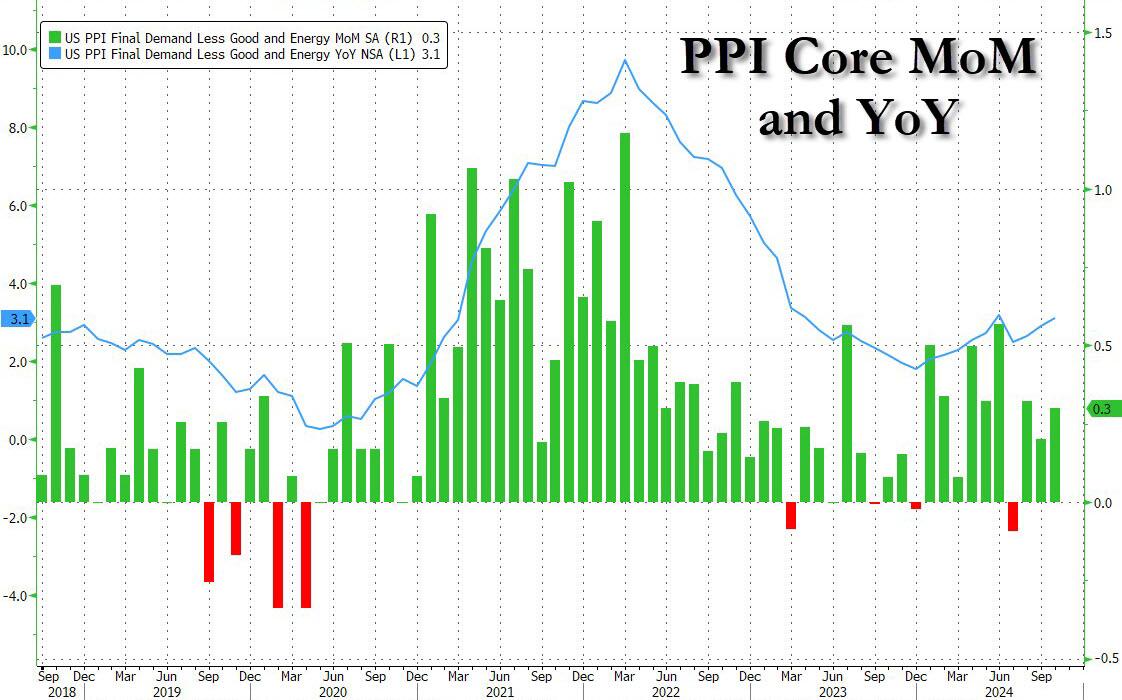
Even more problematic for the doves, however, is that core PPI jumped to +3.1% YoY (hotter than the 3.0% exp) with the prior month revised higher to 2.9% from 2.8%. This was the second hottest print going back to March 2023 with just the June outlier surge hotter than October…
… as sticky Services costs continue to rise.
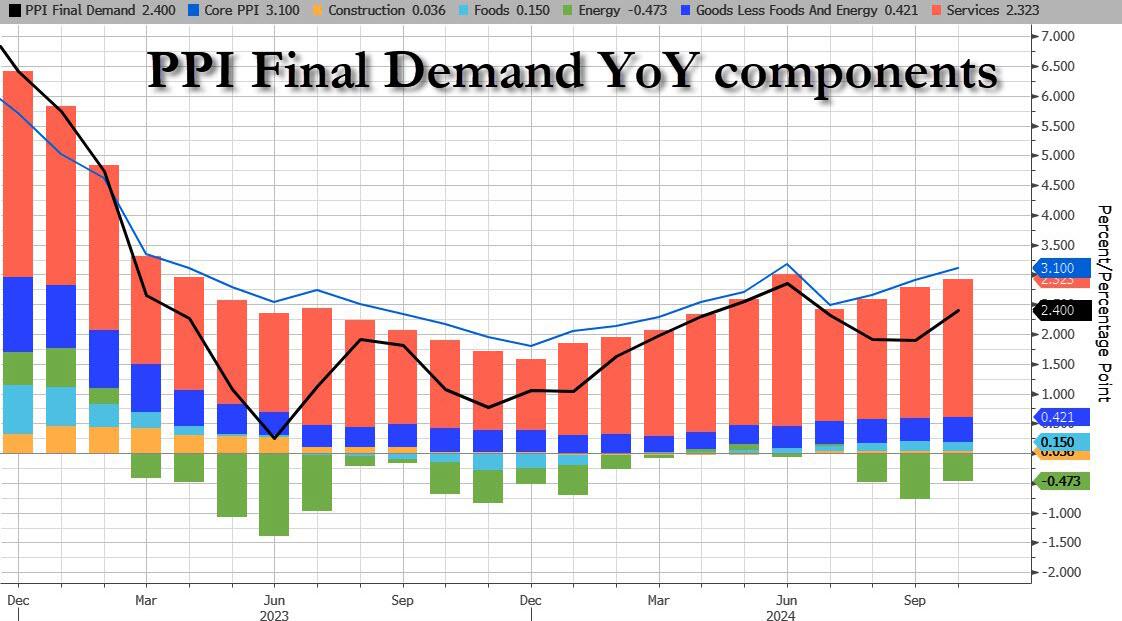
The hotter than expected PPIs have pushed yields and the dollar higher, even as the market waits to see the details of what impact today’s numbers will have on the Fed’s preferred core PCE metric – according to UBS key PPI components to PCE look hot – although Bloomberg noted a big jump in air passenger services (3.2%), which suggests some upside risks (i.e., 0.3% core PCE).
The most notable takeaway from the data appears to be the increase in final demand for services in October, which is similar to the factors that increased CPI yesterday — shelter, food and energy, which are components the Fed cannot control with interest rates.
Bottom line: this is a long way from the Fed’s mandated 2%, and it’s moving in the wrong direction, something which has not been lost on the market, where Treasury curves are flattening after the data, which suggests traders are wavering over the prospects of a December rate cut. That has yet to be reflected in rates markets — bets have been trimmed but marginally, not enough to really change the swaps market outlook as of now. According to BBG’s Vince Cignarella, sizeable block trades are going through Treasuries, mostly in the five-year tenor and some ten-year tenors, which looks like positioning for higher yields and flatter curves.
The US Treasury yield curve (10Y-2Y CMT) went negative on April 1, 2024. And remains positive.
The US Treasury 10Y-2Y CMT (constant maturity Treasury) peaked locally on March 29, 2024 and then fell, eventually turning negative on April 1, 2024. And remained negative until August 30, 2024 just prior to the election. It looks like the yield curve accurately predicted the election of Trump.
The 10-year Treasury yield is rising with a positive economic outlook under Trump. And with that optimism we see mortgage rates rising too.
The Market Composite Index, a measure of mortgage loan application volume, decreased 10.8 percent on a seasonally adjusted basis from one week earlier. On an unadjusted basis, the Index decreased 12 percent compared with the previous week. The seasonally adjusted Purchase Index decreased 5 percent from one week earlier. The unadjusted Purchase Index decreased 7 percent compared with the previous week and was 2 percent higher than the same week one year ago.
The Refinance Index decreased 19 percent from the previous week and was 48 percent higher than the same week one year ago.
“Ten-year Treasury rates remain volatile and continue to put upward pressure on mortgage rates. The 30-year fixed rate last week increased to 6.81 percent, the highest level since July,” said Joel Kan, MBA’s Vice President and Deputy Chief Economist. “Applications decreased for the sixth consecutive week, with purchase activity falling to its lowest level since mid-August and refinance activity declining to the lowest level since May. The average loan size on a refinance application dropped below $300,000, as borrowers with larger loans tend to be more sensitive to any given changes in mortgage rates.”
The refinance share of mortgage activity decreased to 39.9 percent of total applications from 43.1 percent the previous week. The adjustable-rate mortgage (ARM) share of activity increased to 7.0 percent of total applications.
The FHA share of total applications decreased to 15.5 percent from 16.4 percent the week prior. The VA share of total applications decreased to 12.5 percent from 14.6 percent the week prior. The USDA share of total applications increased to 0.5 percent from 0.4 percent the week prior.
The average contract interest rate for 30-year fixed-rate mortgages with conforming loan balances ($766,550 or less) increased to 6.81 percent from 6.73 percent, with points decreasing to 0.68 from 0.69 (including the origination fee) for 80 percent loan-to-value ratio (LTV) loans. The effective rate increased from last week.
The average contract interest rate for 30-year fixed-rate mortgages with jumbo loan balances (greater than $766,550) increased to 6.98 percent from 6.77 percent, with points increasing to 0.65 from 0.49 (including the origination fee) for 80 percent LTV loans. The effective rate increased from last week.
The average contract interest rate for 30-year fixed-rate mortgages backed by the FHA increased to 6.75 percent from 6.55 percent, with points decreasing to 0.87 from 0.94 (including the origination fee) for 80 percent LTV loans. The effective rate increased from last week.
The average contract interest rate for 15-year fixed-rate mortgages decreased to 6.21 percent from 6.27 percent, with points decreasing to 0.55 from 0.77 (including the origination fee) for 80 percent LTV loans. The effective rate decreased from last week.
The average contract interest rate for 5/1 ARMs decreased to 6.05 percent from 6.20 percent, with points increasing to 0.84 from 0.59 (including the origination fee) for 80 percent LTV loans. The effective rate decreased from last week.
The bond market is reacting to the election of Trump with a clear Bear Steepening.
Bear steepening happens when yields move up across tenors, but long-end yields move up even faster than short-end yields.
This isn’t going to help mortgage applications due to lowering rates.
Congress went wild spending on Covid relief and related wasteful spending. Notice that the impetus for job openings (spending) occurred before “Angry Joe” Biden and Commie-la Harris were sworn in. So, the job creation claims by Biden/Harris were put into motion before they assumed office.
The lag in job openings growth after the surge in spending is clearly visible in the following chart, as is the BURNOUT in job openings growth after Covid spending burned out.
Harris is promising explosive spending if elected. And she is promising MORE regulations! And the regulatory burden will grow.
Under Biden/Harris, native born workers lost -2.7 million jobs in 2014 while foreign-born workers gained 13.4 million jobs. THAT is the great replacement of American workers.
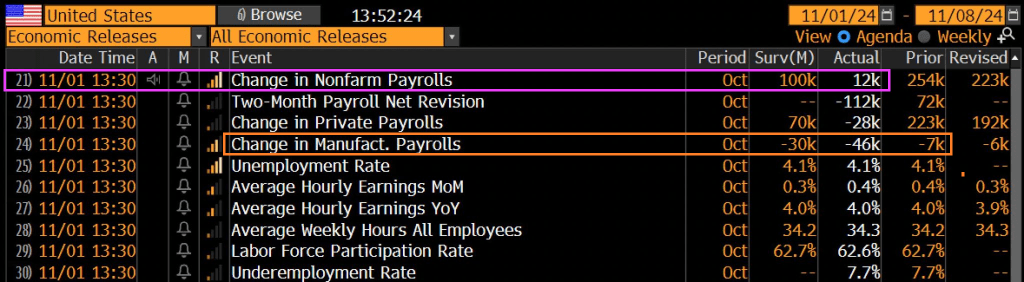
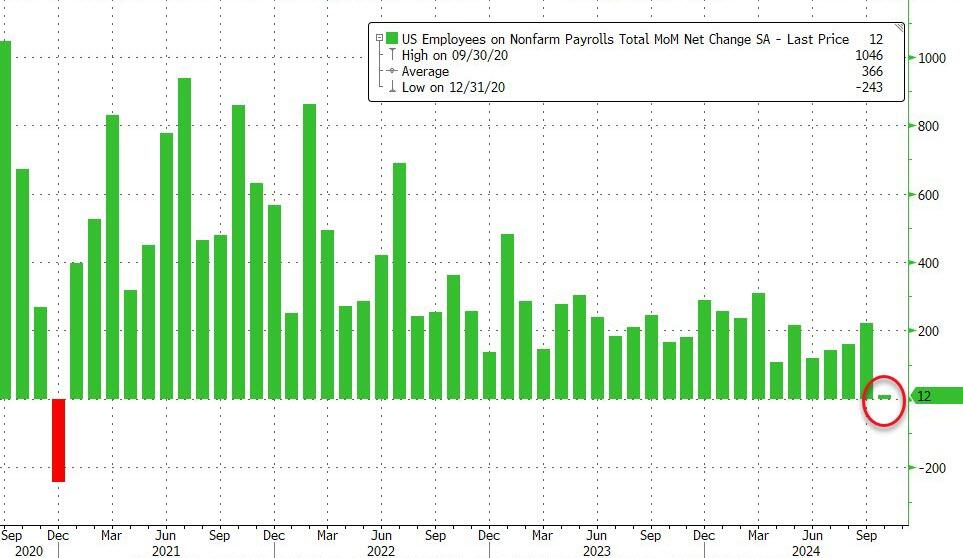
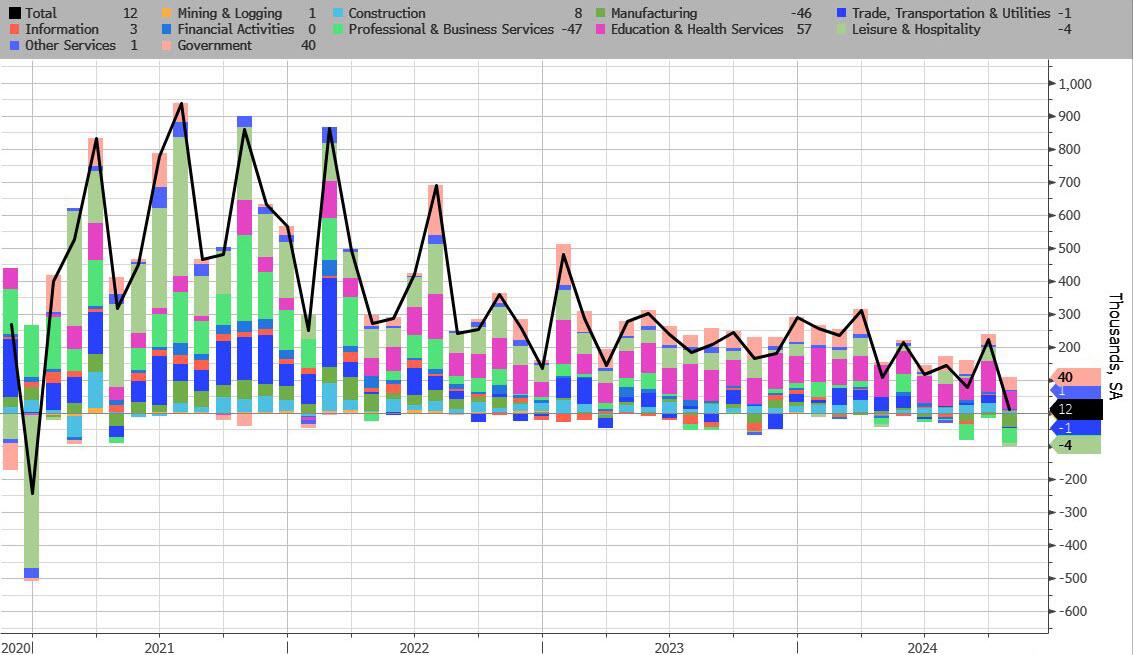
Total jobs including government rose by a measly 12k.
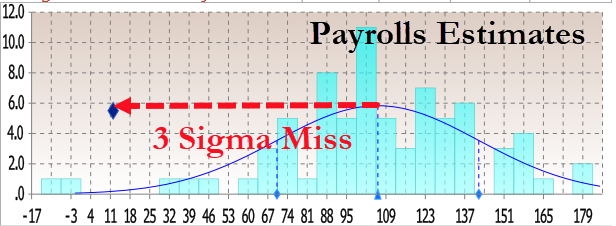
The print was so low it was only above the two lowest estimates (those of Bloomberg Econ for -10K and ABN Amr0 for a 0 print). That means it was a 3 sigma miss to estimates.
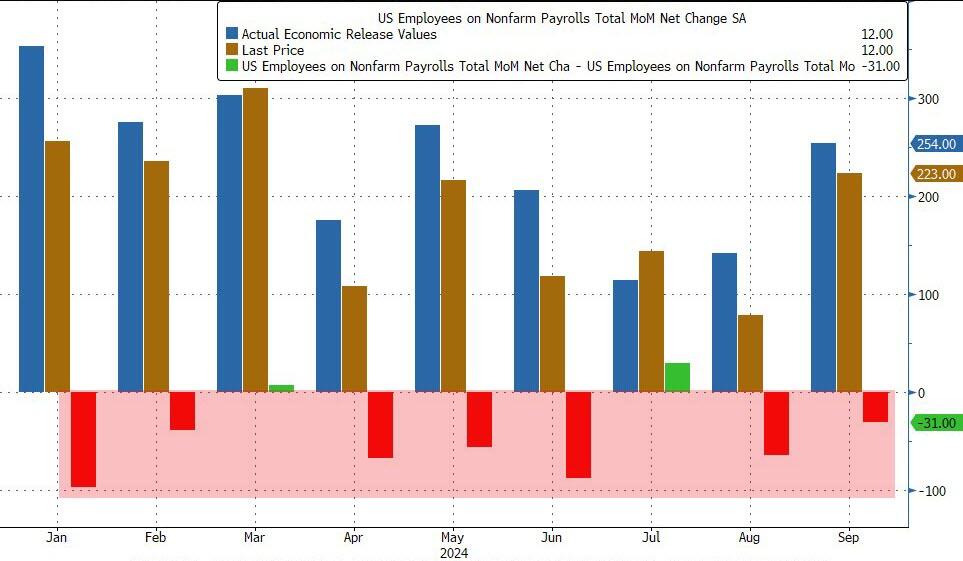
And of course, as has been the case for the entire Biden admin, previous months were revised sharply lower once again: August was revised down by 81,000, from +159,000 to +78,000, and September was revised down by 31,000, from +254,000 to +223,000. With these revisions, employment in August and September combined is 112,000 lower than previously reported. This means that even after the monster September revision when 818K jobs were removed, 7 of the past 9 months were again revised lower!
This means that once the November jobs are released, we can be virtually certain that October will be revised to negative.
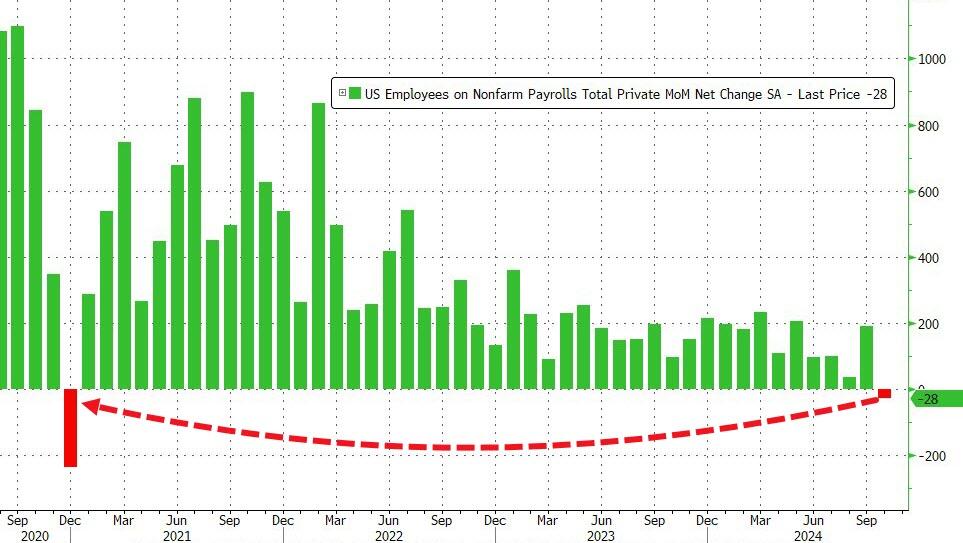
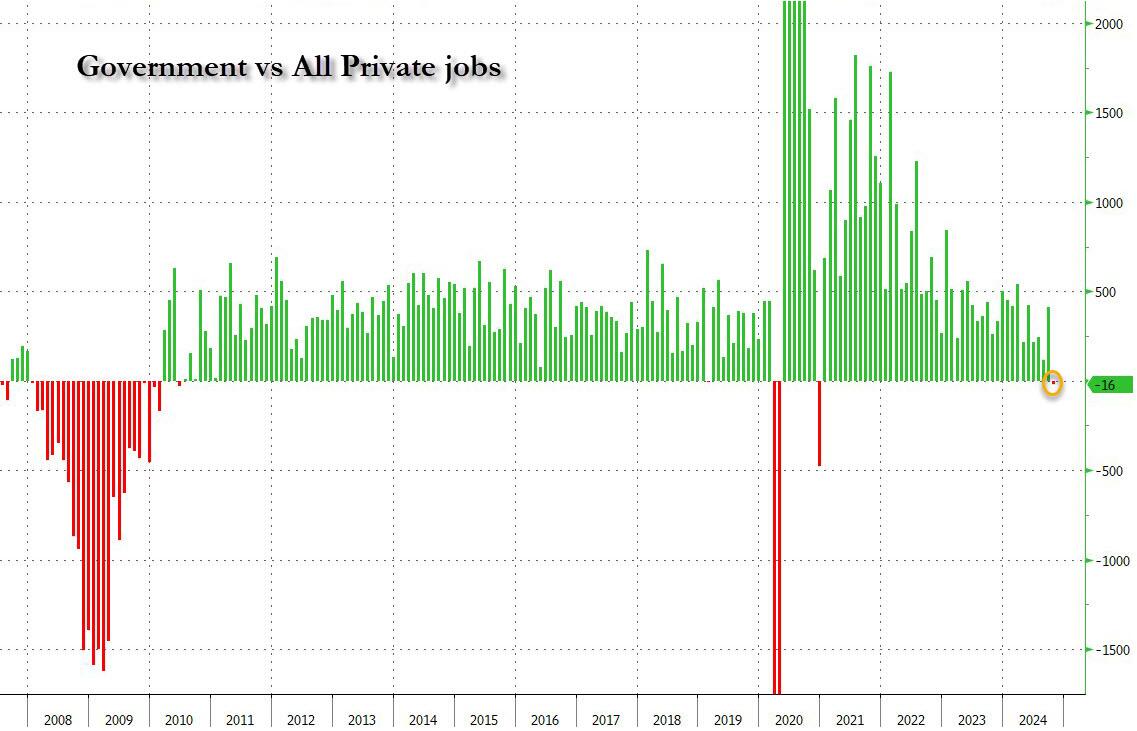
But wait, there’s more because while the total payroll number was just barely positive, if one excludes the 40K government jobs, private payrolls was in fact negative to the tune of -28K, down from 223K pre-revision last month, and the first negative print since December 2020. In other words, we were right… when it comes to actual, non-parasite “government” jobs.
To be sure, a big part of the drop was due to the one-time event discussed, including the Boeing strike and Hurricanes Helene and Milton. This is what the BLS said on the topic: “In October, the household survey was conducted largely according to standard procedures, and response rates were within normal ranges” however, “the initial establishment survey collection rate for October was well below average. However, collection rates were similar in storm-affected areas and unaffected areas. A larger influence on the October collection rate for establishment data was the timing and length of the collection period. This period, which can range from 10 to 16 days, lasted 10 days in October and was completed several days before the end of the month.”
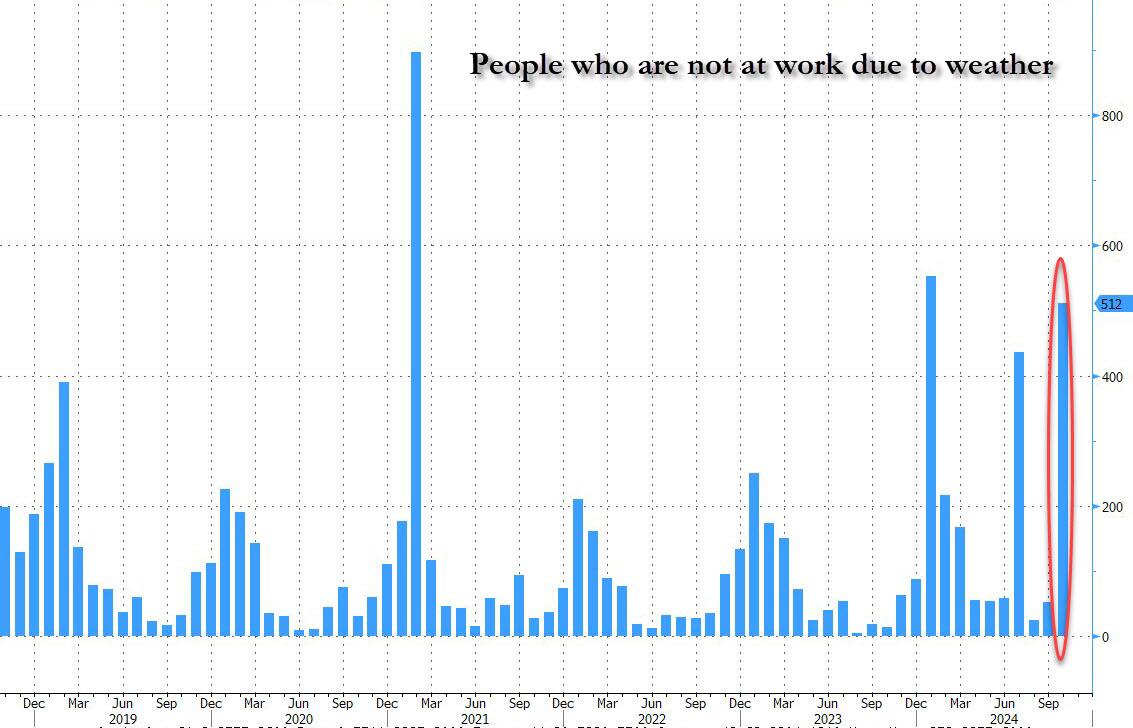
More importantly, the BLS said that “it is likely that payroll employment estimates in some industries were affected by the hurricanes; however, it is not possible to quantify the net effect on the over-the-month change in national employment, hours, or earnings estimates because the establishment survey is not designed to isolate effects from extreme weather events. There was no discernible effect on the national unemployment rate from the household survey.”
Ironically, while the BLS was unable to “quantify the net effect” from the hurricanes, it was able to calculate that the number of people not at work due to weather surged to the third highest in recent history, up 512K!
In other words, the BLS now has an excuse to blame the plunge on, it just doesn’t know how to quantify it. Translation: if Trump is president next month, expect the downtrend to continue with little to no mention of hurricane as the BLS prepares to admit the true state of the labor market; if however Kamala wins, the November jobs will magically rebound (even as downward revisions accelerate) and all shall be back to fake normal.
Oh, and of course, today’s catastrophic jobs print gives the Fed a full carte blanche to again cut 25bps next week, even if the plunge was all hurricanes…
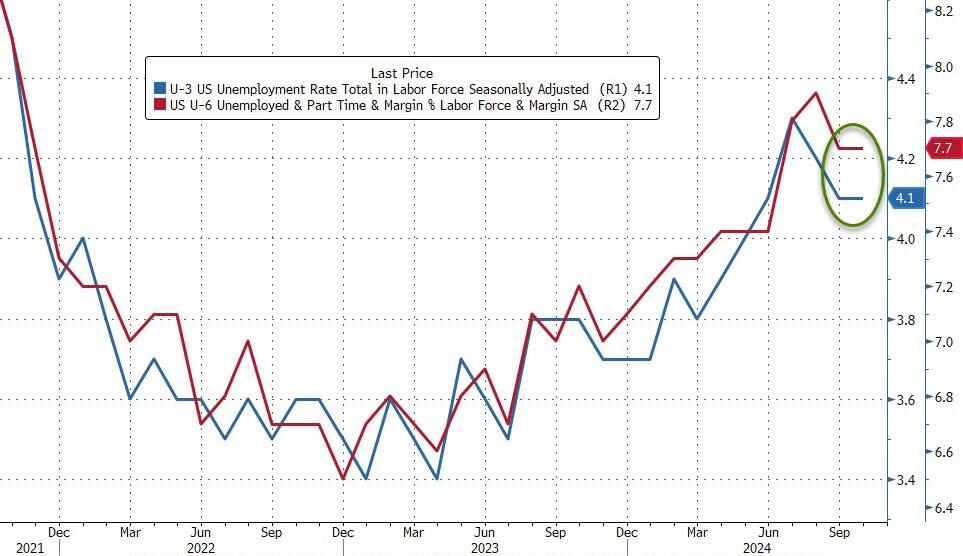
The rest of the jobs report was not that exciting: the unemployment rate printed at 4.1%, unchanged from last month and in line with expectations. The number of unemployed people was little changed at 7.0 million.
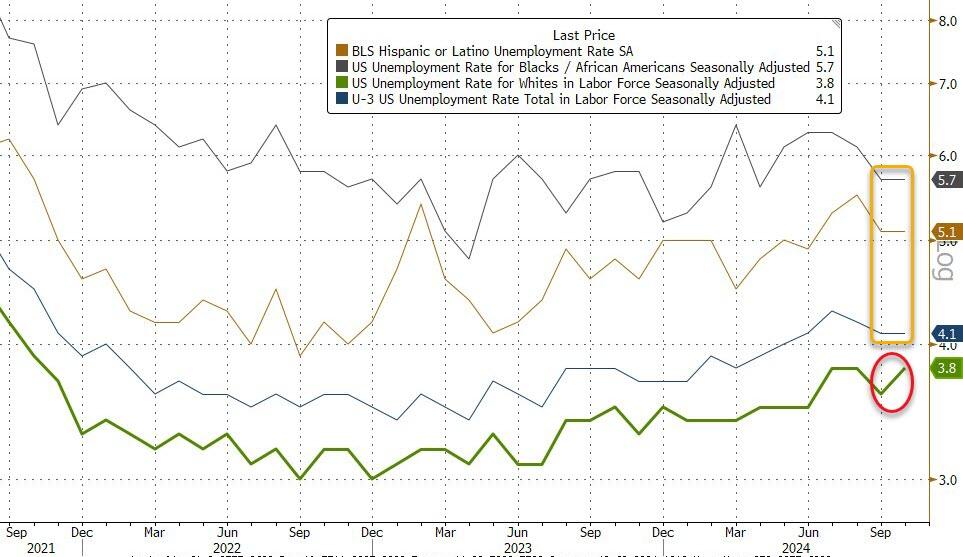
Among the major worker groups, the unemployment rates for adult men (3.9 percent), adult women (3.6 percent), teenagers (13.8 percent), Whites (3.8 percent), Blacks (5.7 percent), Asians (3.9 percent), and Hispanics (5.1 percent) showed little or no change over the month.
It’s worth noting that the unemployment rate actually rose almost 0.1% despite being reported as flat because in September it was 4.05% and in October it was 4.145%, and rose due to a surge in layoffs (+166K) as well as re-entrants (+108K). Additionally, as Southbay research notes, the average duration of unemployment rose from 22.6 weeks to 22.9 weeks
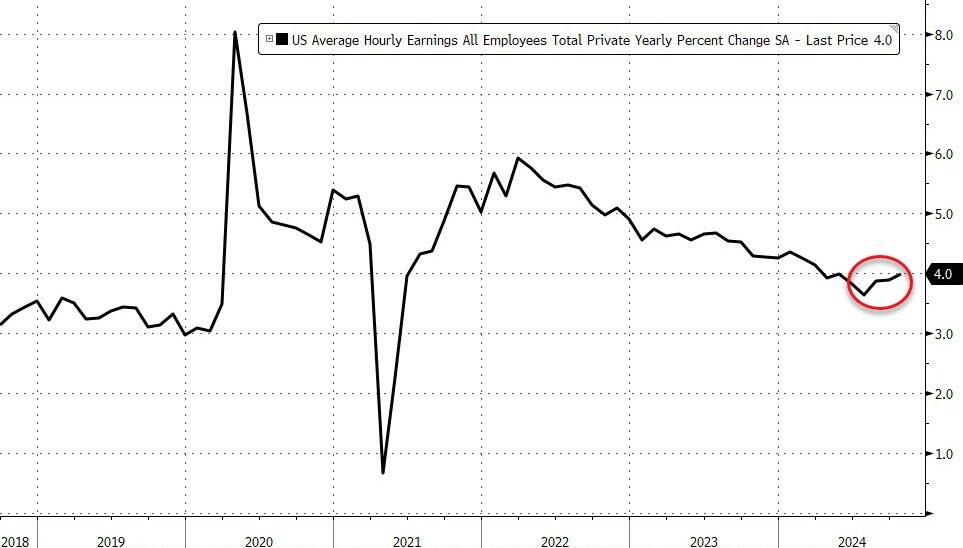
Wage growth came in slightly higher than expected, with average hourly earnings rising 0.4% in October, higher than the 0.3% expected, and up from the downward revised 0.3% in September (was 0.4%). On an annual basis, earnings rose 4.0%, in line with expectations, and above the downward revised 3.9% (was 4.0%).
Some more stats from the latest monthly report:
Among the unemployed, the number of permanent job losers edged up to 1.8 million in October. The number of people on temporary layoff changed little at 846,000.
The number of long-term unemployed (those jobless for 27 weeks or more) was little changed at 1.6 million in October. This measure is up from 1.3 million a year earlier. In October, the long-term unemployed accounted for 22.9 percent of all unemployed people.
Both the labor force participation rate, at 62.6 percent, and the employment-population ratio, at 60.0 percent, changed little in October.
The number of people employed part time for economic reasons was little changed at 4.6 million in October.
The number of people not in the labor force who currently want a job, at 5.7 million, was essentially unchanged in October. These individuals were not counted as unemployed because they were not actively looking for work during the 4 weeks preceding the survey or were unavailable to take a job.
Among those not in the labor force who wanted a job, the number of people marginally attached to the labor force, at 1.6 million, was little changed in October. These individuals wanted and were available for work and had looked for a job sometime in the prior 12 months but had not looked for work in the 4 weeks preceding the survey. The number of discouraged workers, a subset of the marginally attached who believed that no jobs were available for them, changed little at 379,000 in October.
Turning to the establishment survey, we find the following breakdown in jobs:
Health care added 52,000 jobs in October, in line with the average monthly gain of 58,000 over the prior 12 months. Over the month, employment rose in ambulatory health care services (+36,000) and nursing and residential care facilities (+9,000).
Employment in government continued its upward trend in October (+40,000), similar to the average monthly gain of 43,000 over the prior 12 months. Over the month, employment continued to trend up in state government (+18,000).
Within professional and business services, employment in temporary help services declined by 49,000 in October. Temporary help services employment has decreased by 577,000 since reaching a peak in March 2022.
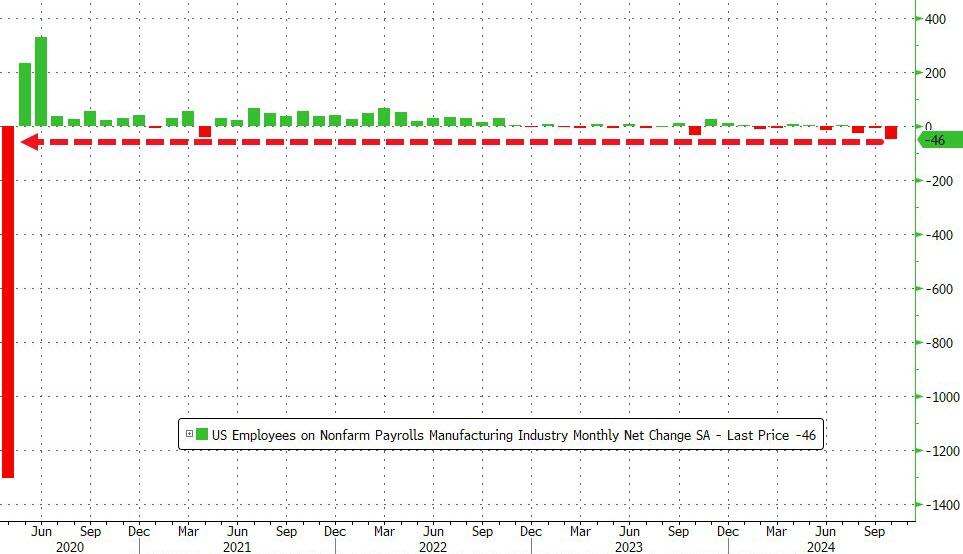
Manufacturing employment decreased by 46,000 in October, reflecting a decline of 44,000 in transportation equipment manufacturing that was largely due to strike activity.
Employment in construction changed little in October (+8,000). The industry had added an average of 20,000 jobs per month over the prior 12 months. Over the month, nonresidential specialty trade contractors added 14,000 jobs.
And visually:
Three things stick out here:
First, manufacturing is a disaster, with the US losing manufacturing jobs for 3 months in a row, and 4 of the last 5. Can’t blame that on hurricanes.
Second, the number of construction jobs is becoming absolutely ridiculous, especially when contrasted with the plunge in actual housing starts, completions and last but not least, actual job openings.
Finally, delta between government jobs and private jobs was a whopping 12K, the biggest since covid. This means that more government jobs were added in October than all private jobs lost in the month! Just in case you needed to know how the Biden admin avoided a negative total headline print.


You must be logged in to post a comment.