Kamala Harris and Tim Walz have produced a destructive proposal to solve the inflation problem: price controls. Her biggest supporters like Elizabeth Warren and Ohio’s Sherrod Brown love the idea of meddling in the private sector,
But I would be symapatheic to their arguement if consumer prices soared more than producer prices. However, the truth is that prices paid by producers (PPI) SOARED far more than prices paid by consumers (CPI).
The cause? Federal goverment spending (green line) exploded with Covid. Harris/Walz are proposing massive spending under her administration hence there will be MORE inflation under Harris/Walz. So, the have to rely on flawed gimmics like price controls. Which will lead to shortage, food lines, rastioning, etc.
Market participants are expecting a 50 BPS cut tomorrow. From 5.50% to 4.913%.
This painting represents Washington DC where the deep state lingers in darkness.
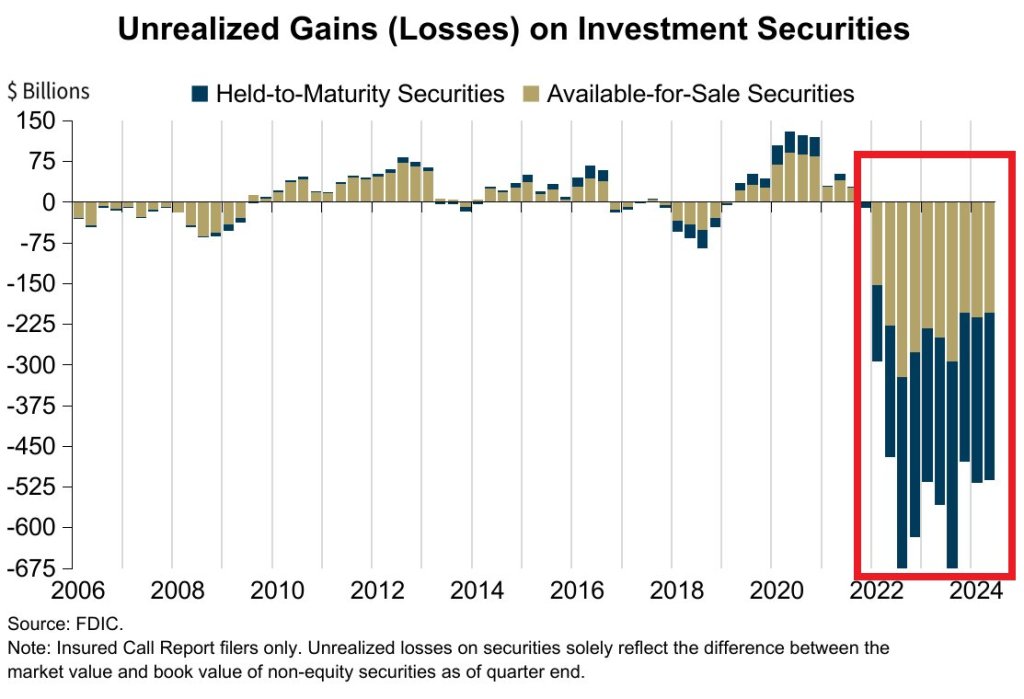
Q2 marks the 11th STRAIGHT quarter of unrealized losses on investment securities for banks, a streak never seen before. The number of banks on the FDIC Problem Bank List increased to 66 and represents 1.5% of total.
This is in addition to price Increases over last 4 years… CPI Medical Care: +7.8% CPI Apparel: +12.7% CPI Used Cars: +18.3% CPI New Cars: +20.5% CPI Food at home: +21.4% CPI Shelter: +23.4% CPI Food away from home: +25.4% CPI Electricity: +29.8% CPI Gas Utilities: +34.9% CPI Transportation: +38.8% US Home Prices: +48.0% CPI Auto Insurance: +52.4% CPI Gasoline: +53.5% CPI Fuel Oil: +54.9%
Don’t spill the wine, its too expensive under Biden/Harris/Powell.
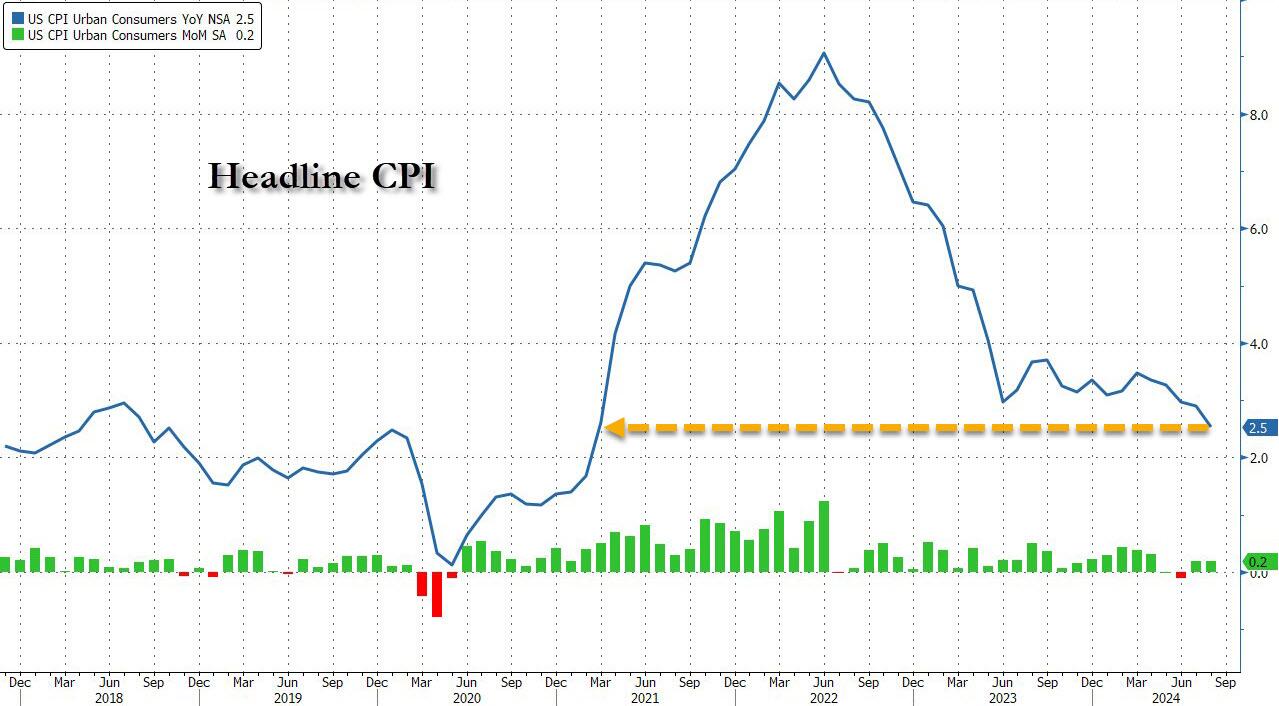
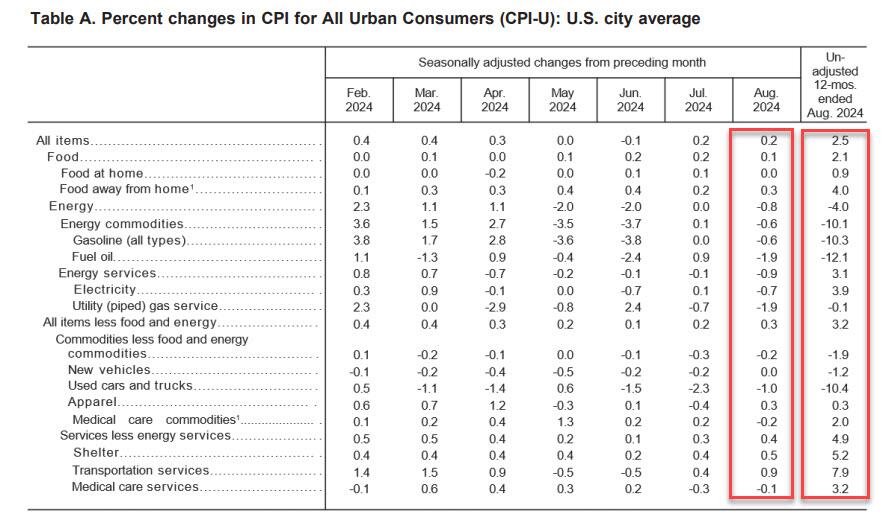
Following last month’s modest miss in CPI which sparked speculation about a 50bps cut, which was then boosted by the jobs report miss and the huge downward revision, moments ago the BLS reported that – as only a handful of Wall Street strategists warned – CPI actually came in hotter than expected at the core level, rising 0.3% MoM vs expectations of a 0.2% print, with all remaining metrics coming in line, to wit:
CPI 0.2% MoM (or 0.187% unrounded), Exp. 0.2% – in line
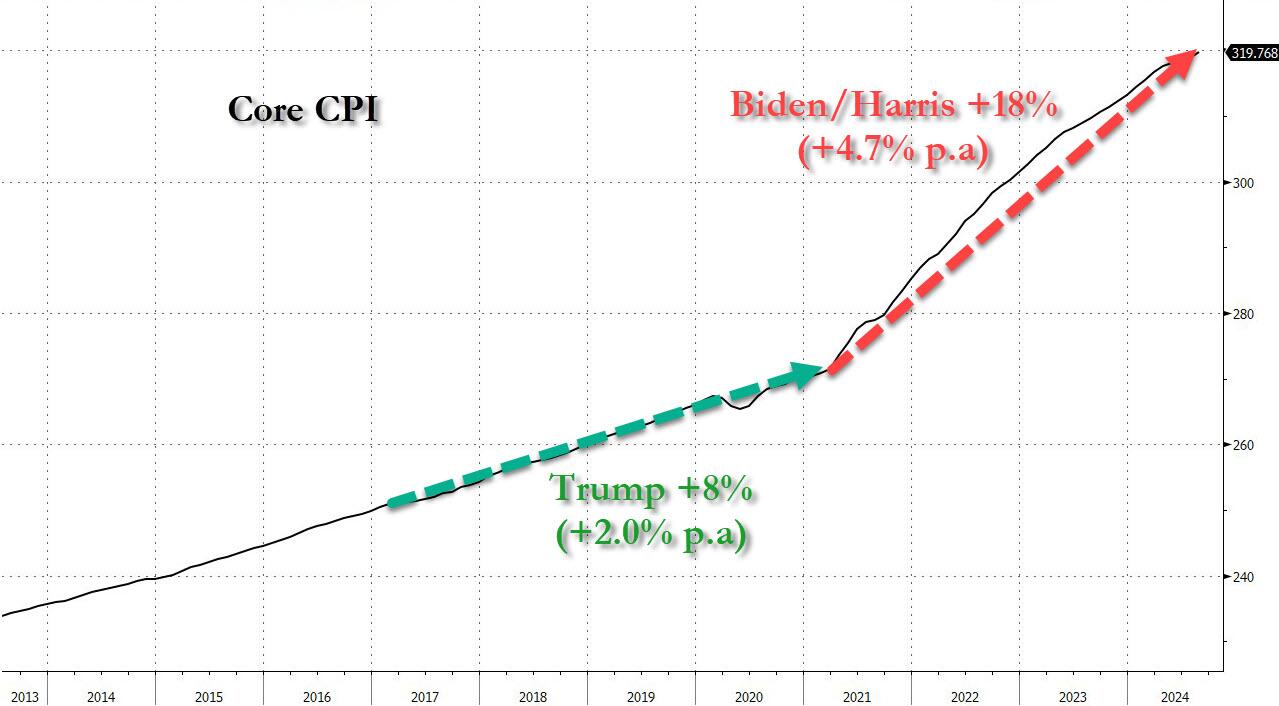
And visually, here is the headline print, where the annual CPI increase dropped to just 2.5% from 2.9%, the lowest since February 2021…
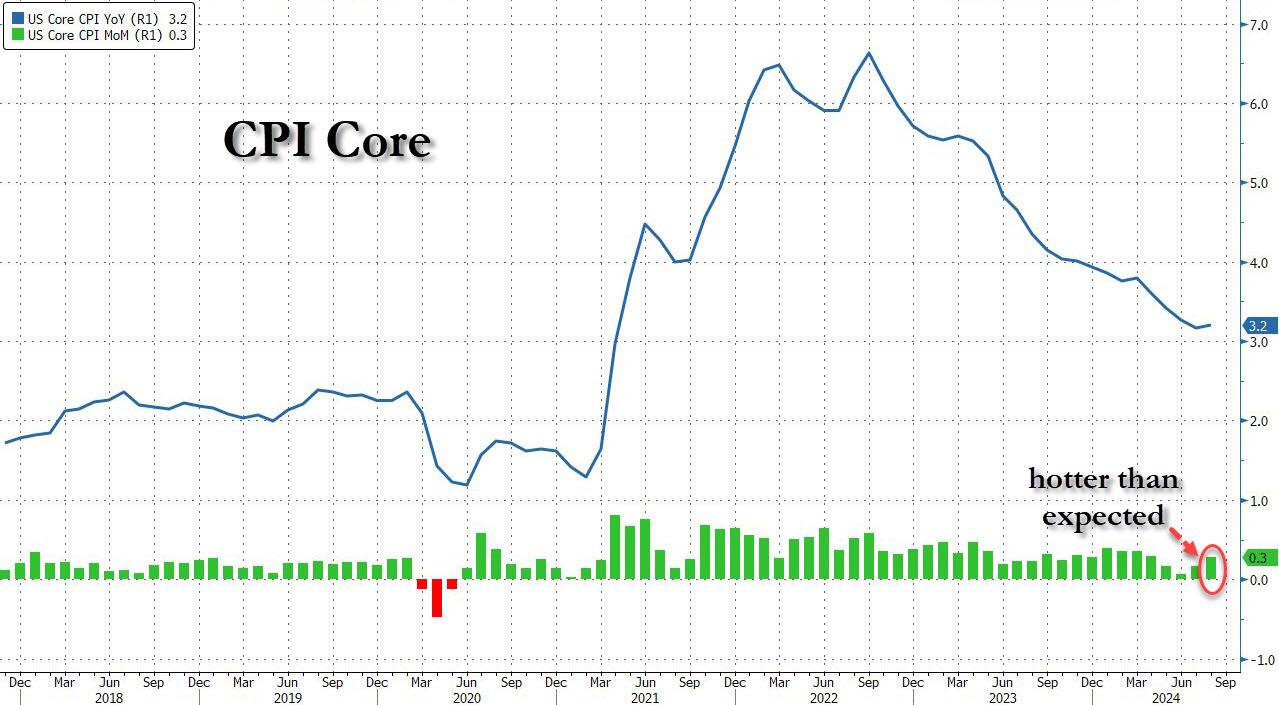
.. and the core….
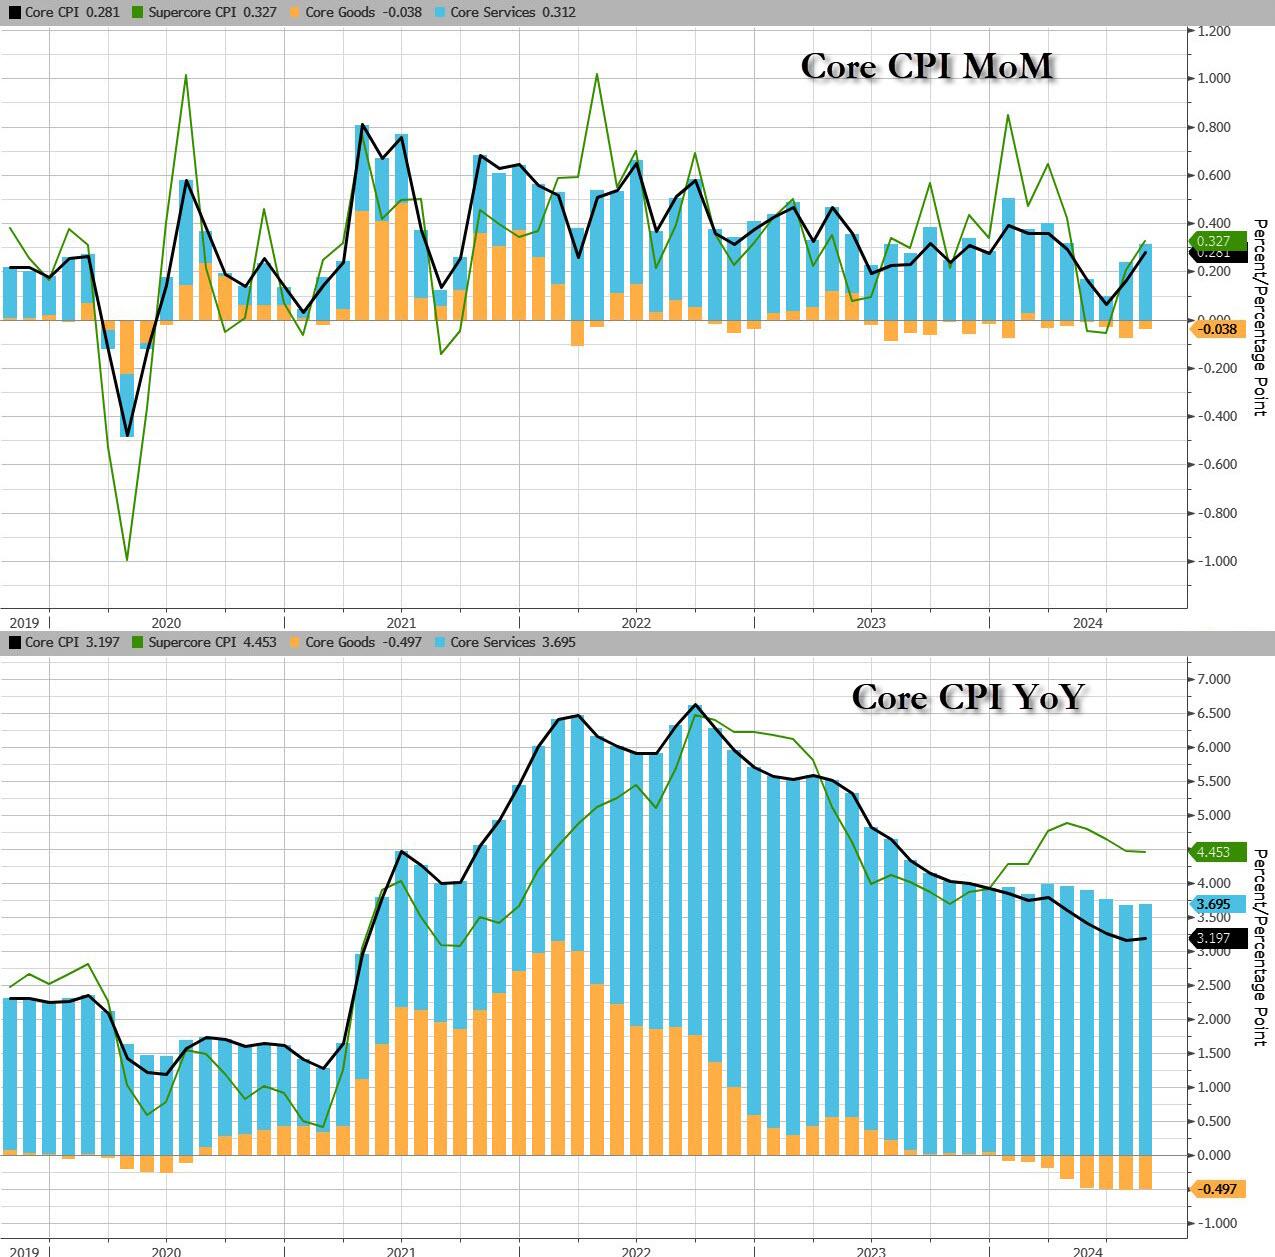
…. as goods deflation is stalling and may even print positive in the coming months, while core service inflation remains the biggest driver.
That was s the 51st straight month of MoM increases in Core CPI, and a new record high.
Under the hood, used car prices fell 1.0%, moderating from last month’s 2.3% drop, while airline fares jumped 3.9%, a big reversal to last month’s bizarre -1.2% drop. Car insurance costs jumped another 0.6%, after rising 1.2%; furniture prices dropped 0.3% reversing last month’s 0.3% rise.
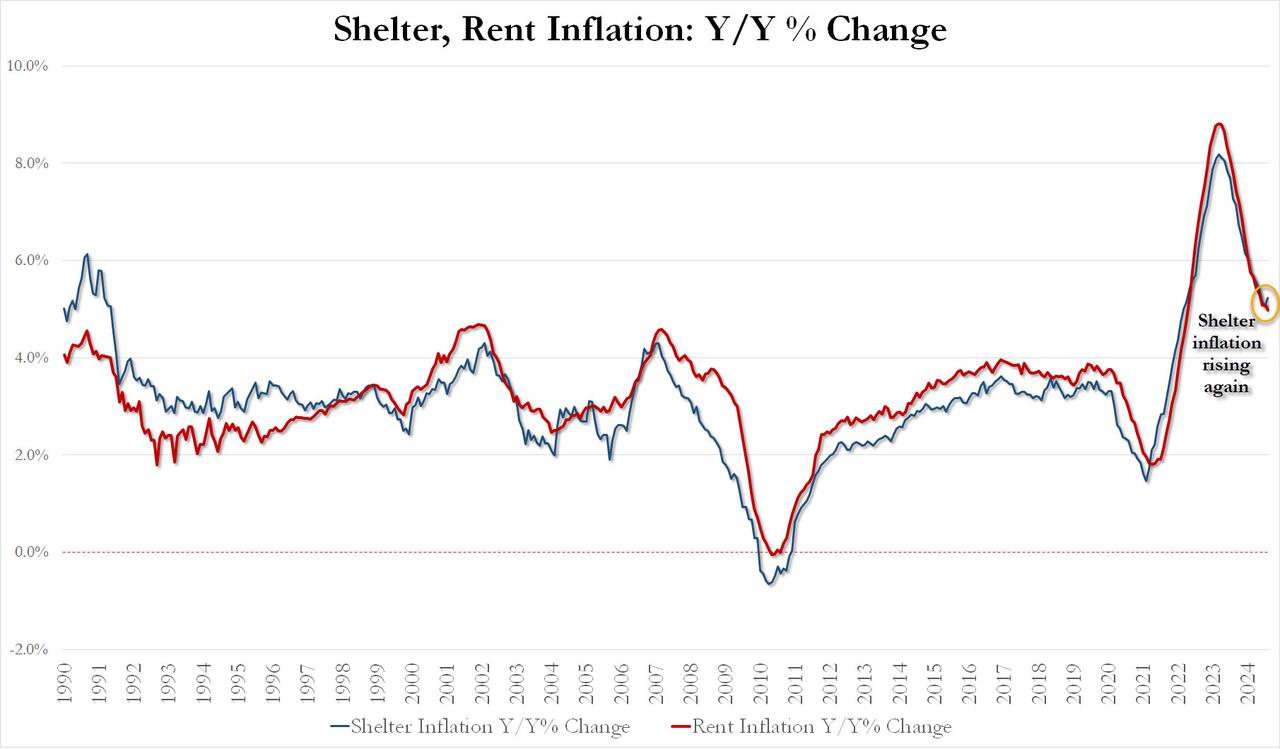
Perhaps more worrying is the fact that while rent inflation has flatlined, shelter inflation posted its first increase since early 2023!
August Shelter inflation up 0.43% MoM and up 5.23% YoY vs 5.05% in July
August Rent Inflation up 0.39% MoM and up 4.97% YoY vs 5.09% in July
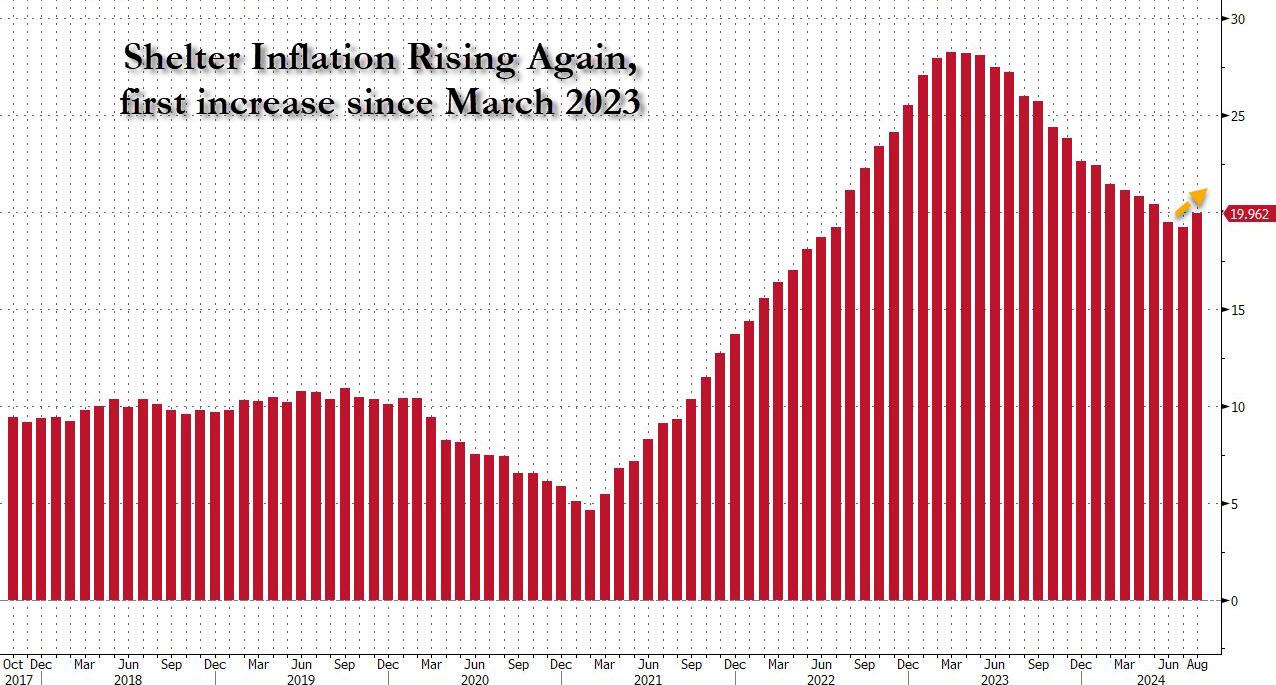
And the first monthly increase since March 2023 highlighted:
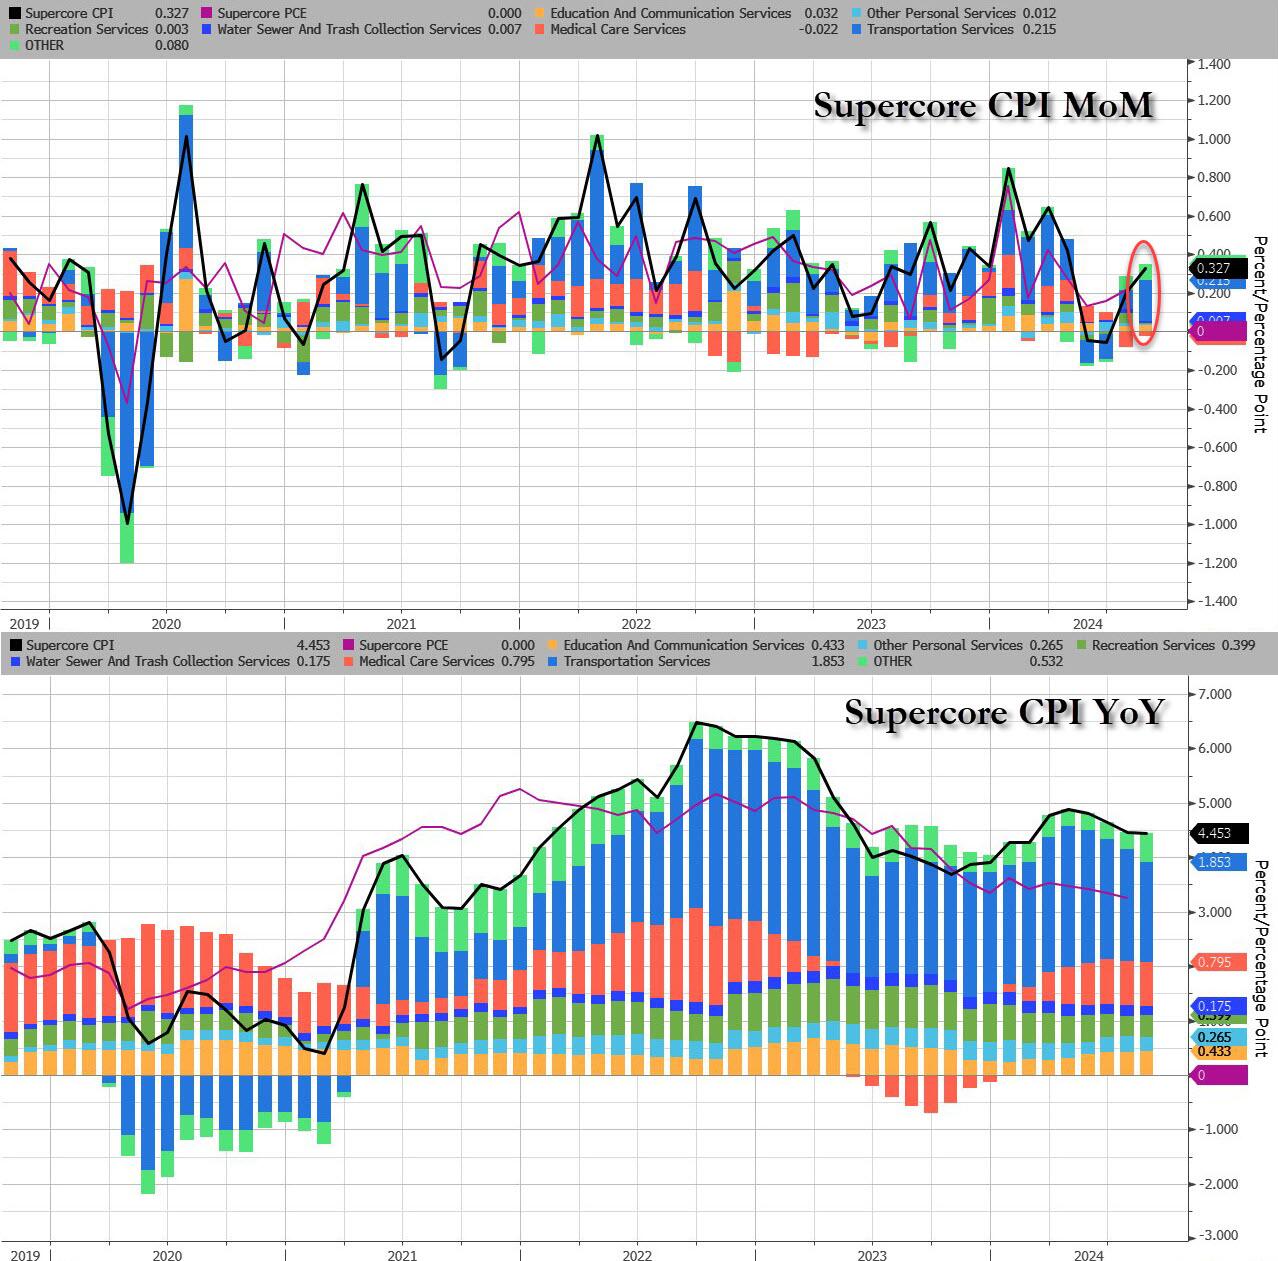
Last, but not least, and perhaps most ominous of all, is that while inflation refuses to be “killed” even as the Fed is about to start cutting rates, Supercore CPI rose 0.33% MoM, the biggest monthly increase since April, driven by continued acceleration in transportation services, which jumped the most in 5 months.
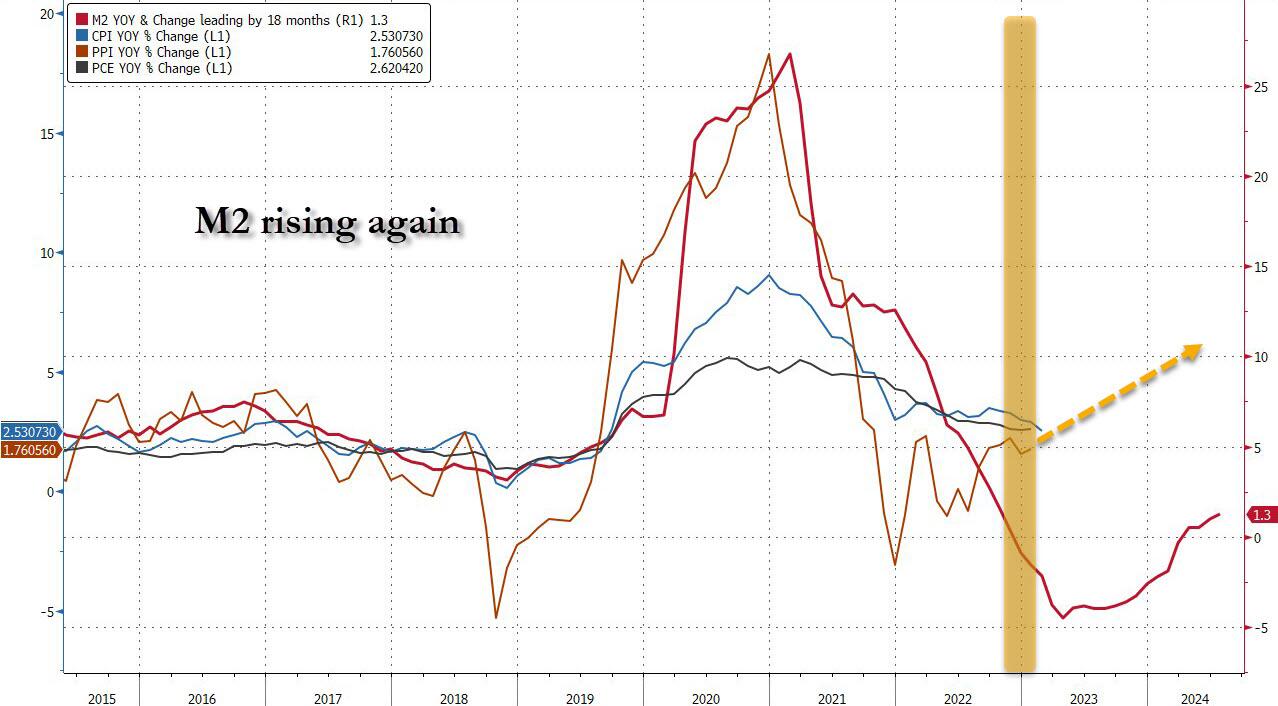
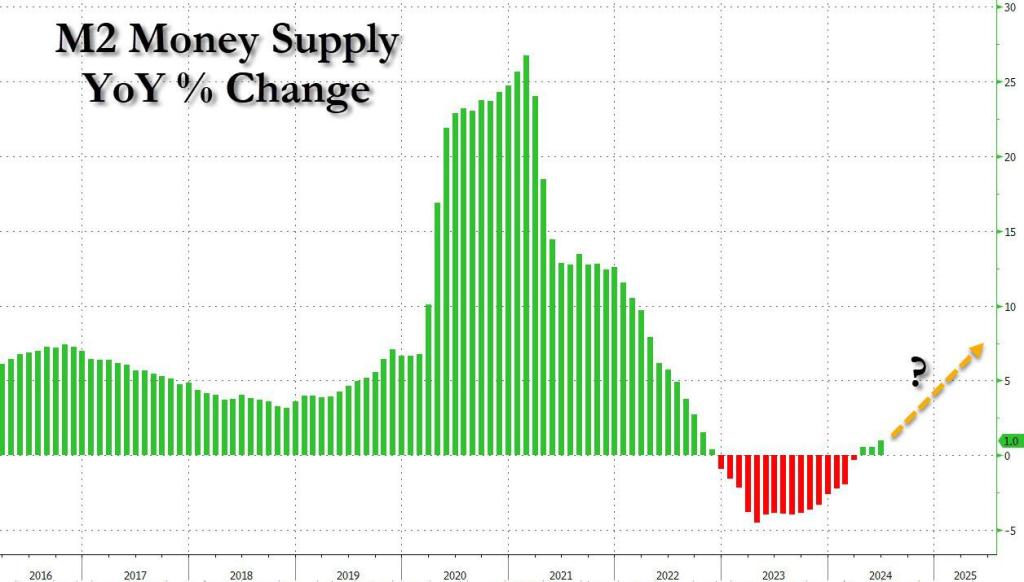
Finally, money supply growth is reaccelerating…
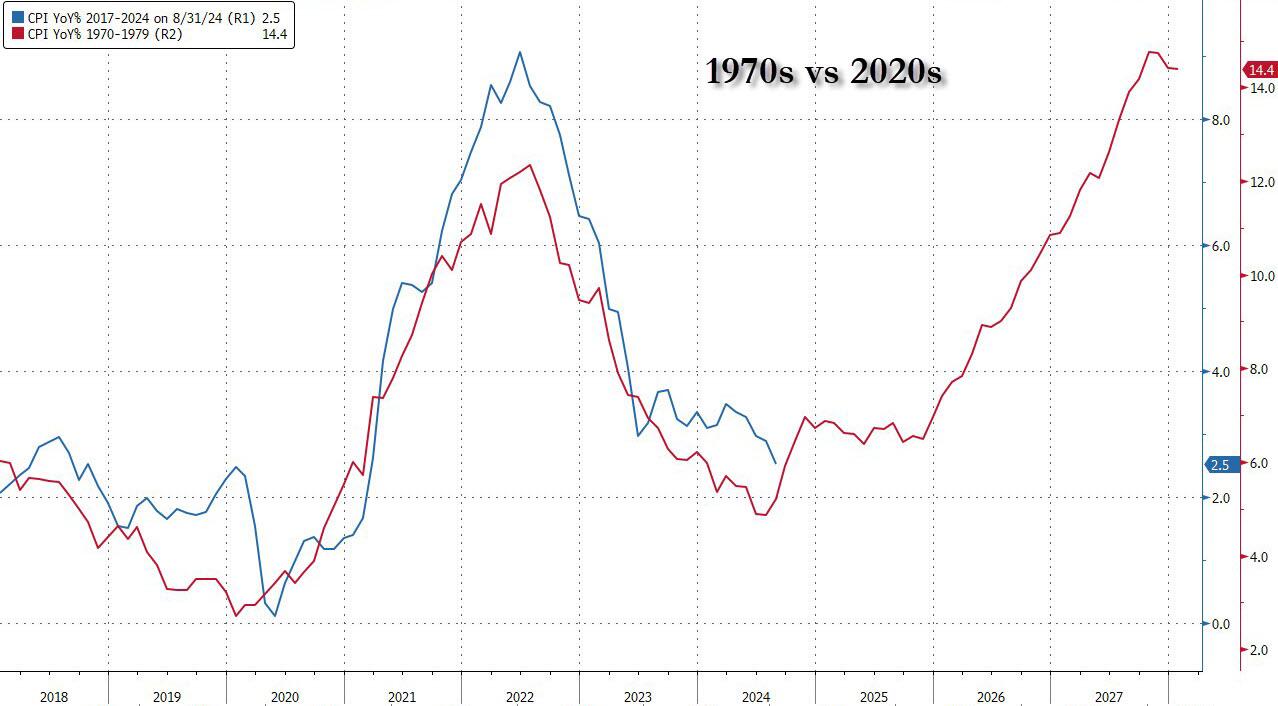
Which begs the question: how long until the Fed’s next easing cycle unleashes the Arthur Burns fed:
Putting it all together:
Underlying inflation unexpectedly picked up, as core CPI increased 0.3% from July, the most in four months, and 3.2% from a year ago
Only five of the 65 forecasts in Bloomberg’s survey called for a 0.3% increase in the core CPI. Almost everyone else was at 0.2%, and four had it at 0.1%. The five were right.
Shelter prices, the largest category within services, climbed 0.5%, the most since the start of the year and the second month of acceleration, defying widespread expectations for a downshift. Owners’ equivalent rent — a subset of shelter and the biggest individual component of the CPI — rose at a similar pace.
Airfares rose a hefty 3.9% in August after falling for the previous five months while costs for energy and used vehicles fell
Risk assets pumped and dumped and bond yields rose. S&P 500 futures dropped steeply immediately after the report came out, before paring losses. The yield on 10-year Treasuries advanced two basis points to 3.66%. The dollar wavered.
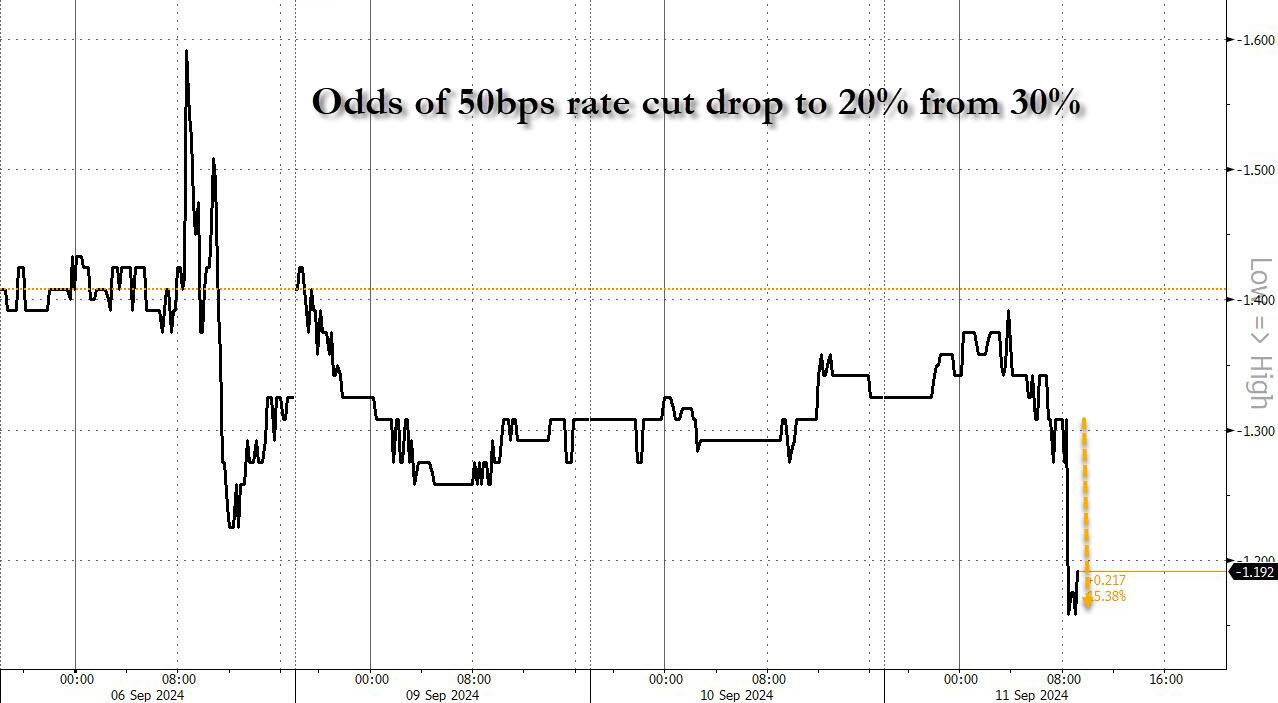
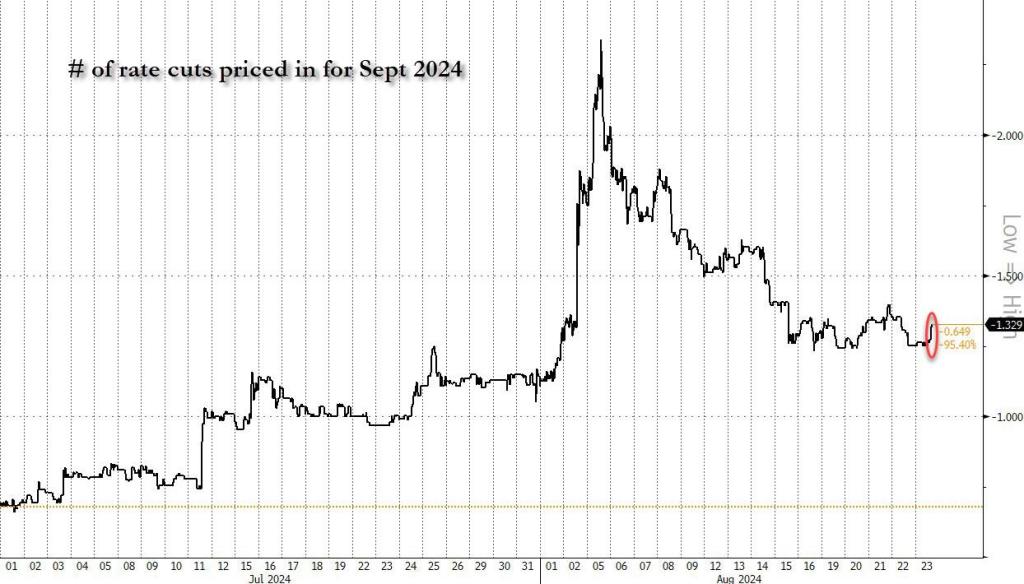
And while one can stick a fork in the market’s hopes for a 50bps rate cut (odds slumped from 30% to 20%… and from 50% last Friday)…
… the question remains: will the Fed really cut rates as shelter inflation inflects higher for the first time since 2023.
After last night’s ABC Presidential debate. Where Kamala acted like she was auditioning for part in the movie “Mean Girls” and the ABS moderators acted like pure Soviet-era Russian journalists.
The US government now pays out on average $3bn in interest expenses per day…If the Fed cuts interest rates by 1%-point and the entire yield curve declines by 1%-point, then daily interest expenses will decline from $3bn per day to $2.5bn per day.
Even worse, unfunded Federal liabilities total $219 trillion while total US assets total only $213 trillion. In other words, if China (for example) forced us to pay off our unfunded liabilities like Social Security, Medicare, etc., we couldn’t.
Notice how NO politician ever discusses The Federal goverment spending LESS money. Particularly not Joe “The fool on the hill” Biden or Kamala “Word salad Kammie” Harris.
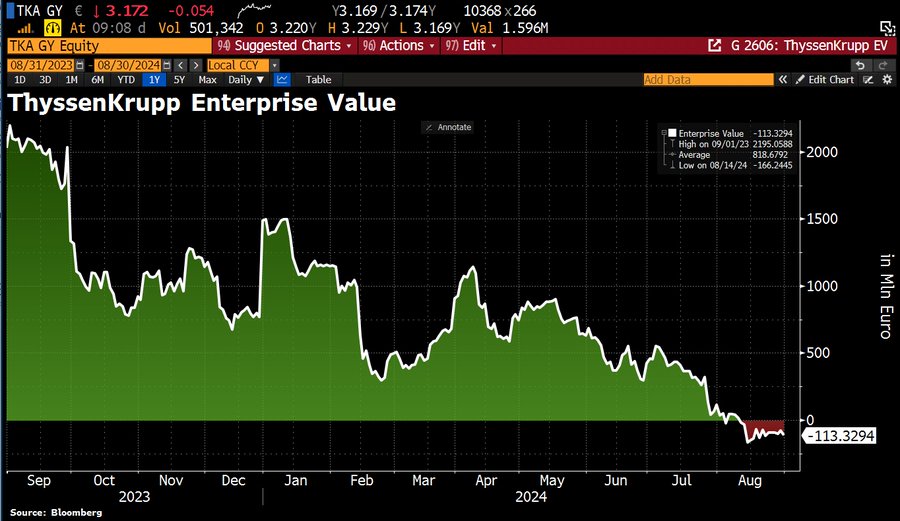
I read “The Arms of Krupp” by William Manchester. A great book about the rise of ThyssenKrupp during World War II. It is one of the world’s largest steel producers, but it now has NEGATIVE ENTERPRISE VALUE.
The cause? Germany is up the creek without an economic paddle after years of gross mismanagement by Angela Merkel and her party. Mass immigration in Germany and a slowdown in the global economy aren’t helping.
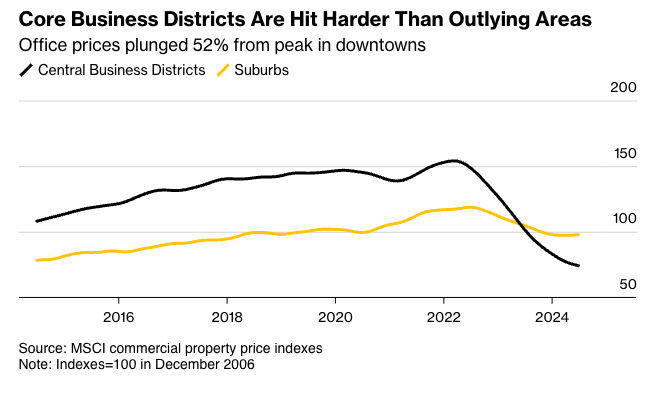
Commercial real estate market challenges are more severe for older office towers in downtown metro areas than those outside city centers. The mismatch between funding needs and available credit in a high-interest-rate environment has also intensified the strain on building owners, as elevated tower vacancy rates persist across many markets due to the ongoing trend of remote work becoming the norm.
Aging business districts from Los Angeles to Chicago to Boston of zombie towers with high vacancy rates that have no use in today’s economy.
Big landlords, including Brookfield, Blackstone, and Starwood Capital Group, have walked away from older downtown towers in recent quarters.
The latest data from MSCI shows office values in metro areas have crashed 52% from their highs. Some of the worst declines have occurred in San Francisco, Manhattan, Washington, and Boston.
Source: Bloomberg
Between 2019 and 2023, about $557 billion of value evaporated from US offices due to a multi-year slide in demand, with older towers quickly falling out of favor with companies, according to an estimate by economists at Columbia and New York universities. CBRE Group noted that only 2% of towers in the US are considered top-tier, with rents 84% higher than the rest of the market.
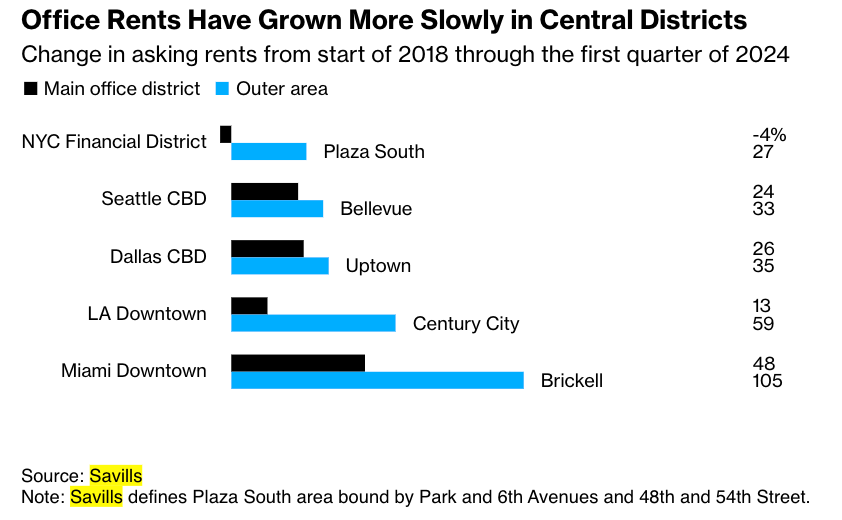
Data from brokerage Savills shows office rents in business districts have grown slower than rents for similar buildings outside metro areas.
Source: Bloomberg
The move to new towers highlights how, for decades, the bubbles in legacy downtown districts, fueling economies, have ended for now, and older towers will have to be torn down.
To be very frank. It’s a crisis. Democrats running the crime-ridden metro area are delusional and blinded by their woke religion as the city’s population recently crashed to a 100-year low, and violent crime remains a major issue.
We’ve had conversations with multiple folks at wealth management and investment banking firm Stifel Financial about the latest shift of operations outside the dying business district to a new tower in a much safer and newer district. At first, Stifel contemplated leaving the city for the suburbs because far-left Democrats in City Hall could not enforce law and order.
CRE foreclosures are on the rise.
Don’t forget about Soros-funded district attorneys not enforcing the law in large cities. Expect more of the same if Harris/Walz win the election.
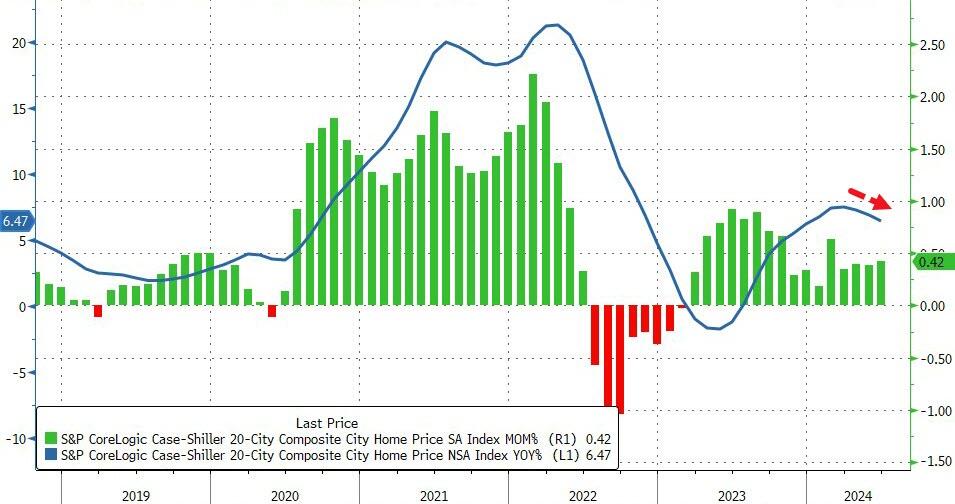
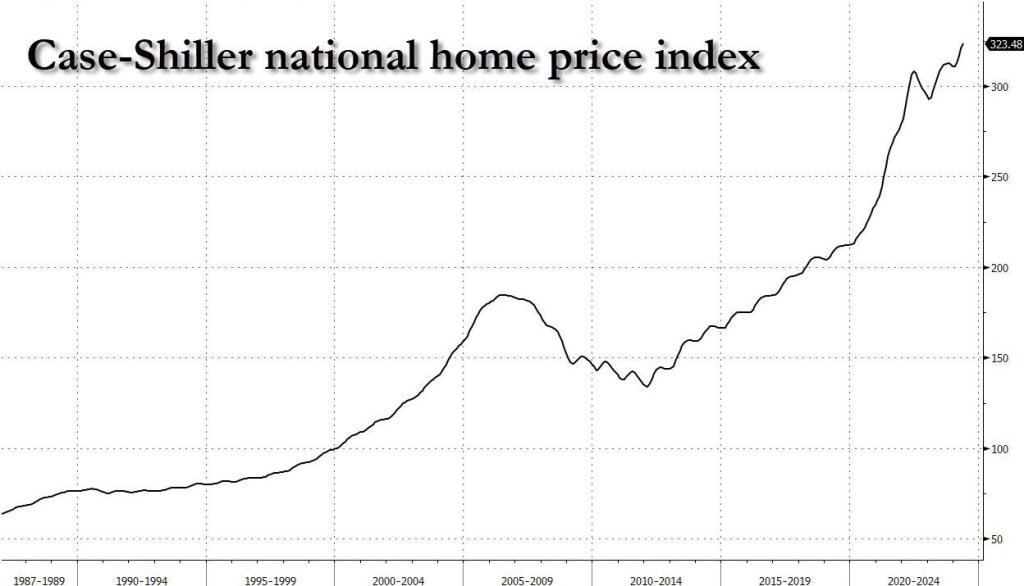
Big bubbles! US home pricest hit an all-time high as The Fed keeps its foot on the monetary gas pedal following the Covid economic shutdown in 2020.
Home prices in America’s 20 largest cities rose for the 16th straight month in June (according to the latest data from S&P CoreLogic – Case Shiller – data today), up 0.42% MoM (hotter than expected and accelerating from May). On a YoY basis, prices rose 6.47%, but notably that is the third straight monthly slowdown in the pace of price appreciation…
Source: Bloomberg
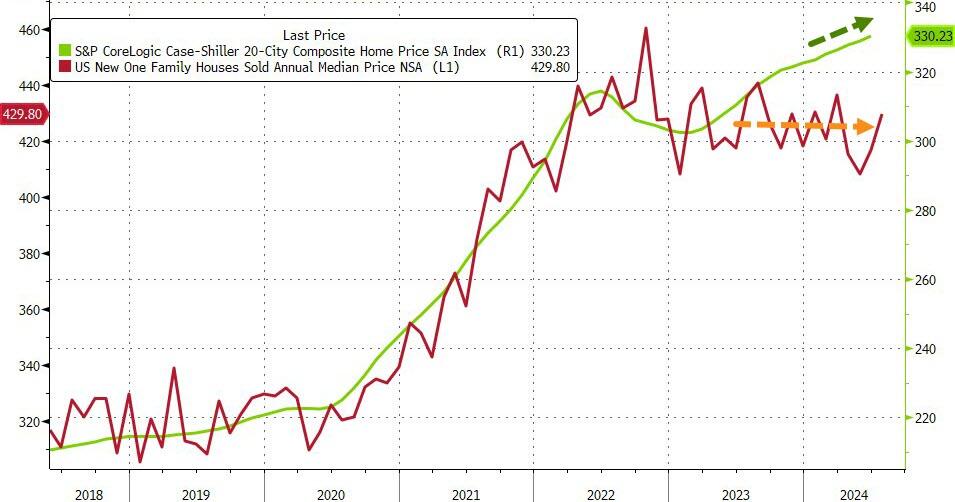
Overall, US home prices reached a new record high in June (as median new home prices continued to tread water)…
Source: Bloomberg
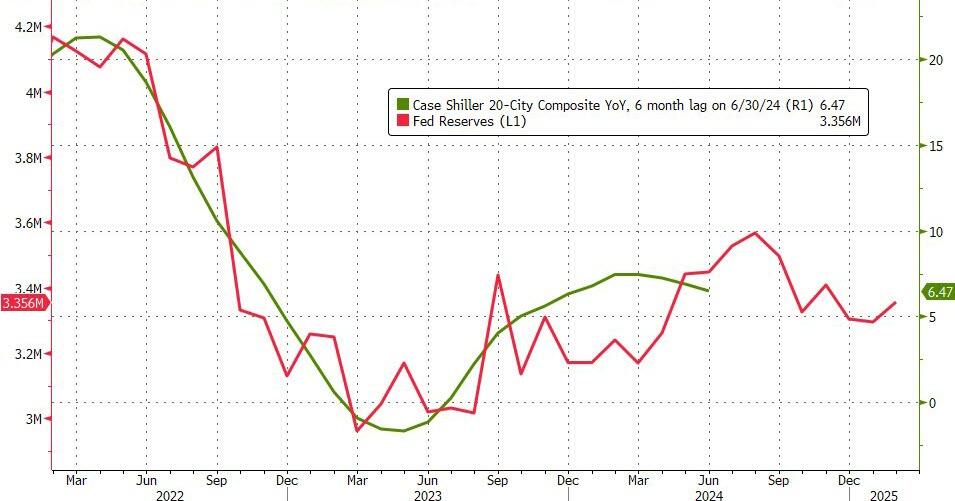
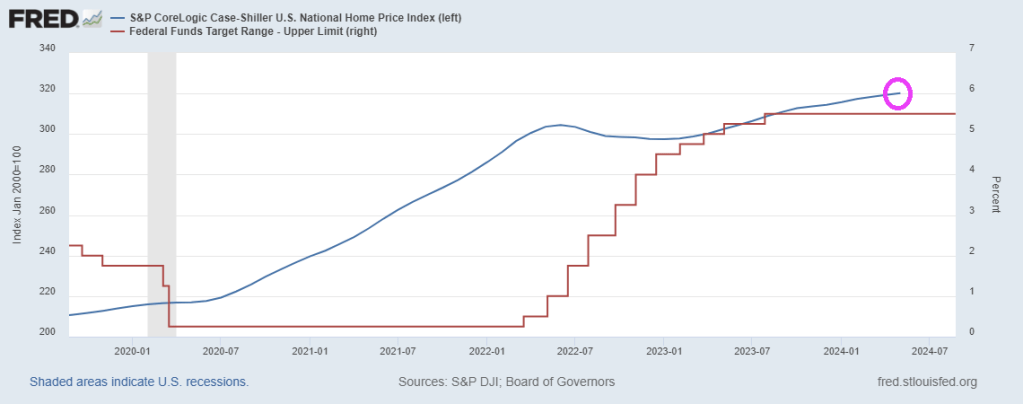
Home prices continue to track Fed Reserves closely, but a turning point may come soon…
Source: Bloomberg
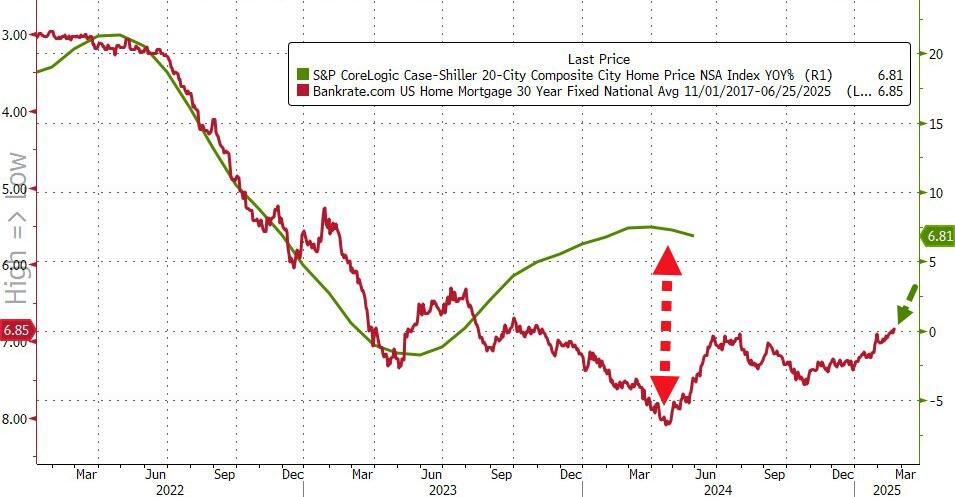
Given the smoothing and heavy lag in the Case-Shiller data, it’s hard to find a causal relationship between prices and mortgage rates…
Source: Bloomberg
But, with prices reaccelerating and mortgage rates already back below 7.00% – in anticipation of The Fed – WTF does Powell think is going to happen when he actually starts cutting with prices at these record highs.
The Freddie Mac HP index shows the variation in home price growth. New Jersey coastal towns of Atlantic City and Ocean City grew at 10% YoY while Lake Charles LA declined by -2% YoY.
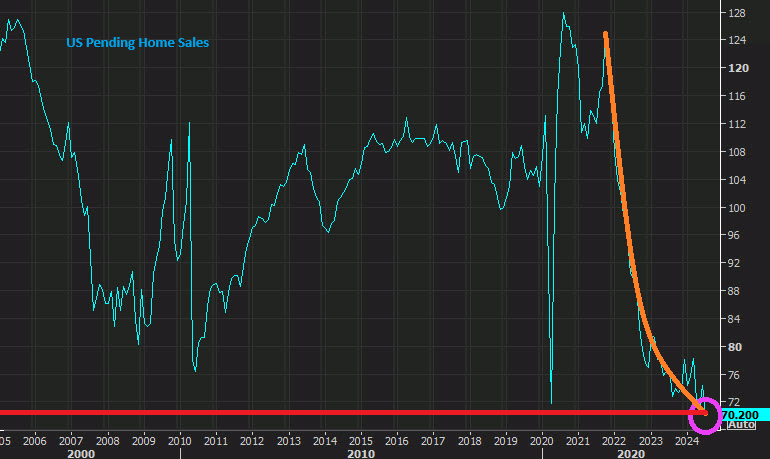
Combined Biden/Harris’ spending spree with The Fed’s monetary goonery and we got inflation (gasoline, food, shelter). With spiraling inflation in mortgage rates and shelter prices we saw a correponding decline in existing home sales under Biden/Harris.
Harris claims to lower prices on her first day in office (she has been in office as VP since 2021 and actually voted in the US Senate as tie breaker to enact policies that INCREASED Inflation). But her suggestion of $25,000 for ALL first time homebuyers is of course INFLATIONARY. And her anti-price gouging policies willl of course reduce supply of groceries avaiable, driving up INFLATION.
Having put inflation fully in the rearview mirror, the “Powell payrolls pivot” is now complete because as the Fed chair said, “the cooling in labor market conditions is unmistakable” even if it was quite mistakable to the Biden admin’s presstitutes as recently as one month ago.
Which is also why it was imperative for the Biden labor department to admit the truth about the deteriorating labor market: without that -818K revision earlier this week, the Fed would have some pushback to turning fully dovish. But now that we know that a third of the job gains in the last year of Bidenomics were bogus…well, please come save us Chairman Fed.
Or, as TradeStation head of strategy David Russell said, “here comes the punchbowl. Jerome Powell came out swinging today with a litany of dovish signals. He said inflation is on a sustainable path lower and talked about how the job market has cooled to pre-pandemic levels. He drove the point home with a clear call for adjusting policy.”
The market agreed, and quickly cemented at least one rate cut while also pricing in as much as 33% odds of a 50bps rate cut.
Which is all great: after all as we have long said, with the November elections looming, the Fed will do everything to make sure the establishment candidate isn’t distracted by such trivial things as a market crash.
There are just four small problems with this.
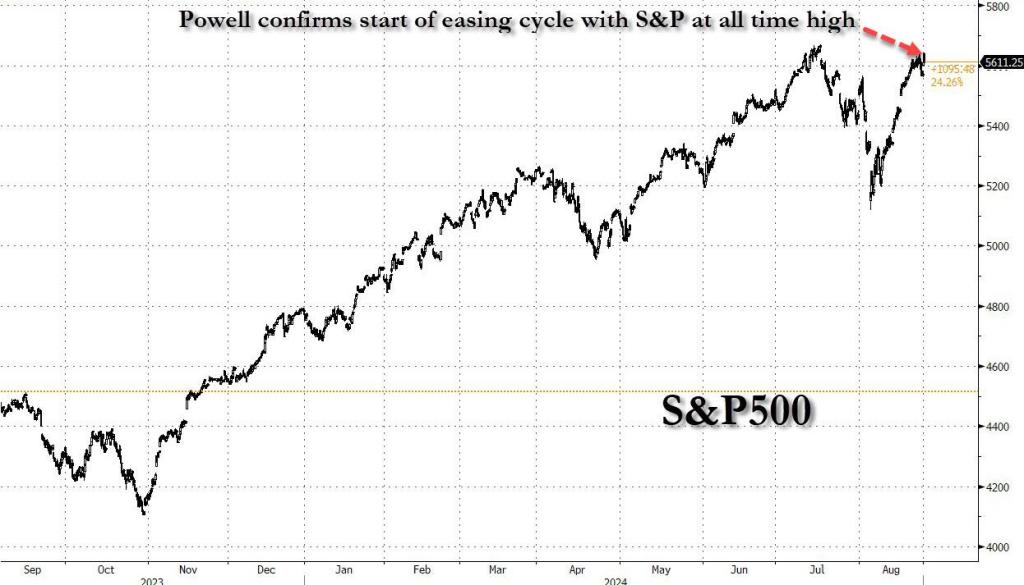
First: the Fed will end its tightening cycle and starts the next easing cycle with stocks at all time highs, something that has never before happened in the history of capital markets!
It means that, unless the current expansion ends in a gruesome recession which crushes the economy, the S&P is about to enter a full-blown bubble, which in turn will burst in even more spectacular fashion and force the Fed to not only cut back to ZIRP, but activate NIRP (just like Japan did years ago) and also go right back to QE and buying bonds ETFs. For now, however, as in the next three months ahead of the elections, all shall be well and should serve the all time high in the market to Kamala Harris on a silver platter…. which is precisely why the Fed is doing what it is doing.
Second, this is also the first time in history when the Fed has aborted a tightening cycle having achieved zero home price easing. Indeed, one look at the case-shiller index shows that home prices are the highest they have ever been…
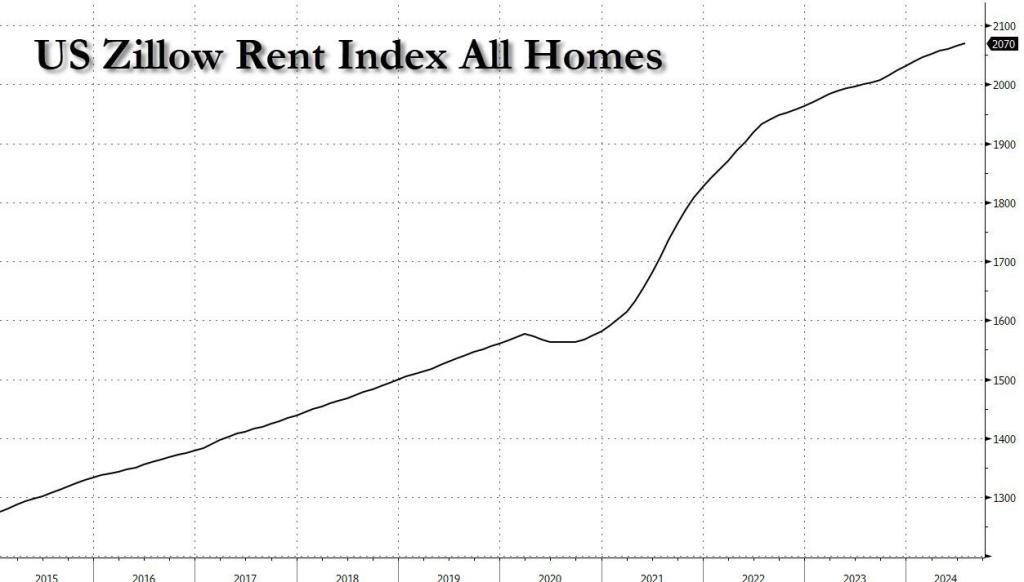
… as are actual asking rents according to Zillow (not that delayed aberration known as Owner-Equivalent Rent).
And then you have Kamala’s promise to provides $25,000 in new home purchase subsidies, which will go straight to the asking price, sending prices even higher.
In short, both home prices and rents, already at record high, are about to go record-er…
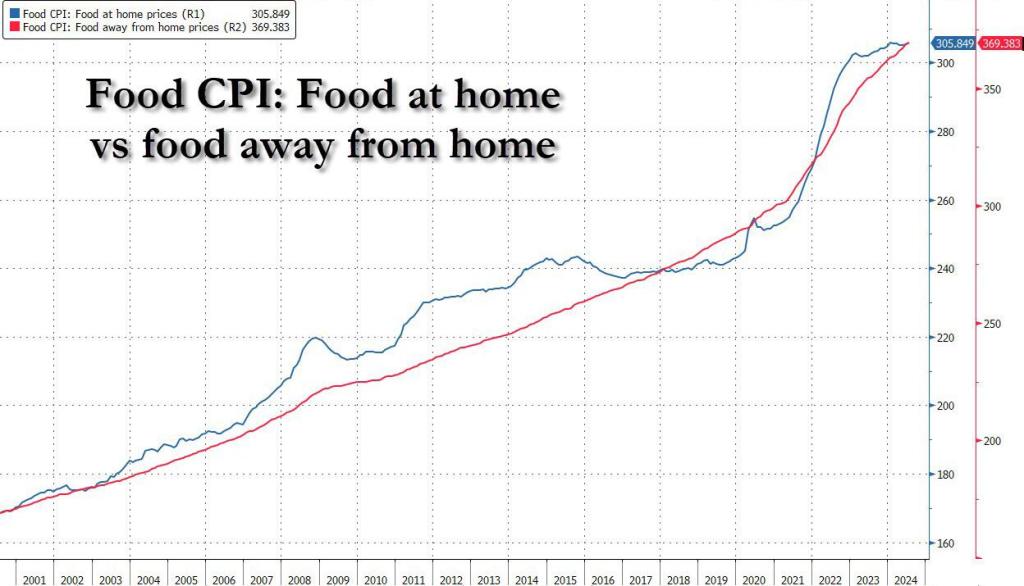
Third, while one can technically live without housing or rent, one still needs to eat. And here we find another problem, because not only did the Fed’s rate hikes not contain stock, home or rent prices, but food prices – both at home and away from home – are also at all time high! And guess what cutting rates and stimulating the economy will do to food prices from this point on…
Fourth, and final, the seeds of the next inflationary bubble are already set, because even as the Fed kept conditions tight (or even exceptionally tight), M2 – the broadest money aggregate tracked by the Fed – is once again rising after declining for the past three years.
Of course, there are countless other examples, because besides the above case studies, prices are at all time highs pretty much everywhere else too. But you get the message. The only question is what can possibly go wrong with the Fed launching an easing (i.e., monetary stimulus) cycle with prices for pretty much everything, stocks and homes included, at all time highs and rising.


You must be logged in to post a comment.