
Mortgage applications increased 6.9 percent from one week earlier, according to data from the Mortgage Bankers Association’s (MBA) Weekly Mortgage Applications Survey for the week ending March 3, 2023.
The Market Composite Index, a measure of mortgage loan application volume, increased 6.9 percent on a seasonally adjusted basis from one week earlier. On an unadjusted basis, the Index increased 9 percent compared with the previous week. The Refinance Index increased 9 percent from the previous week and was 76 percent lower than the same week one year ago. The seasonally adjusted Purchase Index increased 7 percent from one week earlier. The unadjusted Purchase Index increased 9 percent compared with the previous week and was 42 percent lower than the same week one year ago.
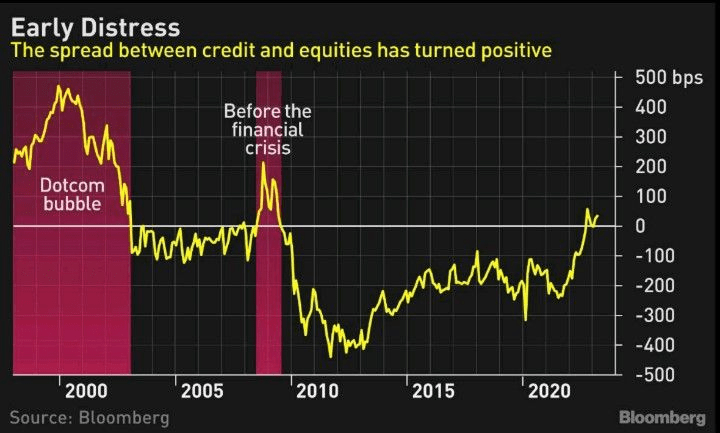
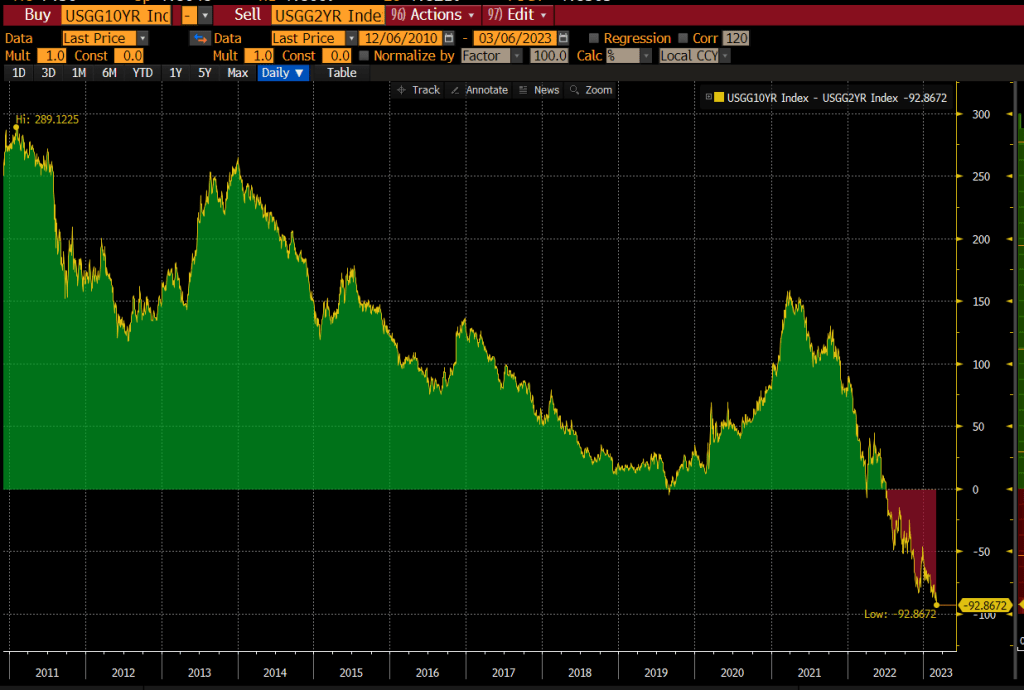
Today, we saw mortgage rates climb further to 7.11% as the US Treasury yield curve (10Y-2Y) descends into Mortgage Mordor as The Fed continues to tighten.


You must be logged in to post a comment.