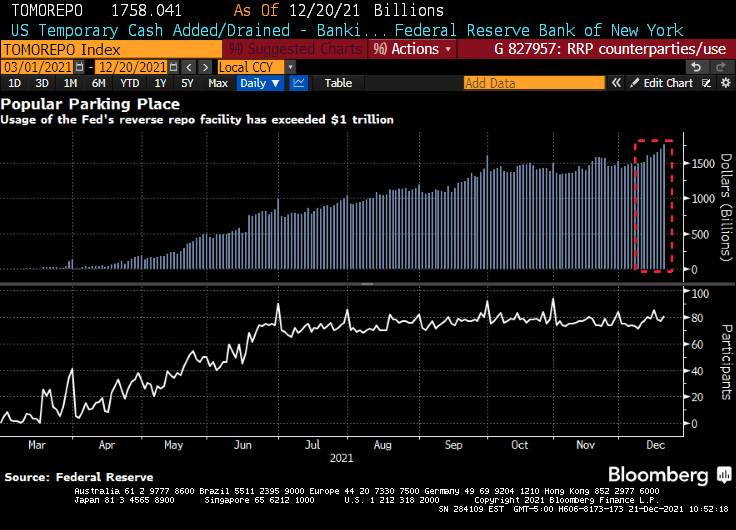
(Bloomberg) — The amount of money that investors are parking at a major central bank facility climbed to yet another all-time high as supply-demand imbalances continue to dog U.S. dollar funding markets.
Eighty-one participants on Monday placed a total of $1.758 trillion at the Federal Reserve’s overnight reverse repurchase agreement facility, in which counterparties like money-market funds can place cash with the central bank. That surpassed the previous record volume of $1.705 trillion from Dec. 17, New York Fed data show.
Demand for the so-called RRP has climbed further as principal and interest payments from government-sponsored enterprises has entered short-end funding markets. However, that cash is expected to exit the overnight space by the end of the week as the Treasury ramps up its issuance of Treasury bills now that Congress has increased the debt limit.
Overall volume has been rising this year as a flood of cash continues to overwhelm the U.S. dollar funding markets due to central-bank asset purchases and the drawdown of the Treasury’s cash account, which is pushing reserves into the system. The larger takeup looks set to persist even as the Fed tapers its asset-purchase program — something it began this month — because the supply-demand imbalances in short-end securities are likely to persist.
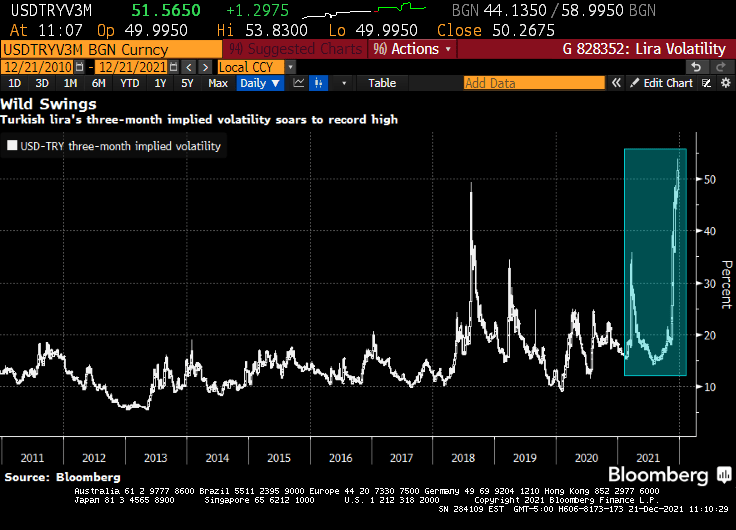
Then we have the Turkish Lira volatility hitting an all-time high.
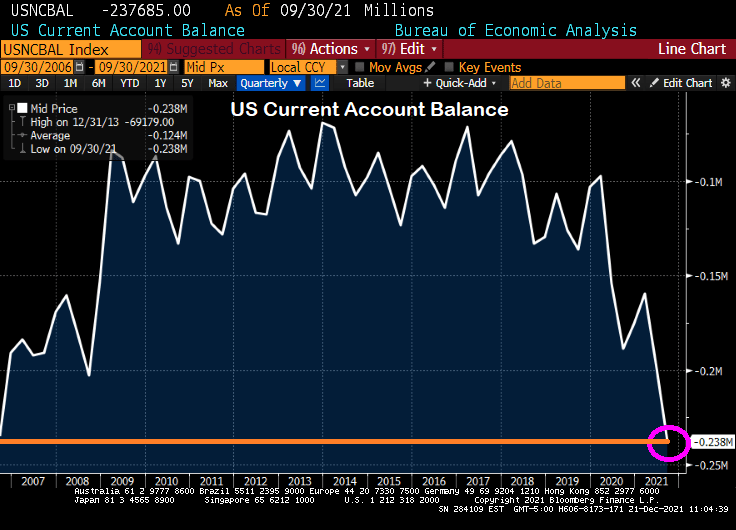
And finally we have the US Current Account Balance rising to levels last seen in 2006 just after the peak of the US housing bubble.
I love how The Federal Reserve talking heads, the media, economists like Paul Krugman, all refer to inflation as “transitory” and excessive liquidity as “temporary.”
Let’s look at a variety of alternative investments to the S&P 500, GameStop, Bitcoin, Ethereum and Gold after The Federal Reserve’s and Federal government massive (over)reaction to COVID in early 2020. Gold is the first asset to surge after M2 Money surged, but has declined since. Game Stop had a big surge (likely due to positive vibes on Reddit), but has been volatile and generally falling since “The Surge.” Bitcoin had a delayed surge as did Ethereum. Despite fear about government regulation, Ethereum in particular remains elevated.
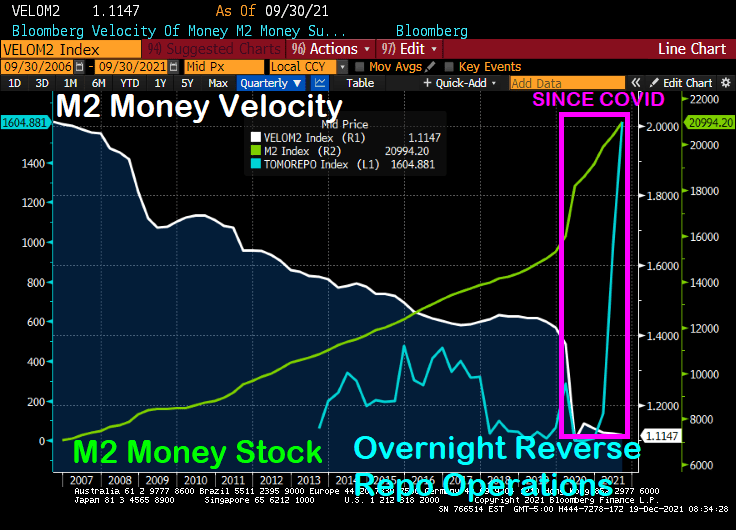
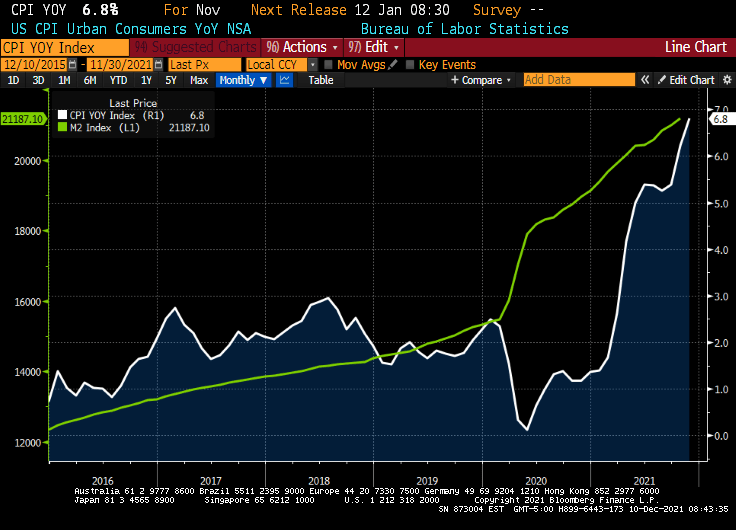
The “temporary” stimulus has resulted in the lowest M2 Money velocity in history. And we will have to see if the “temporary” excess liquidity in the financial system is truly temporary.
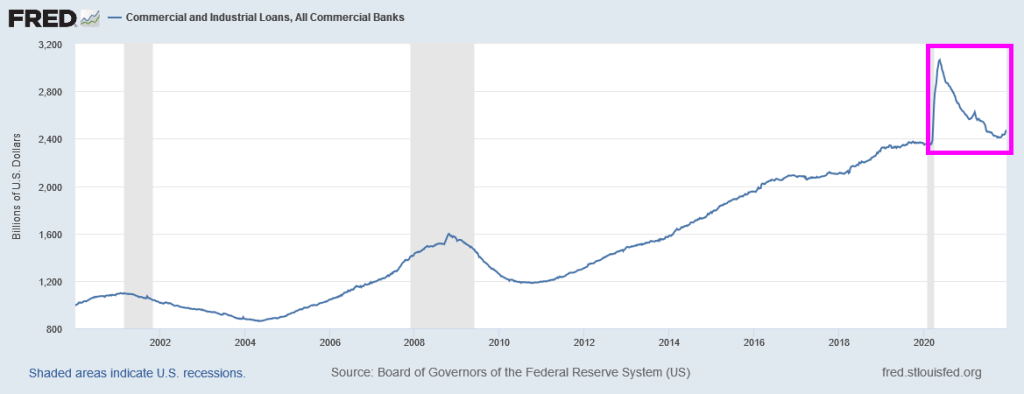
Here is a chart to show the “Stimulytpo” effect on commercial and industrial loans which surged (including PPP loans) but have simmered down to pre-COVID levels.
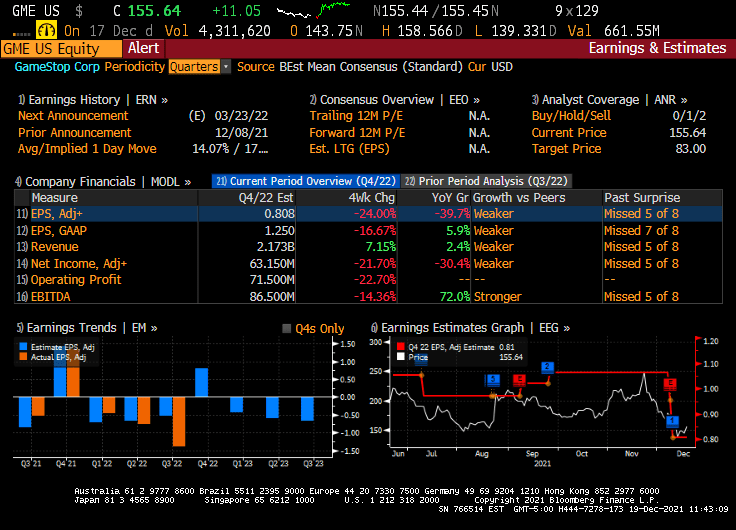
The earnings for GameStop were terrible (down 39.7% YoY). But at least Christmas season is upon us and maybe GameStop will surge with a good retail spending season.
But what happens to markets if the Federal government “stimulypto” is removed? If it ever is.
I love listening to Fed talking heads (or Fear The Talking Fed). They mostly seem to acknowledge that inflation is a problem and that the excessive monetary stimulus should be reduced.
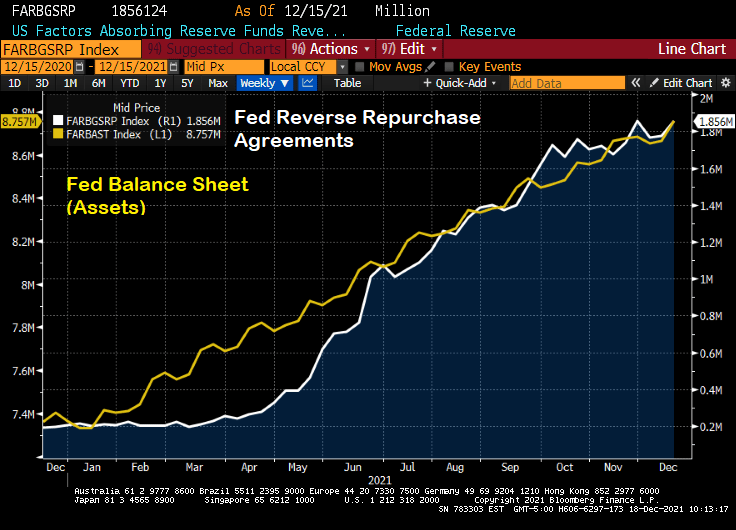
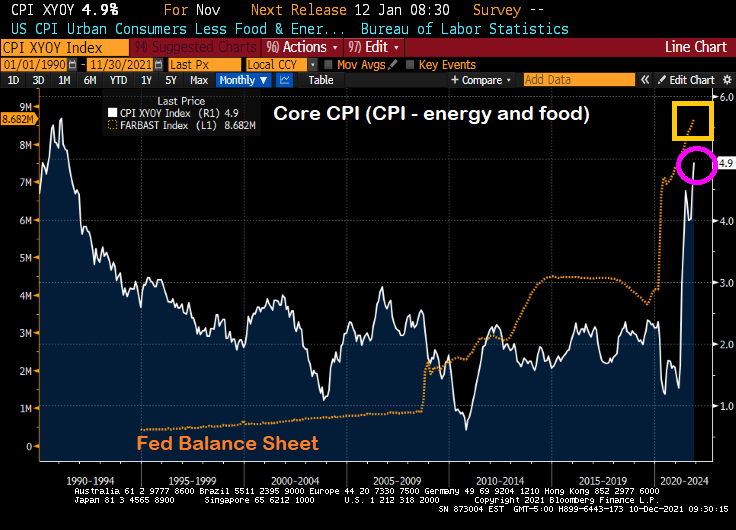
But then I see the chart of The Fed’s balance sheet and The Fed’s reverse repo operations.
Then we have Federal Reserve Governor Christopher Waller saying that Th Fed could start raising interest rates as early as its March 15-16 meeting, after deciding to end asset purchases sooner than planned. My question is … why wait until the March meeting?
Is it fear of the Omincron Variant (which sounds like a Frederick Forsyth thriller)? Does The Fed not want to rock the boat prior to the Christmas season? The US is at or near full employment, so what is the real reason for delaying a rate increase until March or June? Or the fear that Congress won’t pass Biden’s Build Back Better Act?
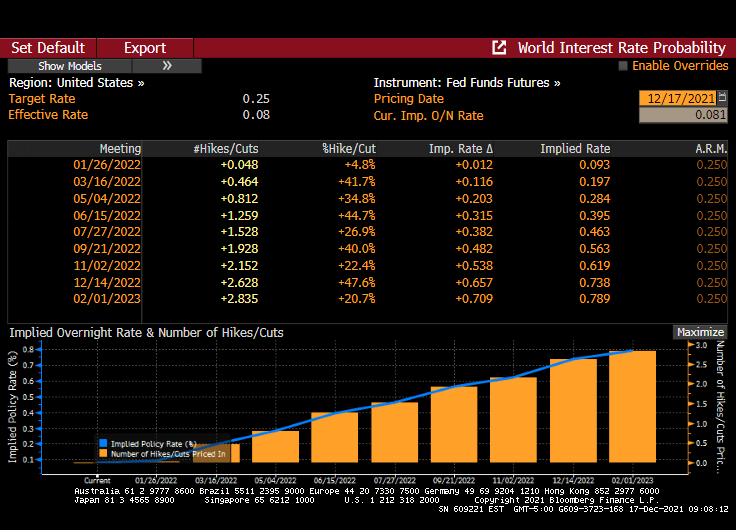
Fed Funds Futures infer that one rate hike will occur at the June Fed Open Market Committee (FOMC) meeting and one at the November meeting.
Turkey (the nation, not the bird) is now the Venezuela of Europe/Middle East, where insane government policies are destroying both nations.
(Dow Jones) — Turkey’s central bank intervened to arrest the plunge in the country’s currency, which lost as much as 8% of its value against the dollar on Friday in an ongoing crisis that is straining the country’s financial system.
The crash followed another decision by the central bank on Thursday to cut interest rates under pressure from President Recep Tayyip Erdogan, who favors lower rates as a part of a vision to grow the Turkish economy. Mainstream economists have urged the government to raise interest rates to control Turkey’s rising inflation, which reached more than 21% last month, according to official statistics.
The ongoing plunge is putting increasing pressure on ordinary Turks who have seen their savings evaporate, and adding to pressure on the banking system which has high levels of foreign-currency-denominated loans to repay within the next 12 months.
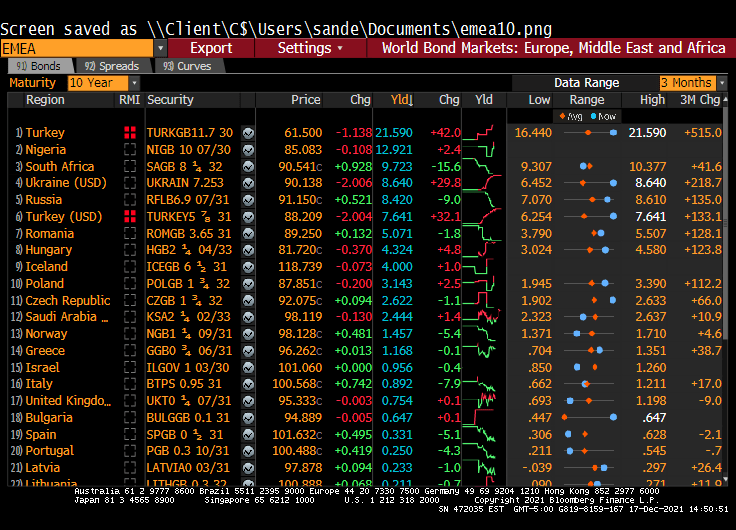
Wow. Turkey’s 10-year sovereign yield rose 42 BPS today to 21.590%. Turkey is looking like the Venezuela of Europe and the Middle East.
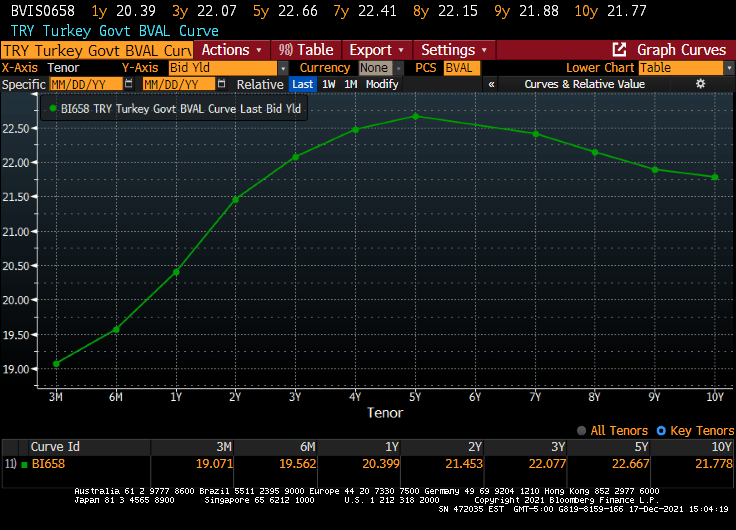
The Turkish sovereign curve in their home currency is humped.
But the Turkish yield curve (in US Dollars) looks more like the US Treasury actives curve.
The Turkish Lira is crashing against the US Dollar.
Meanwhile, the Central Bank of Turkey is cutting their repo rate as inflation soars. WTF???
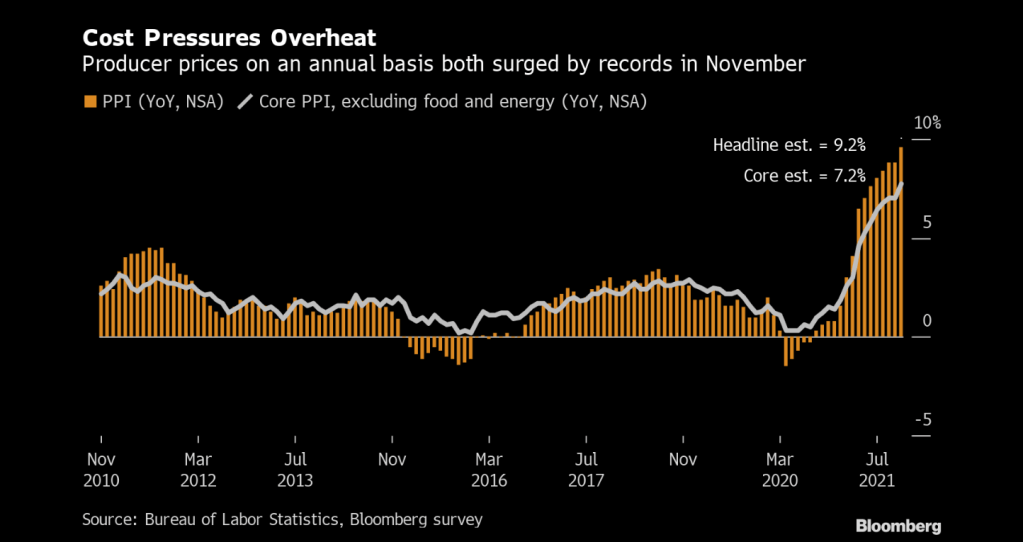
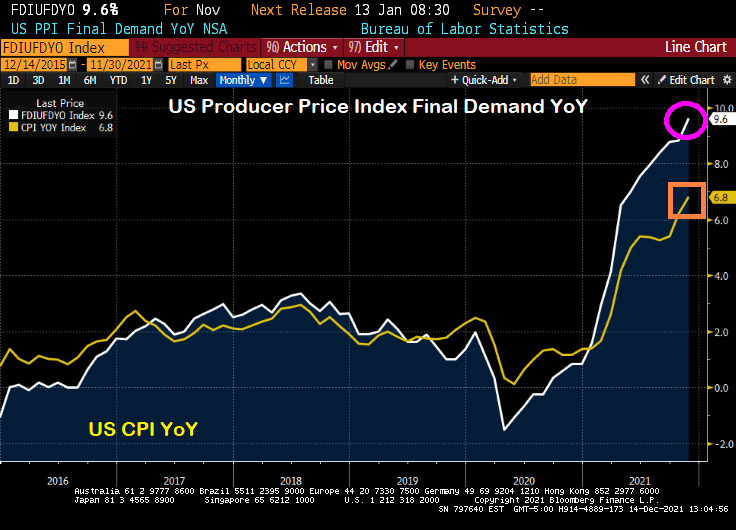
Prices paid to U.S. producers posted a record annual increase of almost 10% in November, a surge that will sustain a pipeline of inflationary pressures well into 2022.
The producer price index for final demand increased 9.6% from a year earlier and 0.8% from the prior month, Labor Department data showed Tuesday. Both advances topped economists’ forecasts.
Even more interesting (or frightening) is that PPI Final Demand YoY is soaring faster than CPI YoY. If CPI catches up to PPI, then we have serious trouble.
With inflation seemingly growing out of control, Powell and Biden should sing “76 Trillion Dollars” which will be the US national debt after Biden and Congress get done with their spending splurge.
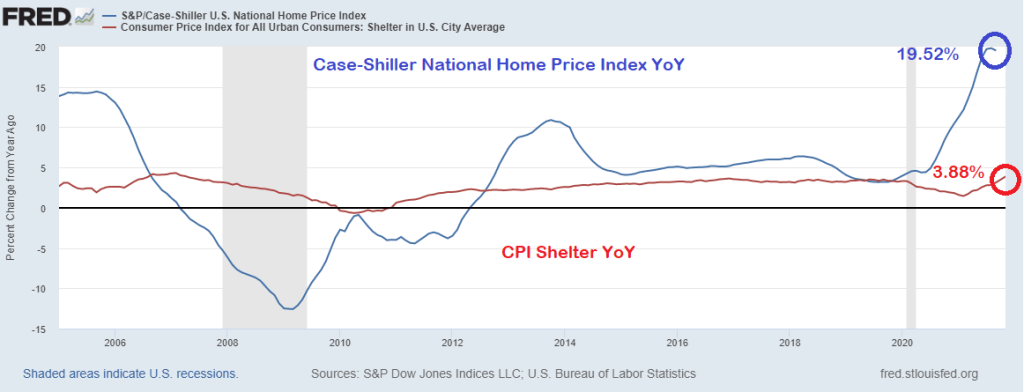
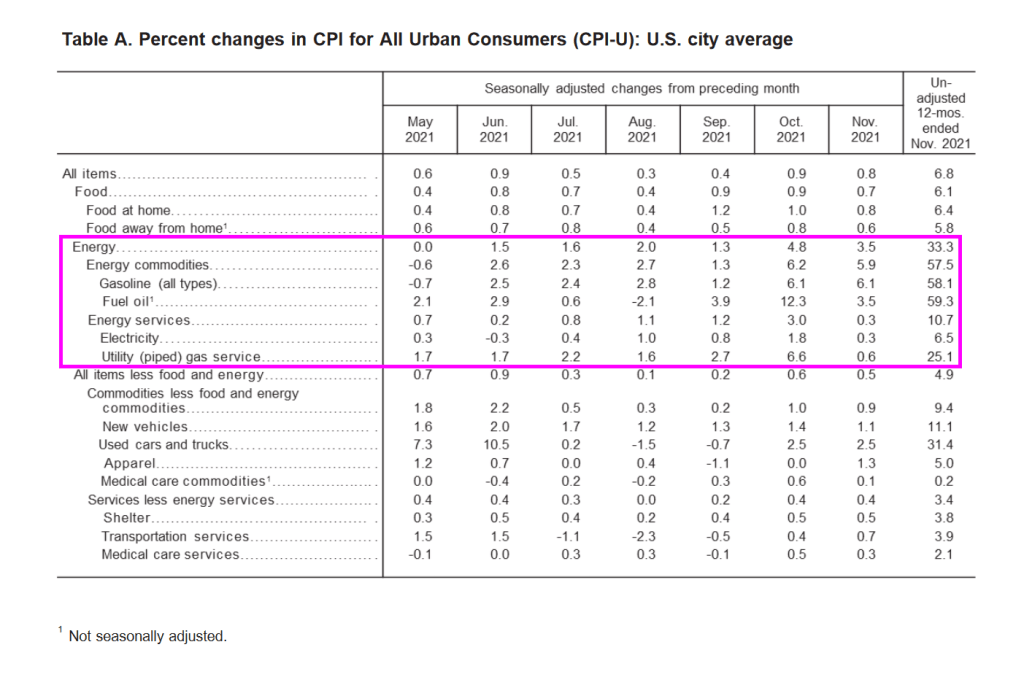
But that 6.9% YoY is very misleading because of the strange way the Bureau of Labor Statistics measures the largest asset in most households’ expenditures: housing.
The BLS measures inflation in housing using the Shelter measurement. Which was only 3.88% YoY. The problem is that the Case-Shiller National Home Price Index was 19.52% in its last reading. That is quite a discrepancy.
So, if we substitute the Case-Shiller National home price index for the CPI Shelter, we get an inflation rate of greater than 11%.
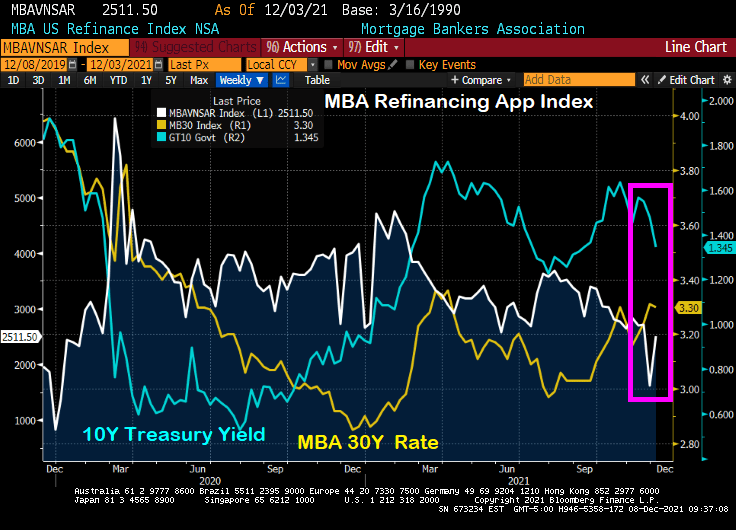
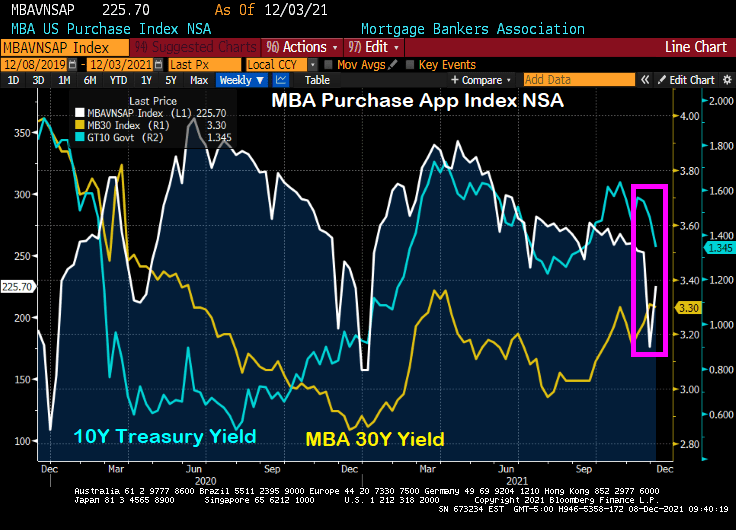
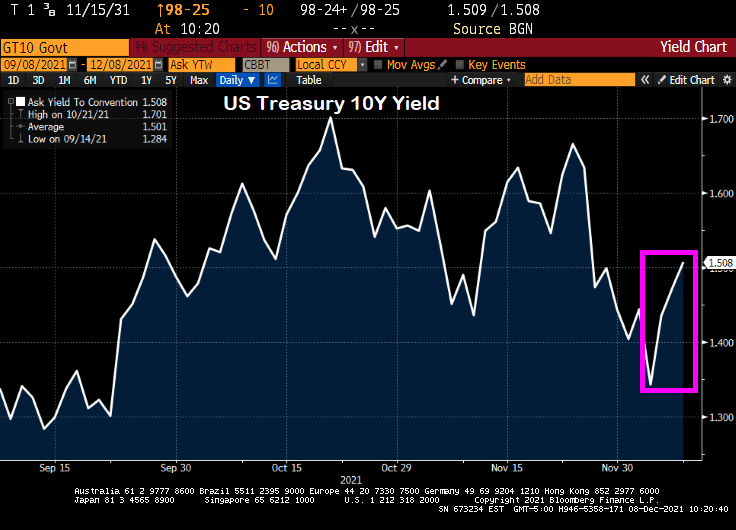
Despite the “Talk, Talk” from The Federal Reserve about balance sheet taper and rate “normalization,” we actually saw the 10-year Treasury yield fall from 1.6651% on 11/23/2021 to 1.343 on 12/3/2021. While the 30-year mortgage rate only fell from 3.31% to 3.3%, it is the SIGNAL that The Fed is sending that people should refinance their mortgages ASAP.
You can see the rise in mortgage refinancing applications of 56% week-over-week (WoW) (white line) with the drop in the 10-year Treasury yield (blue line) despite the relatively small drop in the Mortgage Bankers Association (MBA) tiny drop in their 30-year mortgage rate index.
Ditto for the MBA mortgage purchase application index. The drop in the US Treasury yield (blue line) resulted in a 28% WoW increase in mortgage purchase applications.
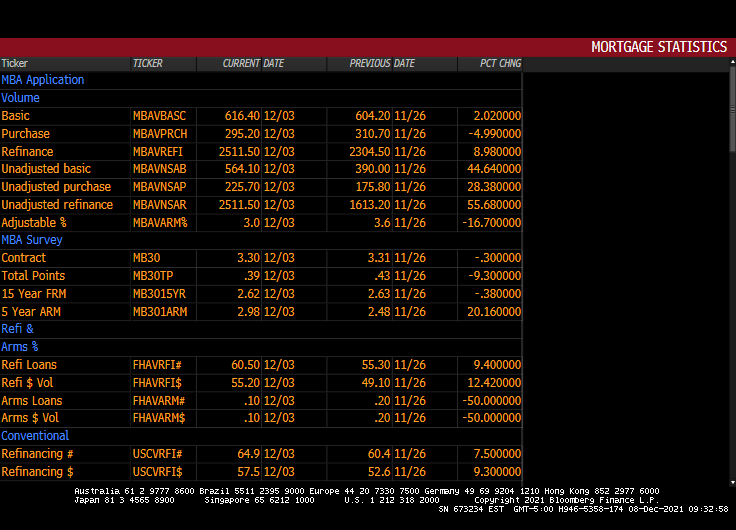
Here is the table of MBA data for the week of 12/03.
Please note that the 10-year Treasury yield have jumped since 12/03 indicating that mortgage application activity for the week of 12/10 will be lower.
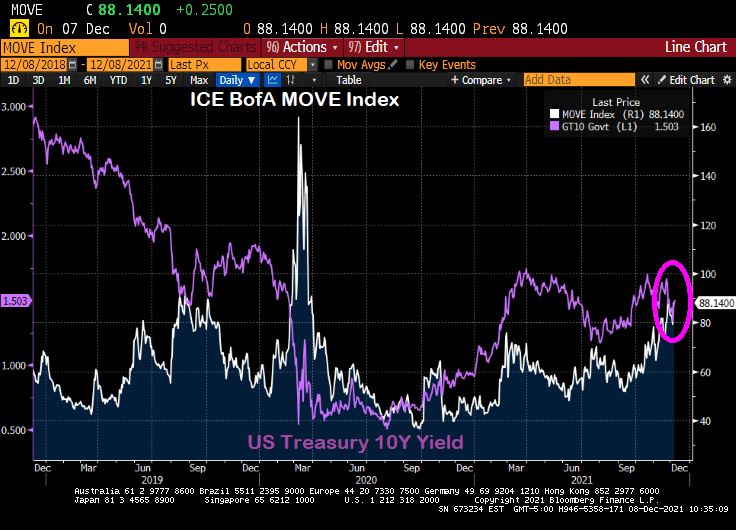
Here is the MOVE bond volatility index and the US Treasury 10-yield chart. Can you spot the COVID outbreak??
As The Federal Reserve tries to drain-off the extraordinary growth in its balance sheet since COVID without raising its target rate (good luck with that!), it is time to appraise where we are sitting. First, liquidity.
(Bloomberg) Buying and selling large quantities of U.S. government debt without substantially moving the market is about the hardest it’s been since the pandemic sent markets reeling in March 2020. Volatility has jumped, failed trades have increased — and Wall Street analysts warn that the Federal Reserve’s exit from bond-buying is set to make matters worse.
When markets seized up last year, liquidity in most Treasuries vanished, forcing the Fed to embark on massive asset purchases and other measures to avert a full meltdown. Now, the U.S. central bank is scaling back that buying, which has targeted the least-liquid Treasuries, and is poised to quicken the wind-down. At the same time, new government borrowing is ebbing, with the combination setting the stage for more fireworks.
OK, liquidity isn’t as bad as COVID and March 2020, but it is near the highest level since March 2020. The question is … will the numerous asset bubbles around the globe burstLet’s look at the ongoing saga of Chinese conglomerate Evergrande (mainly known as a large real estate developer). Their 8.25% bond has plunged to $23.481 on speculation of a catastrophic default on their bond payments. Then we have Invesco’s Golden Dragon China ETF (measuring a diversified market cap of US-listed companies headquartered or incorporated in China & derive a majority of their revenues from the People’s Republic of China). This ETF has crashed and burned back to pre-COVID (and Stimulytpo) levels.
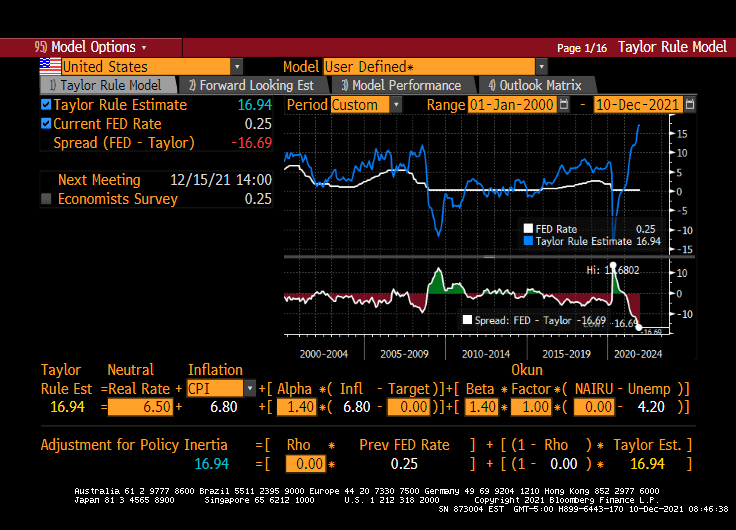
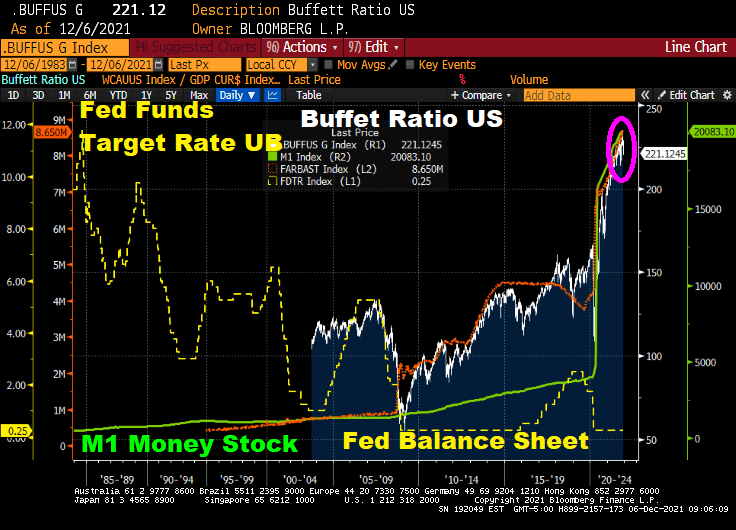
Speaking of cracks, how will the Buffett Ratio US react to a reduction in The Fed’s balance sheet (orange line) and M1 and M2 Money stock? Given that the Fed Funds target rate is WAY below where it should be (according to the Taylor Rule).
As I mentioned yesterday, the Shiller CAPE ratio is at its highest level since the Dot.com debacle of 2000. How will the Shiller CAPE ratio react to The Fed’s tapering?
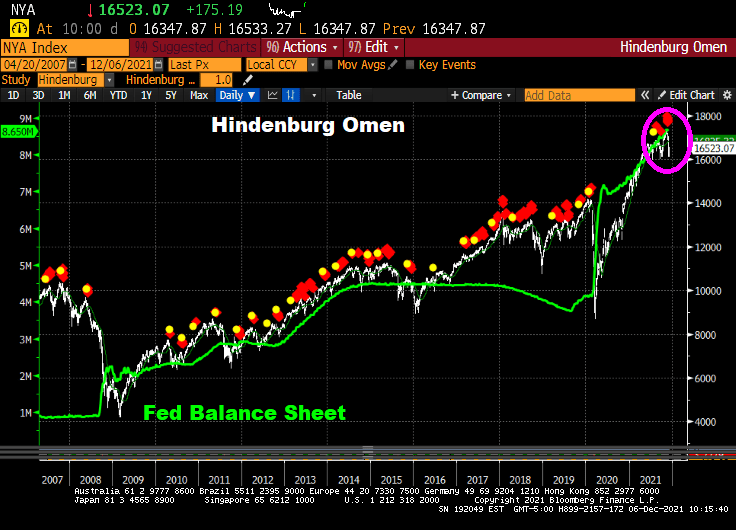
Even the Hinderburg Omen is flashing red … again.
Now, the Dow is up 600 points today, primarily on the news that the Omicron Variant is about as harmful as the common cold.
A major shift is underway at the Federal Reserve to begin to remove the central bank’s massive pandemic easing policies, and could see it hike rates sooner than is priced in by markets.
Comments by Fed officials suggest the central bank is likely to decide to double the pace of its taper to $30 billion a month at its December meeting next week. Initial discussions could also begin as soon as the December meeting about when to raise interest rates and by how much next year with Fed officials set to submit a fresh round of economic forecasts and projections for the fed funds rate.
There is no consensus yet on when to begin hikes, but it’s clear that the faster taper is designed to give the Fed flexibility to raise rates as soon as the spring. The markets do not appear to expect the first rate hike until the summer of 2022.
Uh-huh. Let’s see what happens when and if The Fed starts to taper. Is economic growth so strong that it can continue without Federal Stiumulypto? THAT is the right question.
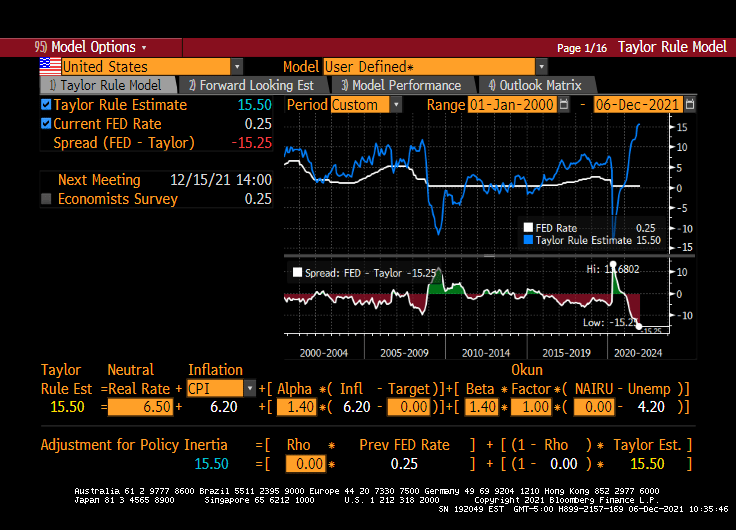
Look at the above charts and tell me if The Fed will actually raise their target rate more than twice. Despite the Taylor Rule suggest a target rate of 15.50% to cool inflation.
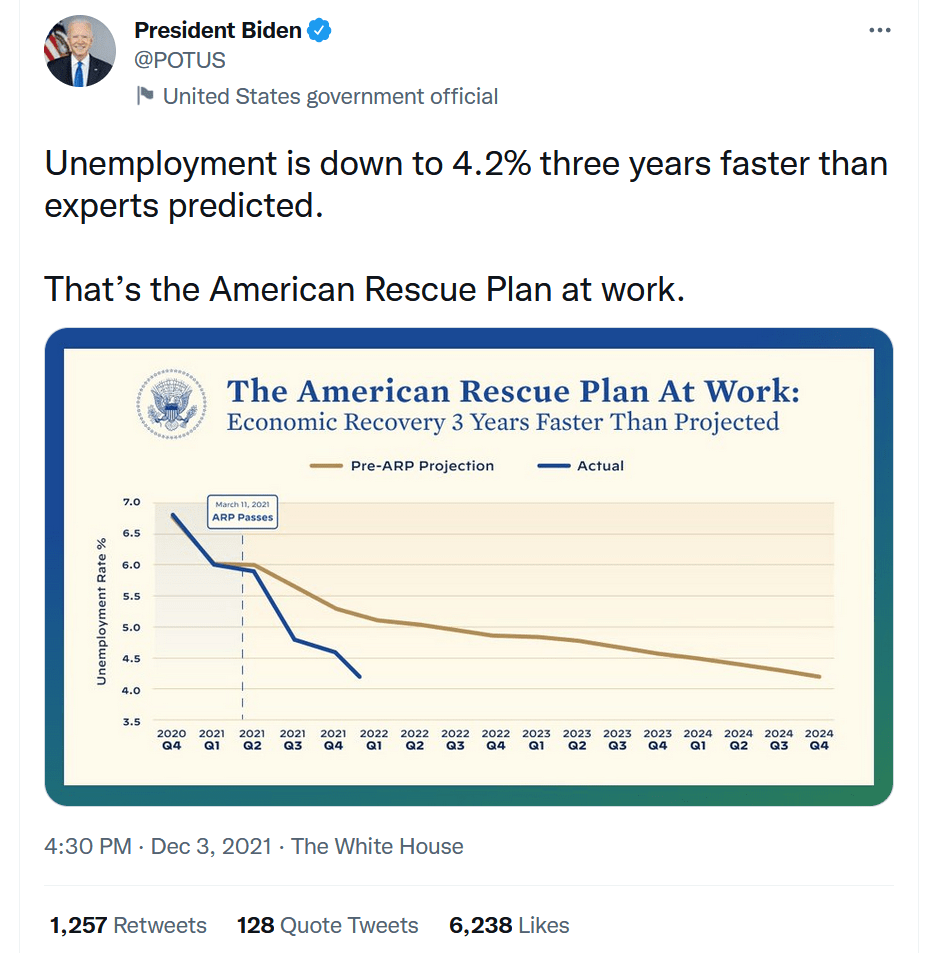
President Joe Biden took to Twitter yesterday to celebrate how well his economic policies are working, particularly the American Rescue Plan. Between Congress and The Fed pumping trillions of dollars of stimulus in the economy, how is this surprising? Or a reason for celebration?
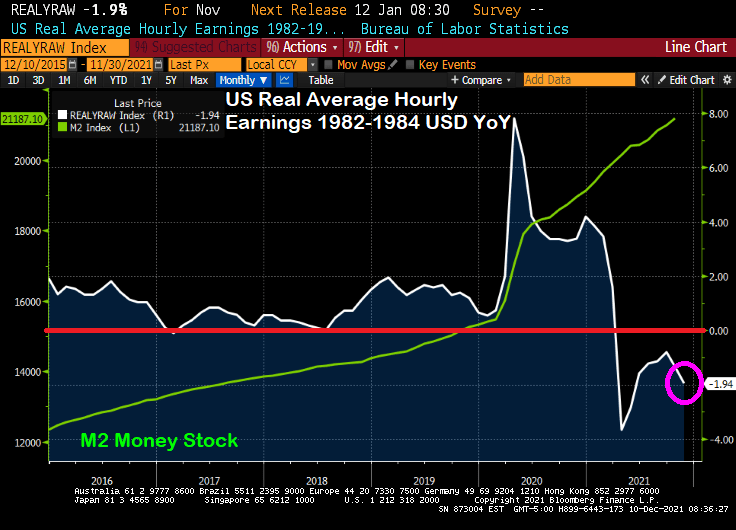
While declining unemployment is great, there is more to the story that President Biden failed to mention. Like … the number of people NOT in the labor force remains near 100 million (99,997,000 to be exact). Thanks to Covid-related policies (like job loss due to resisting vaccinations), increasing retirement, etc.), NOT in labor force remains elevated compared to pre-Covid levels. And, of course, Biden doesn’t want to mention that inflation is growing faster than hourly wage growth resulting in REAL hourly wage growth being -1.4% YoY.
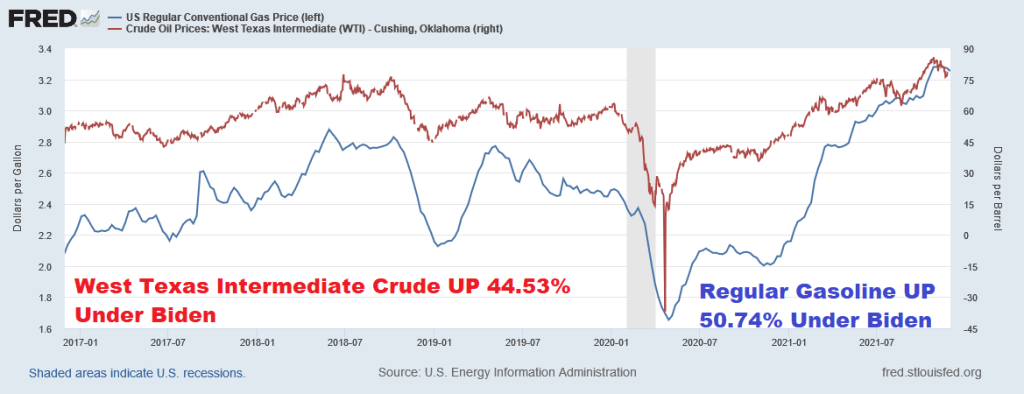
And President Biden took credit (he is a politician, after all) for a small decline in gasoline prices. Of course, after helping send gasoline prices up over 50% since he took office.
So, is Biden going to take credit for increasing gasoline prices by 50%? And declining REAL average hourly earnings? Or over 100 million people NOT in the labor force? I doubt it. But he is focusing on the POSITIVES of his American Rescue Plan.


You must be logged in to post a comment.