Alarm! Big Short Resurfaces in U.S. Bonds, Wary of ‘Convexity Trigger’

Alarm!

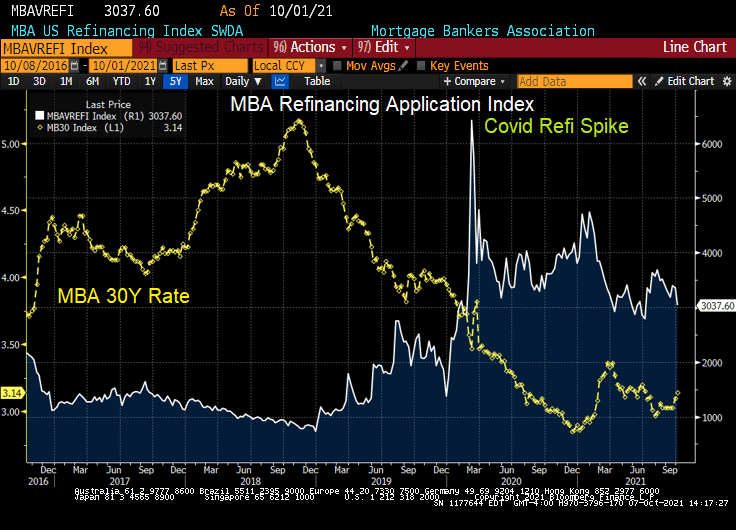
It was great to be a “Master of the Universe” (Treasury and MBS trader) since October 1981 when the US 10Y Treasury yield peaked at 15.84% and mortgage rates peaked at 18.63%. Treasury and mortgage rates have generally fallen ever since. But what happens if Treasury and mortgage rates rise?

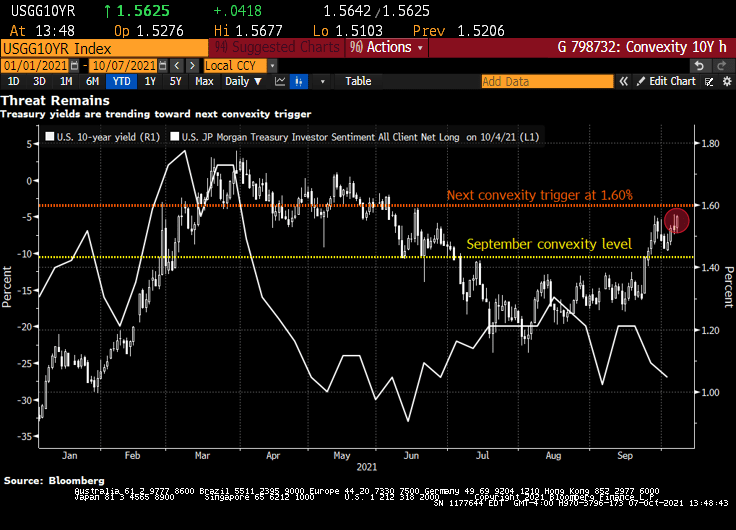
Bond investors are piling back into short positions, motivated not only by the specter of inflation but also by the risk that yields are approaching levels that will unleash a wave of new selling by convexity hedgers. 

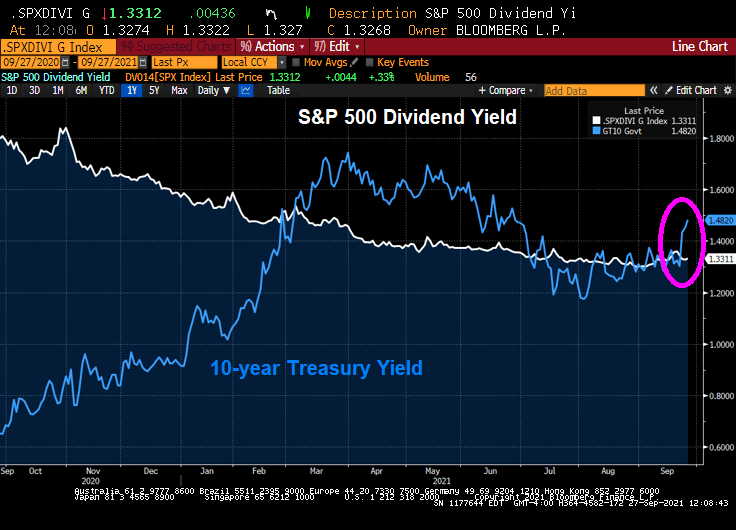
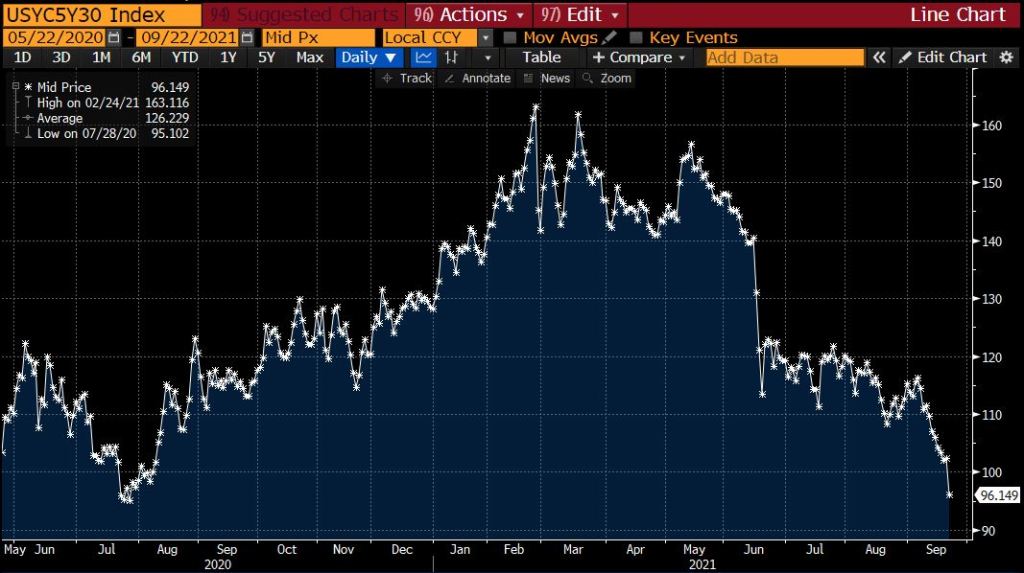
That level is around 1.60% in the U.S. 10-year Treasury yield, less than 10 basis points from its current mark, according to Brean Capital’s head of fixed income strategy, Scott Buchta. It’s the mid-point of “a key threshold” between 1.40% to 1.80%, an area “most critical from a convexity hedging point of view.”

Convexity hedging involves shedding U.S. interest-rate risk to protect the value of mortgage-backed securities as yields rise, slowing expected prepayment rates.

It’s already begun to pick up as yields stretched past the 1.40% level. Another wave is expected at around 1.6% — a point of “maximum negative convexity” in agency MBS, “where 25bp rallies and sell-offs should have an equal effect on convexity-related buying and selling,” Buchta says. 

Signs that short positions are accumulating include Societe Generale’s “Trend Indicator.” Among its 10 newest trades are short positions in Japanese 10-year debt, German 5-year debt futures, U.K. 10-year gilts, U.K. short sterling and U.S. 2- and 5-year notes. Meanwhile, CFTC positioning data for U.S. Treasury futures show asset managers flipped to net short in 10-year note contracts in the process of dumping the equivalent of $23 million per basis point of cash Treasuries over the past week. Hedge-fund shorts also remain elevated in the long-end of the curve, as measured by net positions in Bond and Ultra Bond futures. 

“Bond-bearish impulses remain in place,” says Citigroup Inc. strategist Bill O’Donnell in a note, citing tactical and medium-term set-ups. Traders should be aware of short-covering rallies in the meantime, however, he says. 

“Potentially extreme short-term positioning and sentiment set-ups could easily allow for a counter-trend correction under the right conditions,” he said.

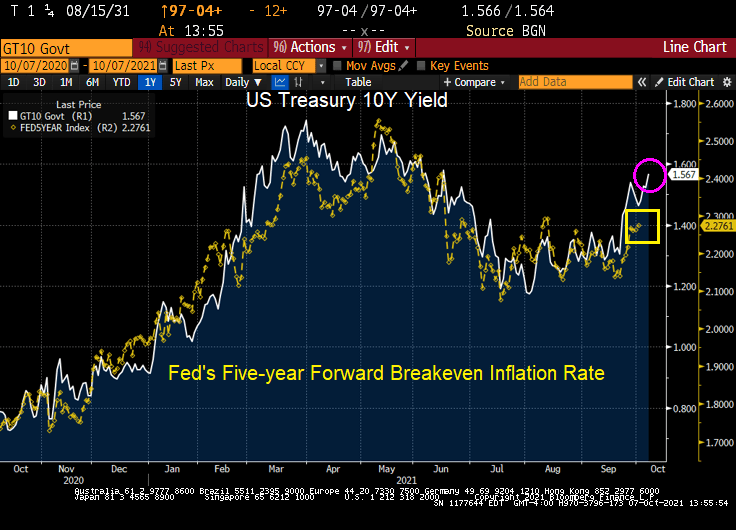
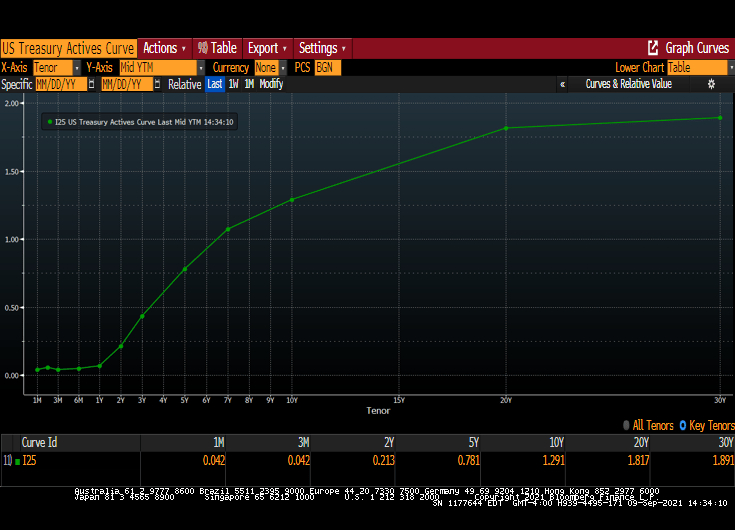
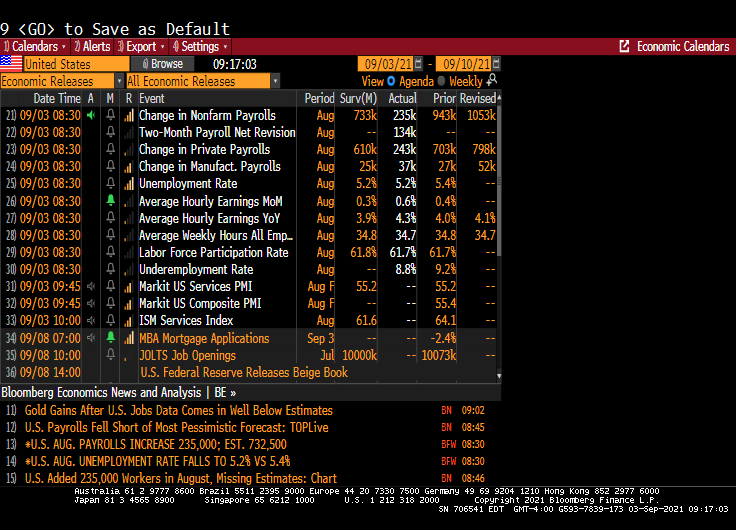
U.S. 10-year yields topped at 1.57% this week, the cheapest level since June, spurring the breakeven inflation rate for 10-year TIPS to 2.51%, the highest since May. Friday’s September jobs report could add fuel to this inflationary fire, rewarding bond shorts. 

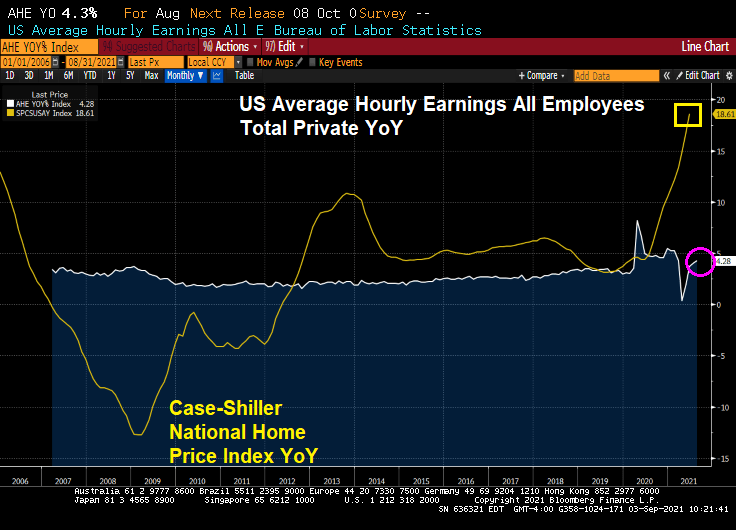
Here is a chart of the rising 10Y Treasury yield against The Fed’s 5Y forward breakeven rate.

Here is a Fannie Mae 3% coupon MBS. Note the rise in Modified Duration with an increase in interest rates.

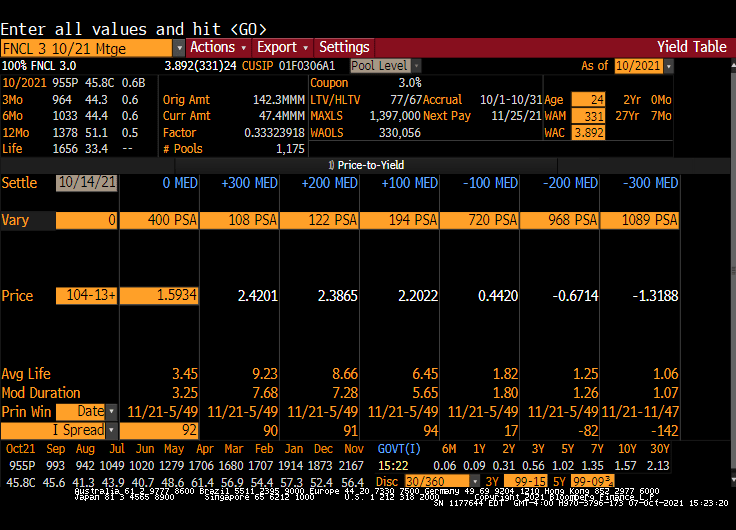
Convexity for the FNMA 3% MBS?

There is something on the wing. Some-thing.

Fed Chair Powell calls inflation ‘frustrating’ (consumers call it ‘devastating’)

Federal Reserve Chair Jerome Powell calls inflation ‘frustrating.”

Only a multi-millionaire like Powell would call it frustrating. Most US consumers would call it “devastating.”

Look at home prices, natural gas, gasoline and food prices since The Fed turned on the money pump to combat the Covid shutdown by government. Well, at least food price growth has slowed, but that is more that offset by natural gas (heating) costs skyrocketing.

Rent? That too has zoomed upwards, although Powell likely isn’t worried about his rent rising by 11.5%.

I wonder if Powell is frustrated by banks parking their money at the Fed’s reverse repo facility? Ninety-two participants on Thursday placed a total of $1.605 trillion at the Federal Reserve’s overnight reverse repurchase agreement facility, in which counterparties like money-market funds can place cash with the central bank. The previous record, set the day before, was $1.416 trillion. Thursday’s leap was the biggest one-day increase in usage since mid-June.

Biden blames “greed” for rising prices, Powell is “frustrated” by bottlenecks. But why pump trillions into the economy when you know there are bottlenecks? Or meatpacking firms are “greedy”?

10-Year Yields Rise Above 1.5% as Central Banks Turn “Hawkish” (FAANG Stocks Trail S&P 500 As Rates Rise)

Central banks are turning “hawkish” in the face of inflation.

(Bloomberg) — Treasuries fell, sending 10-year yields to a three-month high, as traders braced for a testing week of heavy bond auctions and continued to digest the prospect that central banks in the U.S. and Europe will step up the pace of policy tightening.

The yield on 10-year Treasuries reached 1.51%, the highest since June, before settling at 1.48%. The yield has climbed 16 basis points over the past week as the Federal Reserve signaled it may start reducing its asset purchases in November and raising rates as soon as next year. Yields on two- and five-year Treasuries hit their highest levels since early 2020, with a combined $121 billion of the securities set to be sold Monday. A seven-year auction is due Tuesday. 

While Treasuries briefly extended the selloff after a report showed durable goods orders exceeded economists’ forecasts, they started to pare losses after U.S. equity futures soured. 

Bond yields increased across the globe last week as central banks move to reduce pandemic stimulus. The Bank of England surprised markets by raising the prospect of increasing rates as soon as November, and Norway delivered the first post-crisis hike among Group-of-10 countries. In the U.S., traders pulled forward wagers on an interest-rate increase to the end of 2022 following last week’s Fed meeting. 

On the equity side, FAANG stocks trail the S&P 500 as 10-year Treasury yield climb.

We have the 10-year Treasury yield climbing above the S&P 500 dividend yield.

Here are The Fed and The ECB turning “hawkish.”

US Homeowner Equity Surged +29.3% YoY (California The Biggest Gainer) Thanks Mostly To Federal Reserve

Since Q2 2020, US homeowners have been big winners in terms of home price gains and equity in their homes. Unfortunately, this means that renters are big losers. Once again, The Federal Reserve is benefiting once segment of the population while punishing the other segment.

Homeowner Equity Q2 2021

CoreLogic analysis shows U.S. homeowners with mortgages (roughly 63% of all properties*) have seen their equity increase by a total of nearly $2.9 trillion since the second quarter of 2020, an increase of 29.3% year over year.

*Homeownership mortgage source: 2016 American Community Survey.

Figure 1 National Homeowner Equity YOY Change

National Homeowner Equity

In the second quarter of 2021, the average homeowner gained approximately $51,500 in equity during the past year.

California, Washington, and Idaho experienced the largest average equity gains at $116,300, $102,900 and $97,000 respectively. Meanwhile, North Dakota experienced the lowest average equity gain in the second quarter of 2021 at $10,600.

Figure 4 National Homeowner Equity Average Equity Gain

10 Select Metros Change

CoreLogic provides homeowner equity data at the metropolitan level, in this graphic 10 of the largest cities, by housing stock are depicted. 

Negative equity has seen a recent decrease across the country. San Francisco-Redwood City-South San Francisco, CA, is the least challenged, with Negative Equity Share of all mortgages at 0.6%.

Figure 5 National Homeowner Equity

Loan-to-Value Ratio (LTV)

The graph represents National Homeowner Equity Distribution across multiple LTV Segments.

Figure 6 National Homeowner Equity Loan-to-Value Ratio

Since growing home equity lead to lower default risk (or at least losses to the mortgage holder), we are seeing mortgage delinquencies fall after the Covid surge.

Of the top ten cities, Chicago leads in negative equity.

Maybe Fed Chair Jerome Powell is trying to soothe us, like Sam and Dave.

Someday Soon! Fed Does Nothing But Signals That Tapering Would Begin “Soon” As In 2022

Judy Collins could have sang today’s Fed announcement. All they said was “Someday soon.”

Federal Reserve officials signaled they would probably begin tapering their bond-buying program soon and revealed a growing inclination to start raising interest rates in 2022. 

If progress toward the Fed’s employment and inflation goals “continues broadly as expected, the committee judges that a moderation in the pace of asset purchases may soon be warranted,” the U.S. central bank’s policy-setting Federal Open Market Committee said Wednesday in a statement following a two-day meeting.   

The Fed also published updated quarterly projections which showed officials are now evenly split on whether or not it will be appropriate to begin raising the federal funds rate as soon as next year, according to the median estimate of FOMC participants. In June, the median projection indicated no rate increases until 2023.

Rates remained the same.

Dots? Liftoff projected for 2022.

The redline version of today’s speech.

Powell said that balance sheet tapering could begin in November. Agency MBS purchased by The Fed is still growing!

Reaction in Treasury markets? The 30Y-5Y curve dropped below 100 bps.

After that nonsubstantive meeting, The Fed FOMC members are probably headed down to a nightclub.

Kind Of A Drag! The Taper That Will Really Bite Into U.S. Growth Isn’t the Fed’s (As The Fed’s Repo Facility Hits An All-time High)

Kind of a drag … when Federal government stimulus fades just as The Fed tries to decide on slowing its balance sheet expansion.

(Bloomberg) — In the coming Year of the Taper, it’s the fiscal version that will really bite.

The chatter in U.S. financial markets is all about the Federal Reserve’s yet-to-be-announced reduction of its bond purchases. That’s obscuring something important: the already-under-way cutback of the federal government’s budgetary support — which is likely to have a much bigger impact on economic growth next year.


The U.S. expansion looks set to slow sharply in the second half of 2022 as measures that propped up the economy during the pandemic — from stimulus checks for households to no-cost financing for small companies — fade from view.

That will be the case even if President Joe Biden manages to win Congressional approval for the bulk of his $3.5 trillion Build Back Better agenda. The spending will stretch over years, with limited impact in 2022. It will also be at least partly paid for by tax increases that slow the economy down rather than speed it up.

And then the is Treasury Secretary Janet Yellen renewing her call for Congress to raise or suspend the U.S. debt ceiling, saying the government will otherwise run out of money to pay its bills sometime in October.

We can see the CDS market reacting … slightly … to Yellen’s concerns.

But next to Argentina’s CDS, the US looks positively tame.

And there is a little disturbance in the Fed Funds Futures volatility.

Then we have the volatility cube showing The Fed’s rate suppression at the short end and expected volatility in the future.

And there we have The Fed’s temporary repo facility hitting an all-time high.

Mercy, mercy, mercy!

Eurodollar Futures Volume Surge Anticipates Fed Taper Signal (Are You Ready For Feddy?)

The next Federal Reserve Open Market Committee (FOMC) meeting is next week with an announcement on Wednesday, September 22nd.

(Bloomberg) — Volume in the December 2024 eurodollar futures contract has surged Friday, approaching 200k, highest in the strip. Weekly volume exceeds 800k ahead of next week’s FOMC meeting. The December 2024 contract is a proxy for the Fed’s taper timeline, similar to the belly of the Treasuries curve (aka, the belly of the beast).

As of 2:30pm ET, nearly 197k Dec24 eurodollar contracts had traded, bringing weekly total to 816k, third most in its lifetime; notable flows on the day have included three block trades for 5k each:

The contract also appeared in curve trades including 9.3k Sep24/Dec24 3-month, 18.9k Dec23/Dec24 12-month and 24.8k Dec22/Dec24 24-month

The Dec22/Dec24 eurodollar spread has been in the spotlight since Morgan Stanley recommended the steepener in June as a way to exploit the disconnect between expectations for the pace and timing of Fed rate increases

As of today, we see a kink in the US Dollar Swaps curve at 21m.

With inflation the highest since 2008, and M2 Money still growing at 12.1% YoY, it is time for The Fed to take it foot off the accelerator pedal.

The Fed’s Dots Plot as of the last FOMC meeting indicates a willingness to let the Fed Funds Target rate start rising again after over a decade of rate suppression.

Given the fear of The Fed tapering (eventually), is it any wonders alternative investments such as Bitcoin have risen as The Fed cut rates?

Will Fed Chair Jerome Powell and the gang announce a change on September 22nd? Probably need a fortune teller to answer that question.

Yields Plunge After Spectacular 30Y Auction, Lowest Dealer Takedown On Record (Yellen Fearmongering US Debt Default)

Face it, the 30-year Treasury market is not as interesting as widely-traded as the 10-year Treasury market. But we did see some interesting revelations in today’s 30 year Treasury auction.

If yesterday’s 10Y auction was blockbuster, one of the strongest benchmark sales on record, then today’s $24 billion offering of 30Y paper – the last coupon auction of the week – was nothing short of spectacular.

Printing at a high yield of just 1.910%, the auction not only stopped at the lowest yield since January’s 1.825%, but also stopped through the When Issued by a whopping 1.8bps, the most since April and ended 4 consecutive months of tails in the 30Y tenor.

The bid to cover of 2.486 was not only a big jump from last month’s 2.208 but also the highest since the 2.500% in July 2020, and far above the six-auction average of 2.276.

The bid-to-cover ratio is the dollar amount of bids received in a Treasury security auction versus the amount sold. The bid-to-cover ratio is an indicator of the demand for Treasury securities. A high ratio is an indication of strong demand.

Primary dealers are responsible for absorbing any supply not bought by direct or indirect bidders. Indirect bidders, which include fund managers and foreign central banks. Dealer takedown of the 30Y Treasury is historically low.

The 10-year auction was similar in that the high rate fell. But the bid-to-cover declined.

The US Treasury actives curve remains upward sloping, albeit at lower yields across the curve.

Meanwhile, Treasury Secretary Janet Yellin’ is fear-mongering about a possible US debt default. True, US Treasury cash balance has declined to $231 billion.

Will Congress pass a budget and fill the Treasury coffers will lots of money? Of course. Here is the US CDS curve compared to Venezuela’s CDS curve. The US curve is close to zero while Venezuela’s at near 1,600 across tenors.

Treasury Secretary Janet Yellen.

Slowdown! U.S. Annual Home Prices Gain a Record 18% in July (But Forecast To Slow Considerably By July 2022)

Slowdown! Forecast home price growth for July 2022, that is.

(Bloomberg) — U.S. home prices increased 18% in July compared to a year earlier, according to a CoreLogic Inc. report released Tuesday.

The jump is the largest 12-month gain in the index since the series began 45 years ago. On a month-over-month basis, home prices increased by 1.8% in July from June. 

Home price appreciation continues to escalate as millennials entering their prime home buying years, renters looking to escape skyrocketing rents and deep pocketed investors drive demand,” said Frank Martell, president and CEO of CoreLogic, a global property-information firm. 

The rush of home buyers — amid extremely low mortgage rates — has caused a lack of supply, which is unlikely to be resolved over the next five to 10 years “without more aggressive incentives for builders to add new units,” he said in a statement

But it is the forecast for July 2022 that is interesting. A slowdown in home price growth across the board.

Lets see what happens to wage growth are three out of four Americans lose their Covid benefits as of today.

Taper Vapor! Only 235,000 Jobs Added Versus Expectations Of 733,000 (Hopes Of Fed Taper Go Up In Smoke) Silver, Bitcoin, Ethereum Rise

Well, after the dismal ADP print we knew that the August jobs numbers would be worse than imaginable. And they were!

A big miss on the topline job creation number — the establishment survey suggested only 235,000 jobs were created in August, versus expectations for 733,000 — has undercut what little chance there was left of a Fed announcement on tapering later this month. It should make for a very interesting debate among policy makers about forward momentum in the labor market.

The shocker was in the leisure and hospitality sector, which created zero new jobs on net in August after figures of around 400,000 in each of the previous two months. There was a dip in hiring in other service sectors too, but nowhere near as significant. That could perhaps be due to some early impact from the spread of the delta variant in recent weeks.

On the household survey, the numbers looked better. According to those figures, the unemployment rate fell to 5.2%, in line with estimates, thanks to a 509,000 increase in reported employment. That also propelled the prime working-age employment to population ratio to 78%, from 77.8% in July.

Disparities narrowed in August as well, according to prime working-age EPOP ratios by race and ethnicity. Prime working-age Black EPOP, in particular, jumped to 73% from 72.2% the month before — outpacing the rest.

Equity futures pared a modest gain after the release, with contracts on the S&P 500 Index flat as of 9:09 a.m. in New York. With wages climbing, Treasury yields rose, with those on 10-year notes rising 4 basis points to 1.33%. The Bloomberg Dollar Index was down 0.3%.

The unemployment rate dropped which a misleading headline. That simply means that more people dropped out of the labor force than were unemployed. Not a good way to lower the unemployment rate.

Alternative investments silver, Bitcoin and Ethereum rose on the lousy jobs report as the US Dollar dropped.

The good news? US Average Hourly Earnings All Employees Total Private YoY rose to 4.28%! The bad news? US home prices are rising at a 18.61% pace.

The bad news? Black unemployment rose to 8.8% in August while white unemployment fell to 4.5%. This represents a widening of the employment gap that is higher in August than pre-Covid.

There are still over 100 million NOT in the labor force, higher than pre-Covid.

So, The Fed’s plans to begin tapering have gone up in smoke.