Welcome to The Fed’s Gilded Age … for housing! The gilded age refers to the thin-veneer of gold covering up problems in the late 1800s.
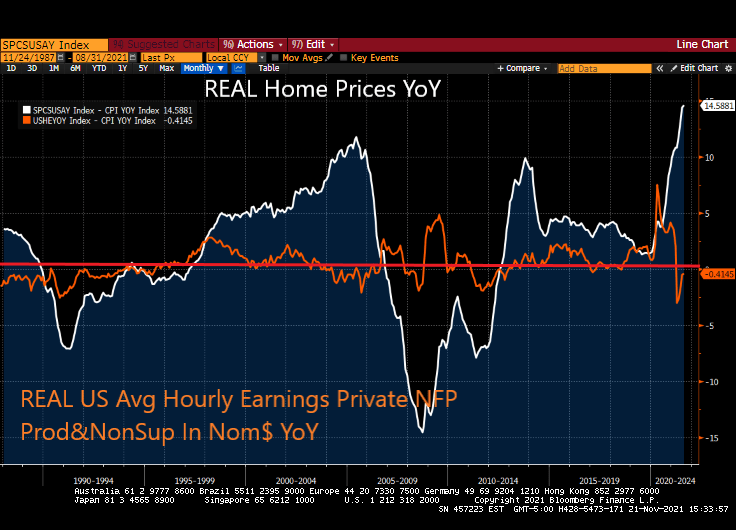
Today’s gilded age is largely fueled by The Federal Reserve’s uber-easy monetary policies combined with absurd Federal government policies. The result? Thanks to inflation, REAL home prices are growing at 14.6% YoY while REAL hourly earnings are declining (-0.41% YoY).
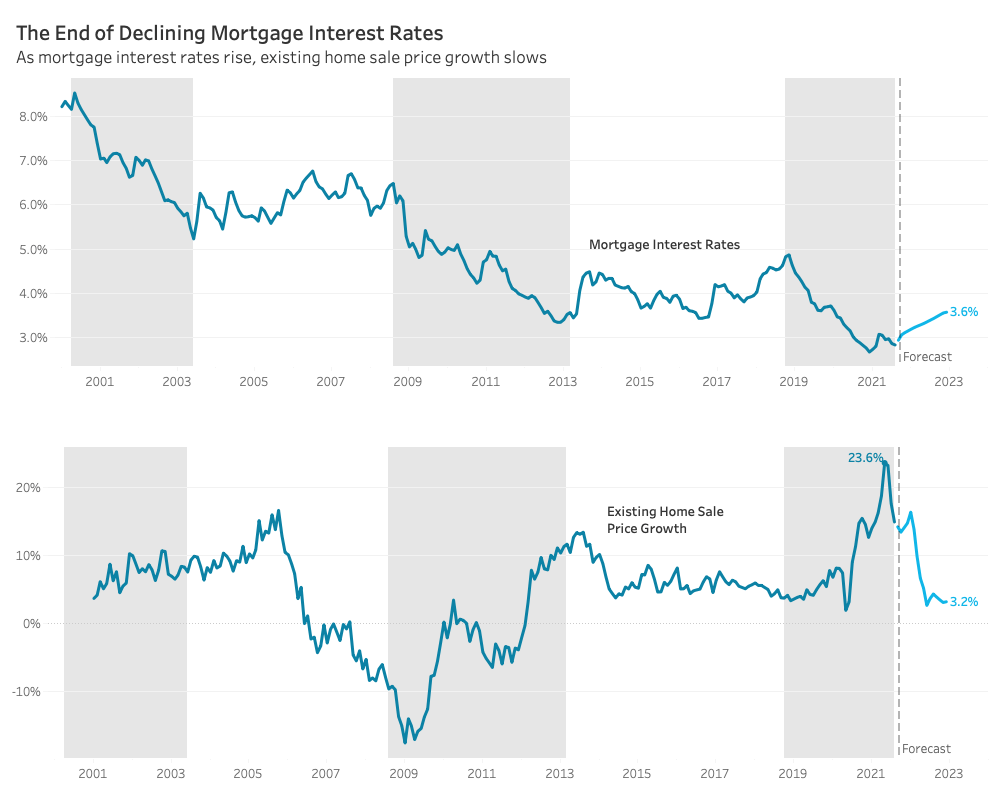
Redfin predicts a more balanced housing market in 2022. Part of their rationale is that they predict mortgage rates will rise to 3.6%. This growth in the mortgage rate is predicted to slow home price growth to 3.2% from double digit growth currently.
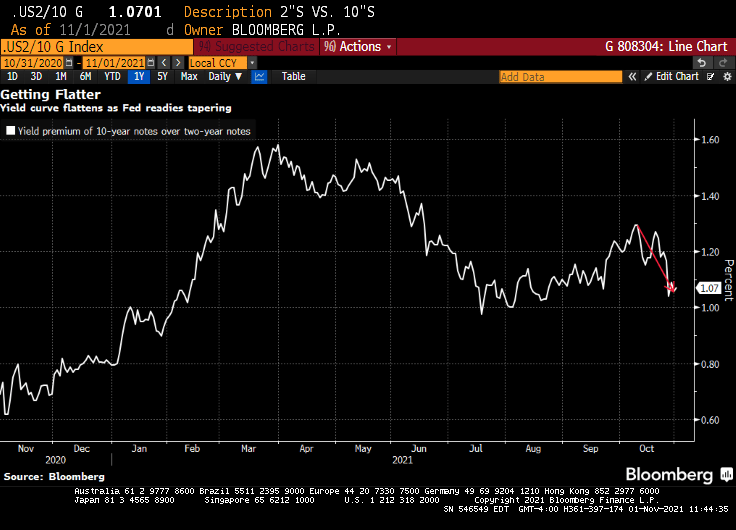
While this scenario is plausible, it will require a change in direction of the 10-year Treasury yield which has been declining since 1981. 5.39% YoY inflation may encourage The Fed to raise rates.
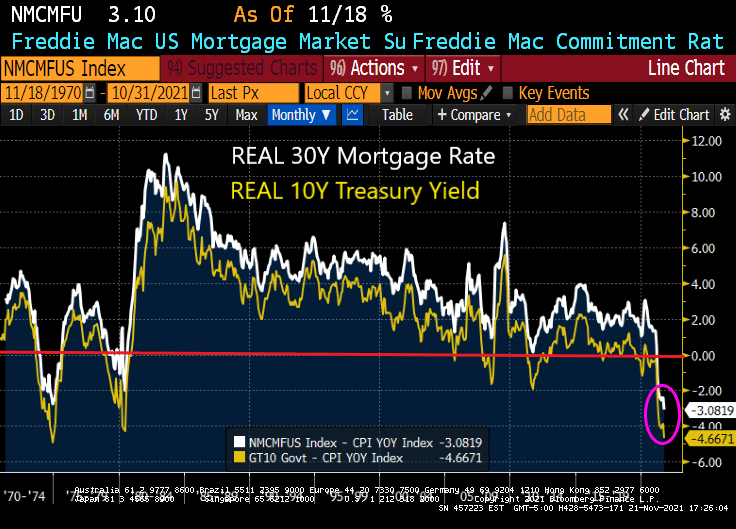
Today’s REAL 30-year mortgage rate is -3.08% while the REAL 10-year Treasury yield is -4.67%. It will require a reduction in inflation AND an increase in the nominal rate to get to 3.6%.
With the Freddie Mac 30-year survey rate at 3.10, will a 50 basis point increase in mortgage rates send the market crashing? Not likely.
After all, the US economy is under the thumb of The Federal Reserve.
Combine vaccine mandates that lower the workforce and the flood of economic and monetary stimulus by the geniuses in Washington DC, and we have a Thanksgiving problem.
Supplies of food and household items are 4% to 11% lower than normal as of Oct. 31, according to data from market-research firm IRI. That figure isn’t far from the bare shelves of March 2020, when supplies were down 13%.
For grocery shoppers this holiday season, it means that someone with 20 items on their list would be out of luck on two of them.
Although U.S. supermarket operators started purchasing holiday items early, aiming to avoid shortages, many holiday essentials are already in short supply.
Turkeys are very low in stock. By the end of October turkeys were over 60% out of stock—lower than the same time last year by more than 30 percentage points. A spokesperson for Butterball LLC, one of the largest U.S. turkey processors, said the company has been experiencing similar labor and supply challenges as other organizations and industries.
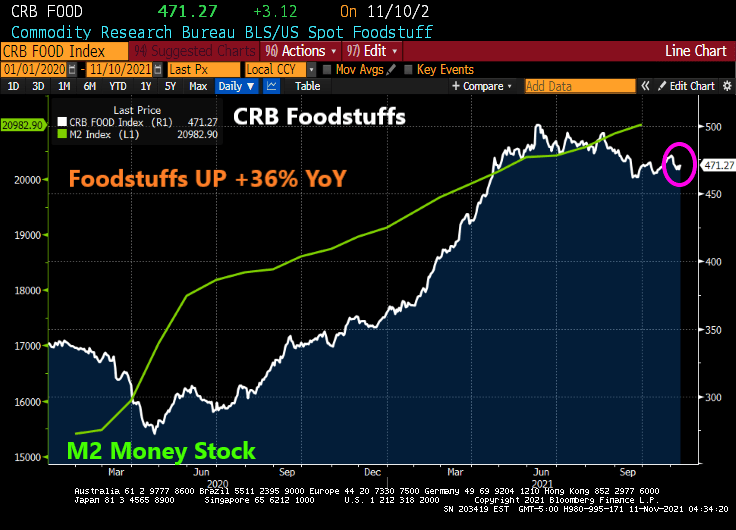
Even if you can find a turkey, prices on foodstuffs in general are up 36% from last year.
And to get to the grandparents’ house of Thanksgiving, gasoline prices (regular) are up 24.5% from last year.
Biden could lower inflation by 1) stop mandating vaccines, 2) stop shutting off energy pipelines and oil exploration, 3) stop spending trillions of dollars other than Social Security, Medicare and defense.
Frankly, Thanksgiving has gotten so expensive due to Biden’s Reign of Error that I am thinking of alternatives to turkey. Like a Jersey Mike’s turkey and provolone sub.
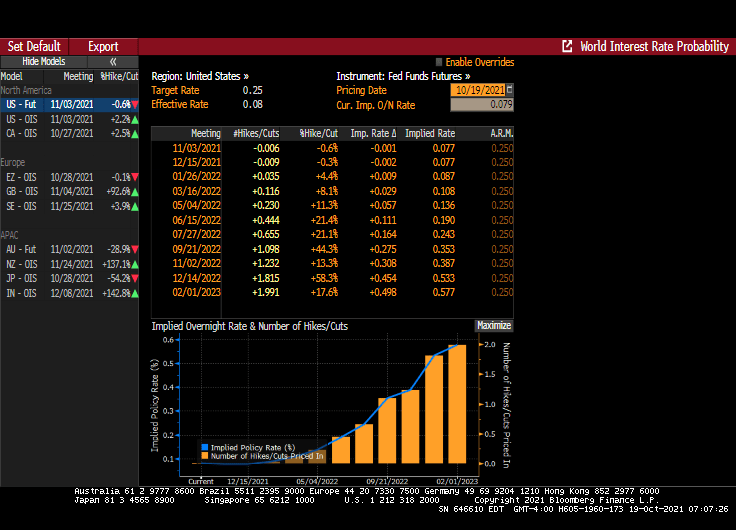
With The Federal Reserve leaving its target rate at 0.25%, but hinting at a tapering (slowdown) of asset purchases, I thought it would be good to present where The Fed sits at the moment.
You can see the rise in the effective Fed Funds rate from 2016 to early 2020, then KABOOM! COVID struck, the effective Fed Funds rate crashed while The Fed dramatically increased their purchases of Treasuries and Agency MBS. Both Treasury and Agency MBS purchases are projected to decline by mid-2022. The Fed’s target rate (purple line) is project to rise to 1% after 2023.
Where SHOULD The Fed Funds Target rate be? How about 8.80% instead of 0.25%.
So we still have over-stimulypto with The Fed projected to raise rates at a snail’s pace.
Face it, Wall Street wants interest rates low, even if inflation burns out of control.
Yes, the US economy has been greatly overstimulated by the Federal government (fiscal stimulus) and The Federal Reserve (monetary stimulus). This has caused inflation that we haven’t seen in a long time.
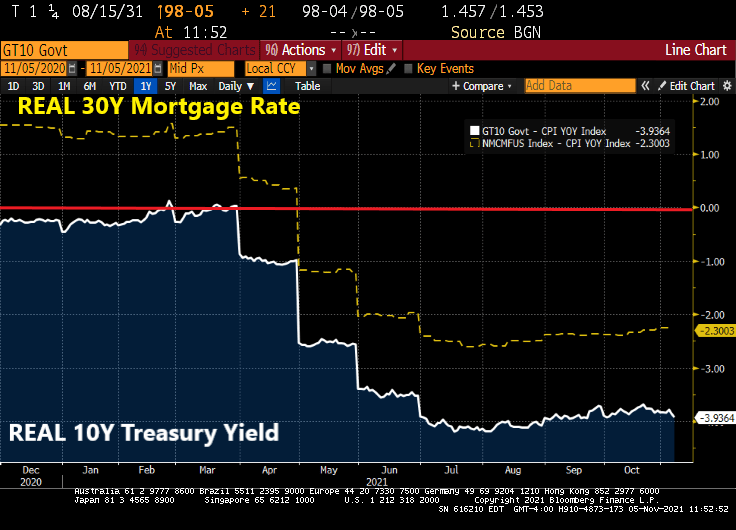
How overstimulated in the economy? The REAL 10-year Treasury yield (nominal less CPI YoY) is now -3.9364% and the 30-year REAL mortgage rate is -2.30%.
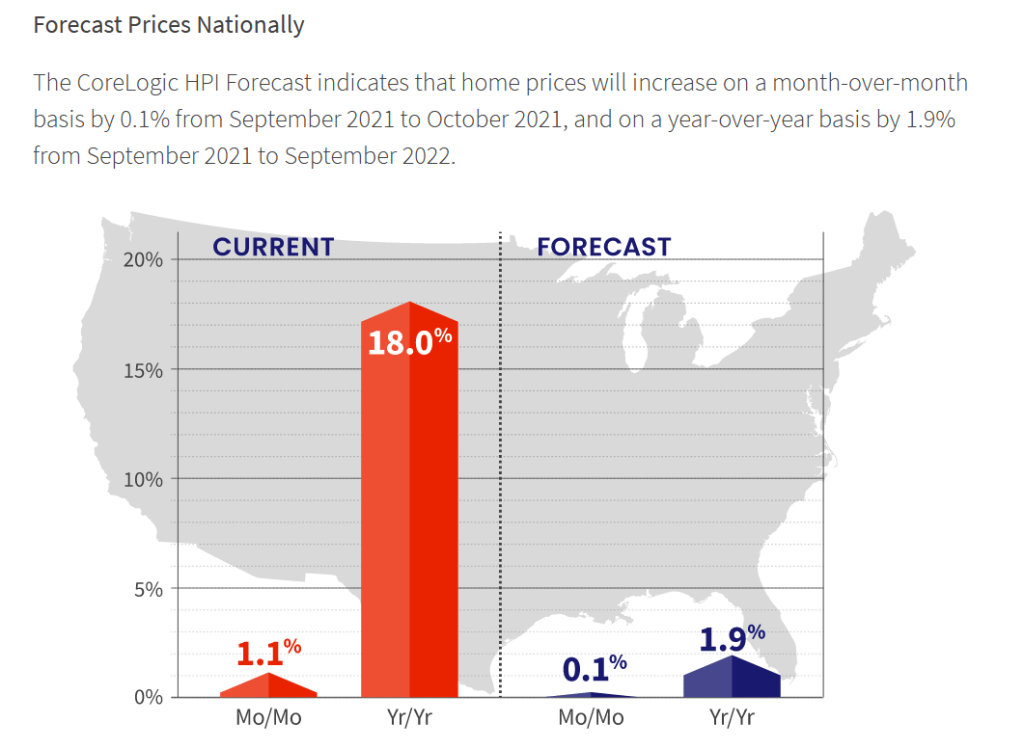
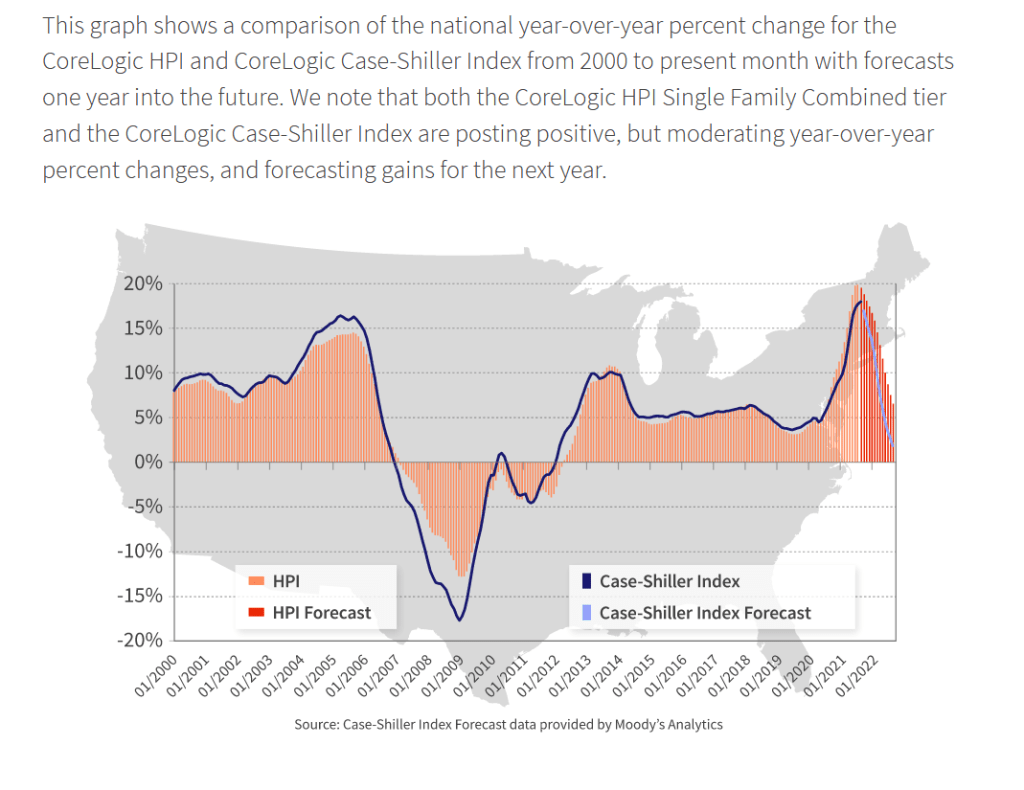
But the forecast for home price growth is for 1.9% YoY in 2022.
As home price growth crashes back to earth as wages don’t keep pace with home prices.
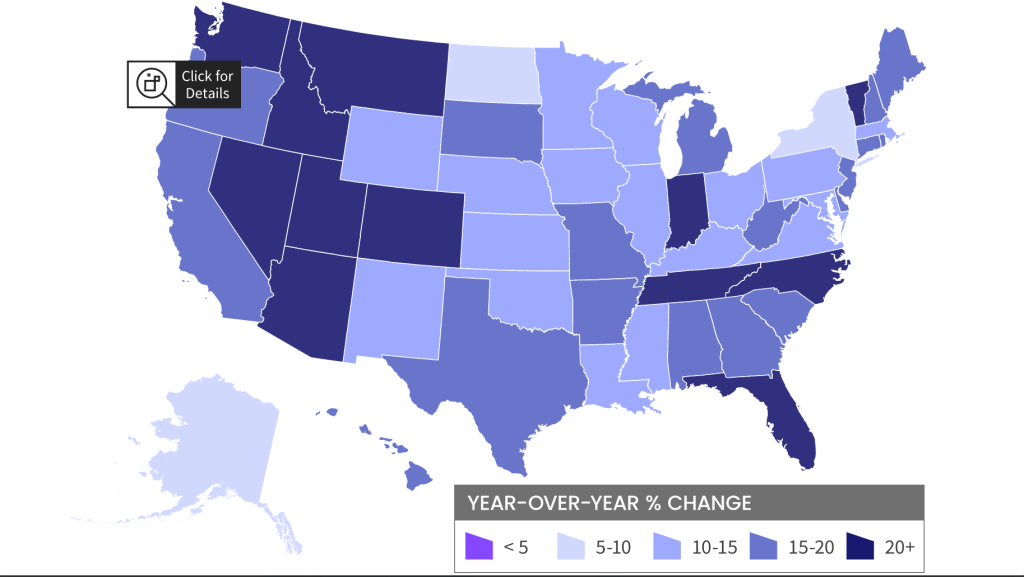
Home prices have been growing in most states out west where The Fed’s money pump has resulted in a boom in second homes and people escaping high tax California and Oregon for Nevada, Idaho, Arizona (again), Utah and Montana. The east coast is seeing the Carolinas booming along with Florida and Indiana. Escape from New York?
Escape from LA … to Arizona, Nevada, Idaho and Utah?
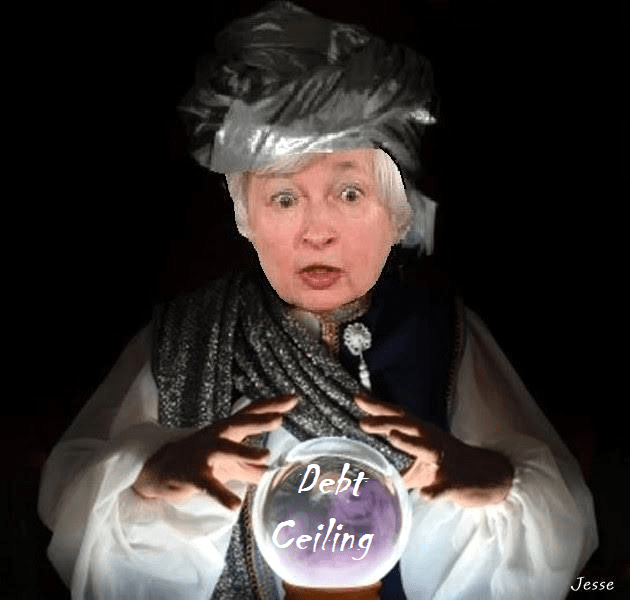
Somewhere over the Alps, T-Sec Janet Yellen is fearmongering over a possible US debt default if Republicans don’t kowtow to Democrat’s desires to raise the debt ceiling.
(Washington ComPost) — SOMEWHERE OVER THE ALPS — Treasury Secretary Janet Yellen on Sunday said Democrats should be willing to approve a fix to the nation’s debt ceiling without GOP support if necessary, an approach senior Democrats ruled out during arecent standoff over the issue.
In an interview aboard a government airplane between Rome and Dublin, Yellen castigated Republicans for refusing to help raise the debt limit but acknowledged Democrats may be able to address the issue without GOP support through the Senate budget procedure known as reconciliation.
Senior Democratic leaders were adamant that the debt ceiling be resolved on a bipartisan basis last month. Senate Republicans have uniformly insisted that Democrats should alone be responsible for raising the nation’s debt limit. Congress probably will face a deadline of Dec. 3 to act, though the exact date is uncertain.
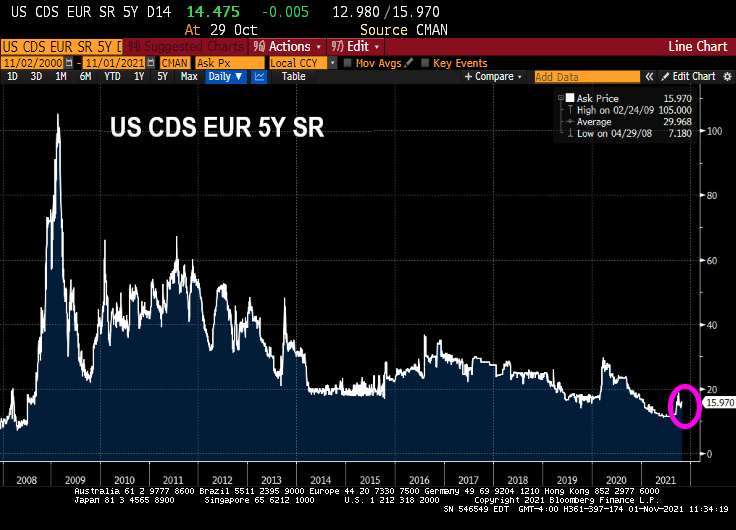
Well, Janet, the market (Credit Default Swaps for US) doesn’t seem to be worried about raising the debt ceiling.
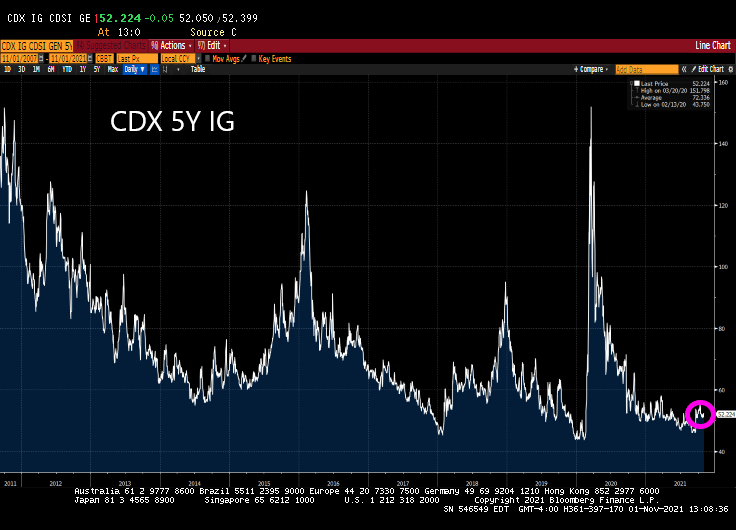
Likewise, the CDX 5Y IG for the US investment grade corporate bonds is near historic lows. Even Yellen can’t make that rise.
Only a career academic and politico Bambina like Janet Yellen would try to drum up agita about a US debt default when Democrats can cram down most anything through “budget reconciliation.”
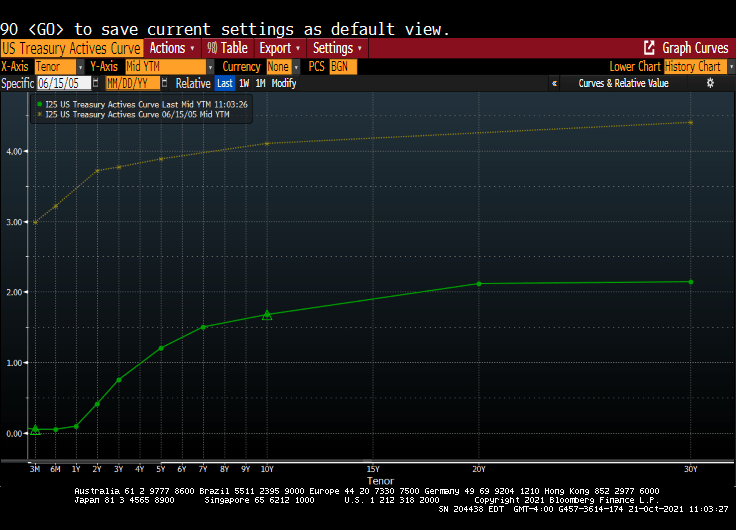
I remember my academic colleague at The Ohio State University (now at Notre Dame), Paul Schultz saying “Why do you find fixed-income and the yield curve interesting?” I have always found the yield curve to be interesting … at least until The Federal Reserve hammered down the short-end with it zero-interest rate policy (ZIRP) and tried manipulating the 10-year Treasury Note yield through Quantitative Easing (QE) meaning The Fed’s purchase of Treasuries and Agency Mortgage-backed Securities (MBS). No, I still think the manipulated yield curve is interesting.
Here is today’s Treasury actives curve (green) versus the yield curve at the peak of the previous housing bubble in 2005 yellow). That is a 300 basis point shift as the short-end. And a 243 basis point shift for the 10-year Treasury Note.
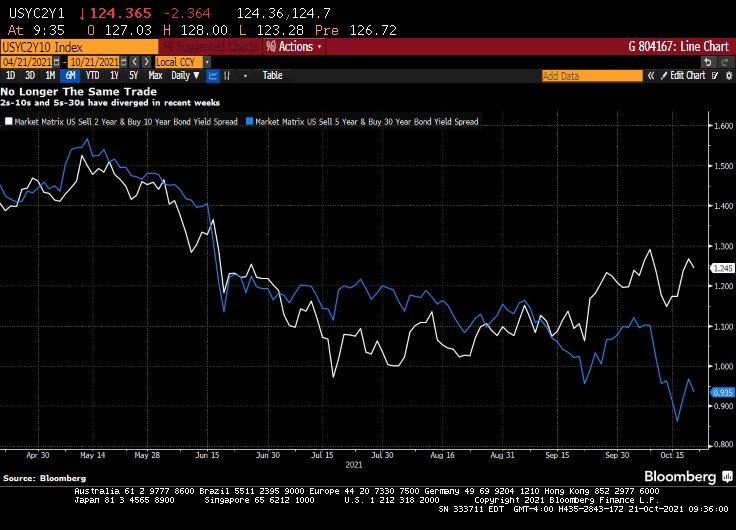
(Bloomberg) — The yield curve is one of the most-powerful forces in the observable financial universe. While much of the price action that we see on a day-to-day basis may be driven by some sort of dark energy, the curve provides a highly visible lodestone indicating the state of policy settings and the likely trajectory of the economy. That being said, the curve is often misunderstood — a bear flattening often produces plenty of hand-wringing, when it’s the bull steepening that you should really worry about. In fact, referring to “the curve” itself is something of a misnomer — while different iterations of the yield curve often travel in tandem, sometimes their paths diverge. That has been the case recently, though perhaps not for much longer. The recent rise in two-year yields looks more than justified, as various fixed income models demonstrate in a roundabout way.
For the past year and a half or so, most of the focus on the yield curve in this column has been on the 5s-30s iteration. The rationale for this has been relatively straightforward: With the Fed funds rate locked in near zero for the foreseeable future, the two-year note has been moribund. As such, 2s-10s has really just been another articulation of the 10-year yield. And much like recent price action vis-a-vis my 10-year model, the curve briefly traded where it “ought” to in March before once again becoming too flat in recent months.
At least 5s-30s has had the benefit of containing a useful forward-looking component on both legs of the spread. Yet even as I type that, it is interesting to note that 2s-10s and 5s-30s exhibited virtually identical price action at virtually identical levels earlier this year. While they remain positively correlated, of course, a clear wedge has emerged between the two curves as five-year yields have broken decisively through 1%, pricing greater conviction that a monetary tightening cycle will fully emerge over the next half-decade.
Yet I am left to wonder about the two-year note. The eurodollar strip is pricing that the bulk of monetary tightening will come by the end of 2023, a period that’s now largely captured by the shortest-maturity coupon security. To be sure, the appropriate level for 2s is a function not only of the ultimate magnitude of monetary tightening, but when it begins. After all, a 150 bp hike in Q4 of 2023 carries very different implications for the current two-year note than a 25 bp rate rise every three months from Q3 of next year onwards.
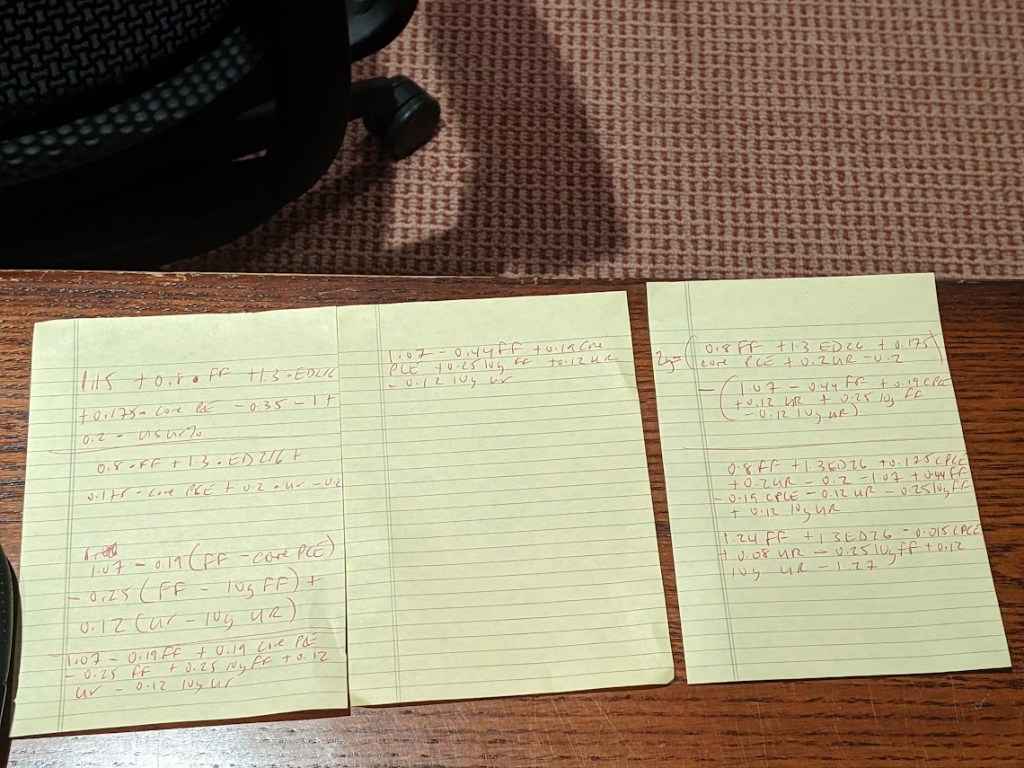
It occurred to me that I could back out a model for two-year yields by simply subtracting the output of my yield curve model from that of the 10-year model. I had no real idea of what to expect from this exercise, but even with the proviso that short-end yields rarely stray too far from the policy rate, I was pleasantly surprised at how close the fit is from this “derivative” model for the two-year.
The question then arose, naturally, of what actually went into the calculation of this “model.” After all, knowing the formulae of the two constituent models — for the 10-year and the yield curve– should allow for the distillation of a separate equation for the two-year note. Because that sort of thing is more fun than unpacking more boxes, that’s how I spent a few minutes on Wednesday night. The outcome isn’t necessarily an optimal model for the two-year, but more of an accidental one.
A bit of high school algebra
For what it’s worth, the resultant formula is 2y = 1.24 * FDTR + 1.3 * (ED2 – ED6) -0.015 PCE CYOY + 0.08 * USURTOT – 0.25 * (10y average of FDTR) + 0.12 * (10y average of USURTOT) – 1.27. I am pretty sure that one could get similar results with a simpler framework; the notion that a 2% rise in core inflation is worth just 3 bps on the two-year yield, all else being equal, leaves me simultaneously amused and bemused.
What does seem evident, however, is that henceforth there is going to be considerably more signal generated from two-year yields than has been the case in recent quarters. As such, 2s-10s are going to be worth following again, just as much if not more than 5s-30s. Both nominal yields and the curves are clearly constrained by the notion that all of this inflation kerfuffle really is transitory at its heart, and that, with r* remaining in the gutter, the long-run lid on nominal policy rates is going to be extraordinarily low.
That’s probably as good a null hypothesis as any, and possibly better than most. That being said, if we’re still having a lot of the same inflation conversations a year from now, we’re gonna need a long hard think about whether some of the post-GFC lessons need to be unlearned. In the meantime, at least fixed income is interesting again. I wonder where the yield curve and the model will eventually meet up to shake hands again… -Cameron Crise
The yield curve will become more interesting if Powell and The Gang take their foot off the monetary accelerator pedal.
Yes, the super-heated housing market is showing signs of slowing down.
According to the Mortgage Bankers Association (MBA), mortgage purchase applications rose 1.87% from the previous week. However, purchase applications are down 10% from the same week last year.
Refinancing applications dropped -.48% from the previous week as the 30-year mortgage contract rate rose from 3.14% to 3.18%. Refi apps are up 6% from the same week last year.
As rates begin to rise, mortgage refi applications will decline.
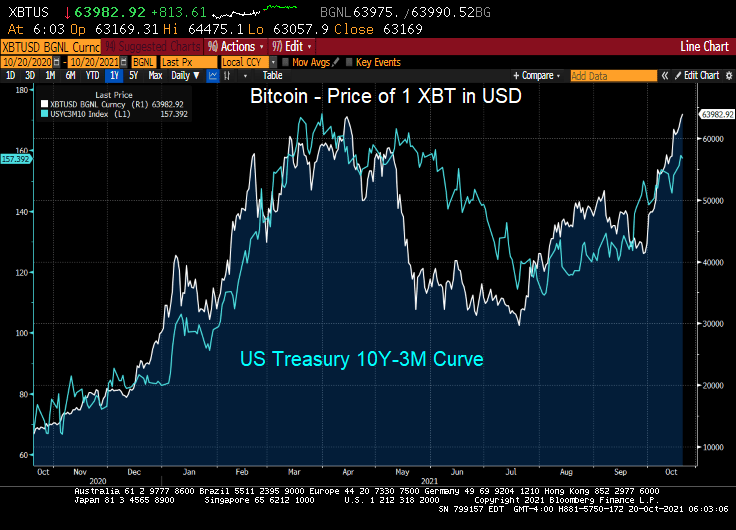
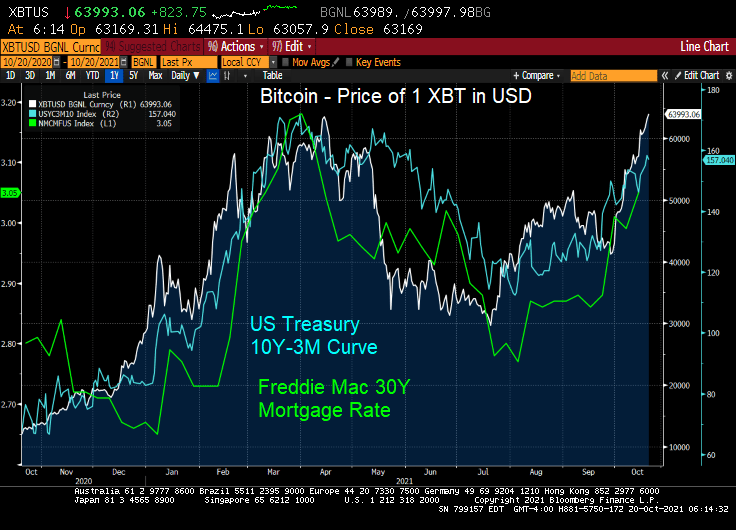
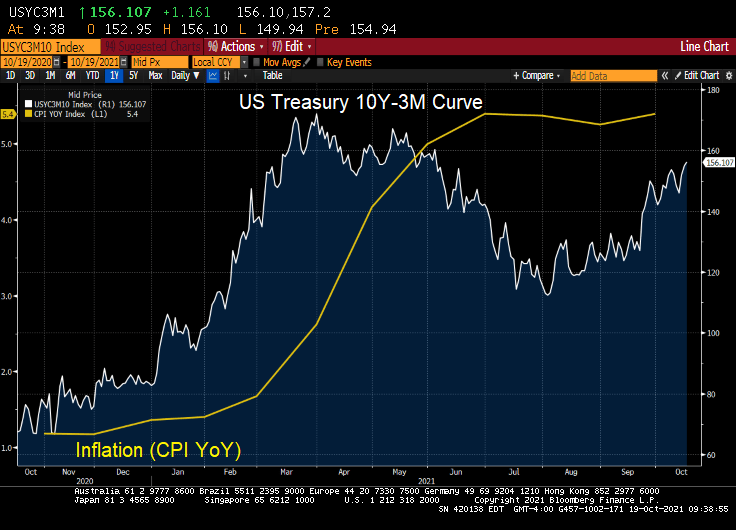
I have no idea why Jack Dorsey tweeted “705742.” But I do know that Bitcoin hit 63,982.92 this morning as the US 10Y-3M curve has been steepening.
Since the 3-month Treasury yield has been repressed to near zero, the 10Y-3M curve is pointing to rising 10-year yields. Which likely means that 30-year mortgage rates will be rising too.
UPDATE! Bitcoin hits 66,615 as Proshares Bitcoin Strategy E rises as well.


You must be logged in to post a comment.