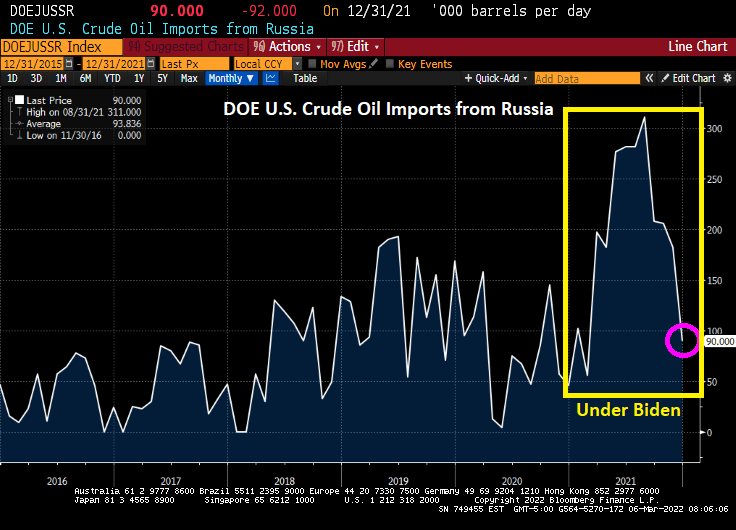
Russia is still engaged in its invasion of Ukraine. And the US continues to import crude oil from Russia. In fact, US crude oil imports from Russia soared under Biden only to decline again in December 2021.
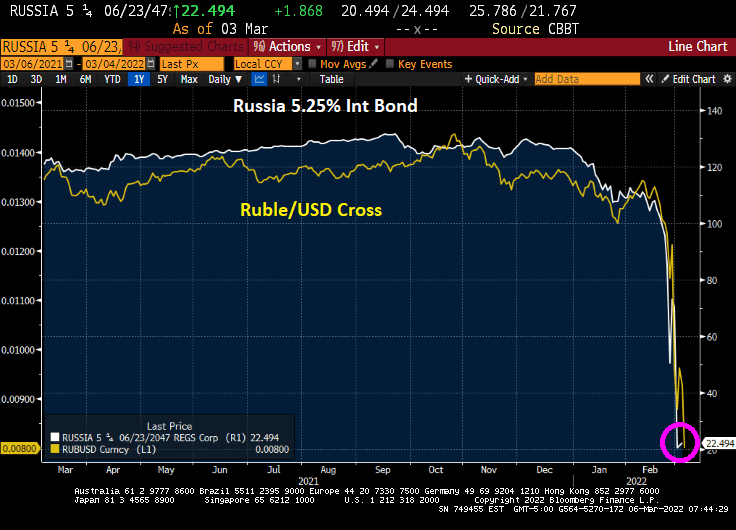
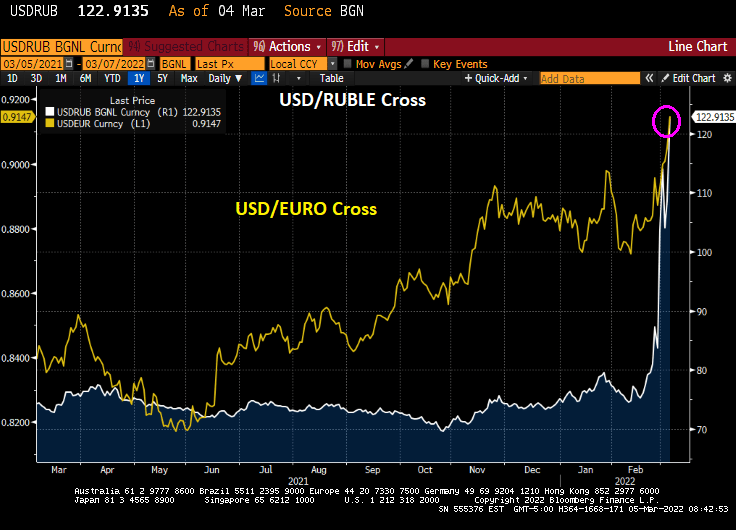
On the sovereign bond and currency front, the 5.25% coupon Russian international sovereign bond has crashed to 22.494. And the Ruble/USD cross has crashed as well.
Sberbank Bank 5 1/8% corporate bond has crashed to 25.
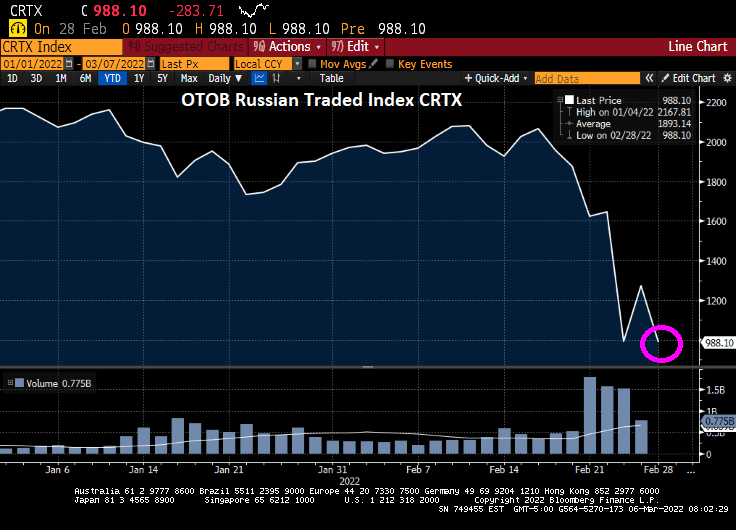
The Russian blue-chip stock market (OTOB Russian Traded Index CRTX) has crashed by over 50% since the invasion of Ukraine.
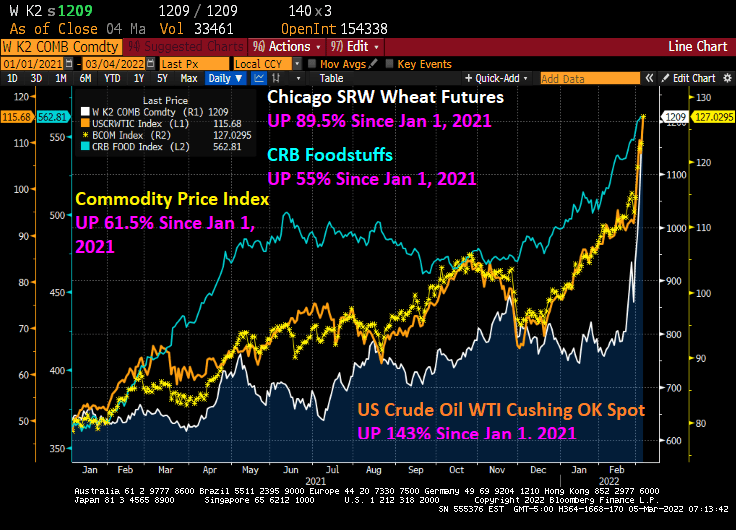
Fortunately, I like Cheerios for breakfast made from oats, since wheat futures are soaring.
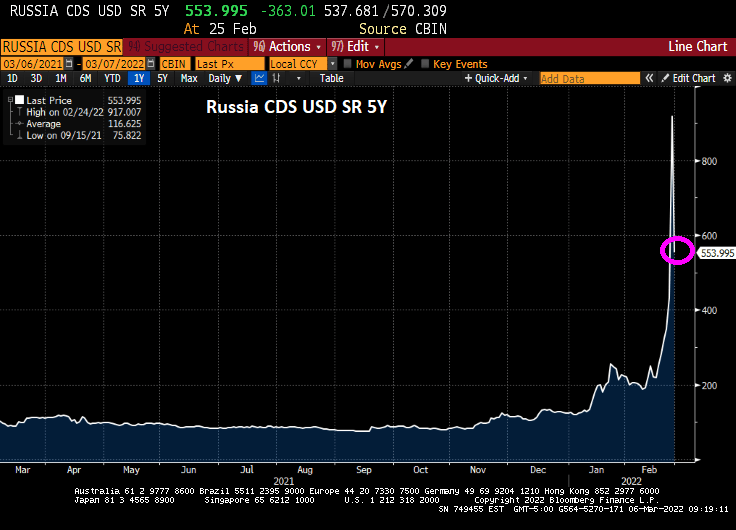
Russia’s Credit Default Swap (CDS) 5Y has dropped to a still-elevated 554.
The US really needs to ban Russian crude oil imports, since Biden’s failed in game theory by cutting US energy exploration on Federal lands and offshore drilling.
War is hell, as Vlad “The Ukrainian Impaler” Putin has demonstrated.
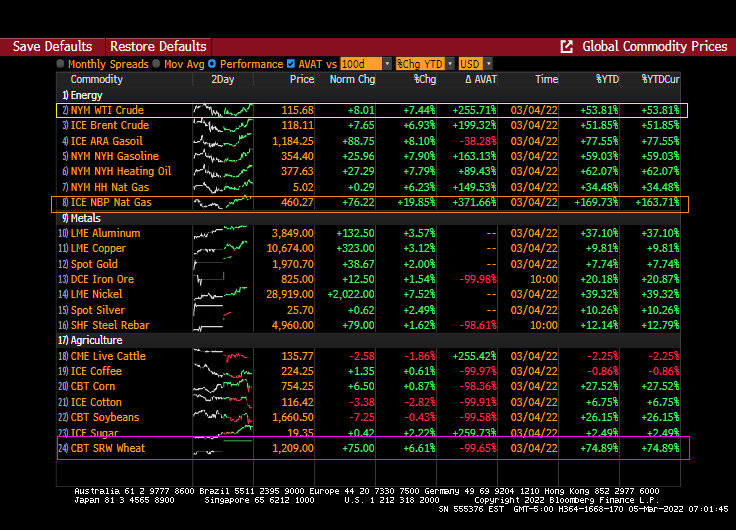
This has been a brutal week for consumers. With the Russia/Ukraine conflict raging and Congress seems determined to not allow for additional oil and gas production, and Biden’s anti-fossil fuel edicts still in place, we are seeing dramatic price increases in wheat (UP 89.5% since January 1, 2021), WTI Crude (UP 143% since January 1, 2021), and food stuffs (UP 55% since January 1, 2021).
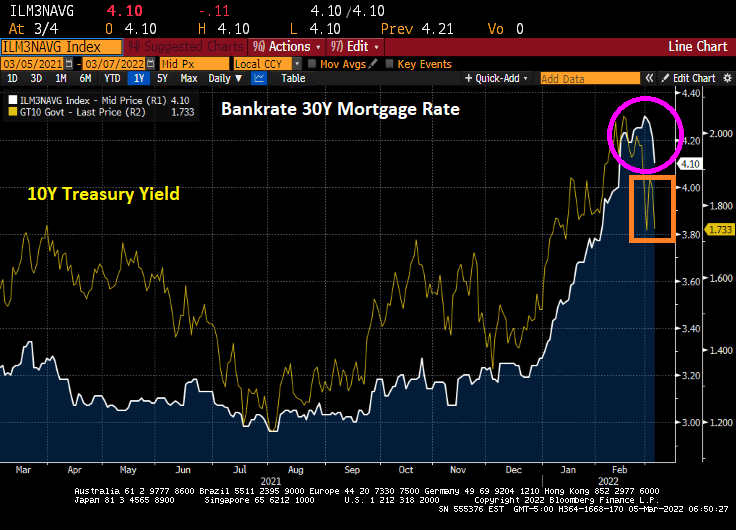
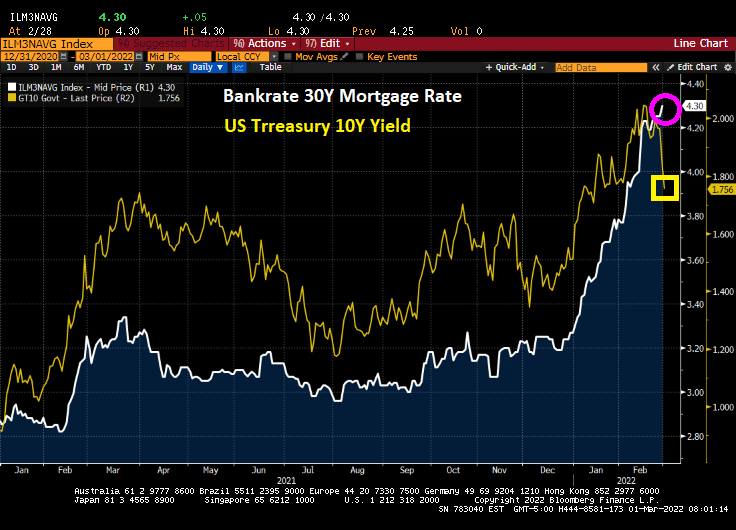
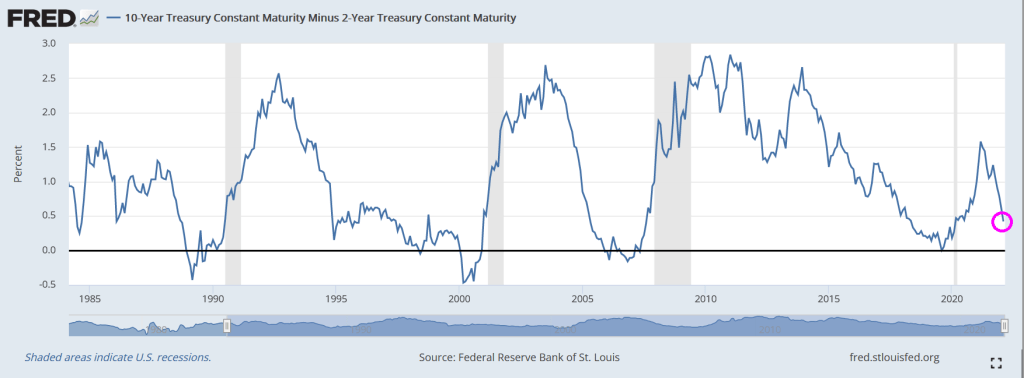
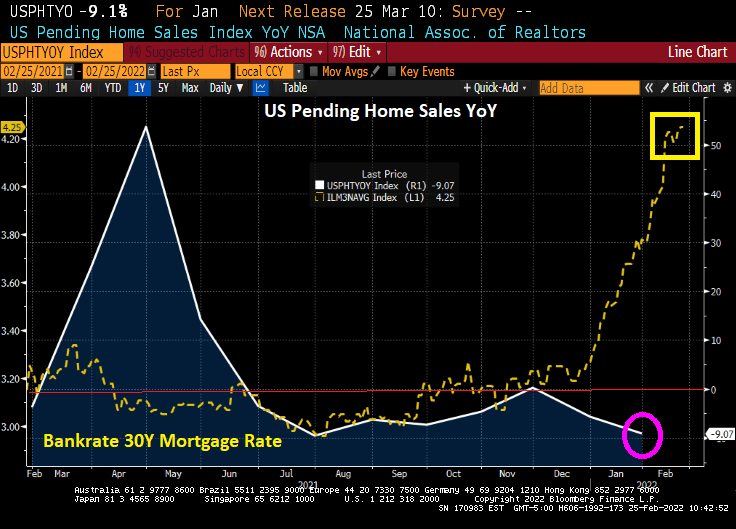
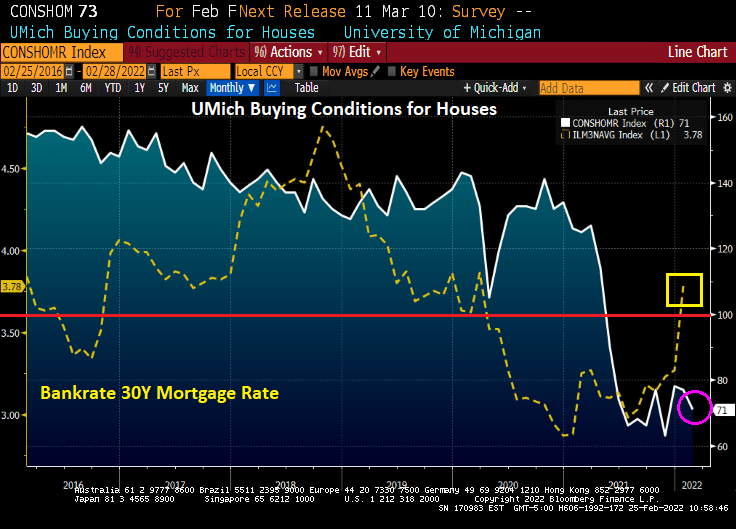
Bankrate’s 30-year mortgage rate has actually been falling the last several days, which is good for prospective home buyers as the 10-year US Treasury Note yield has been declining.
The USD/Russian Ruble cross is skyrocketing and the USD/Euro is doing likewise. Russians visiting the US will find that their trip is suddenly unaffordable (as do many American citizens will its rampant inflation). As Bruce Willis said in “Die Hard,” “Welcome to the party, pal.”
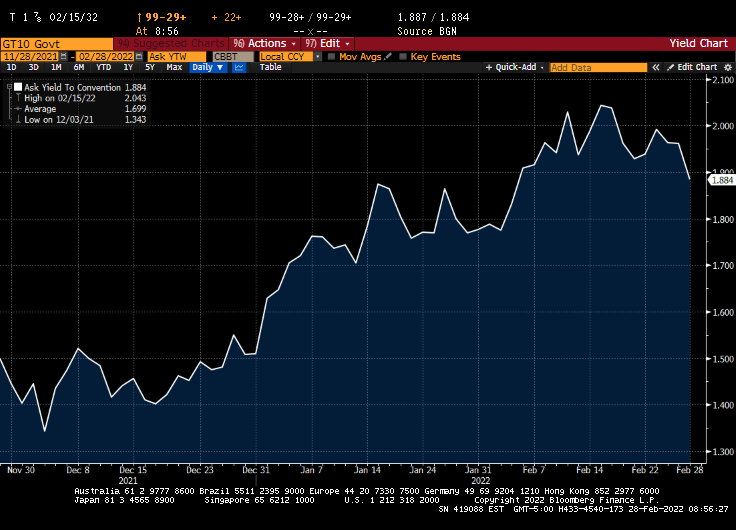
On Friday, the US Treasury 10-year yield declined 11 bps.
And energy prices continue to soar, particularly UK Natural Gas Futures that rose 19.85% overnight.
The US inflation data will be released on March 10th and the consensus is that February CPI inflation will rise to 7.9% YoY.
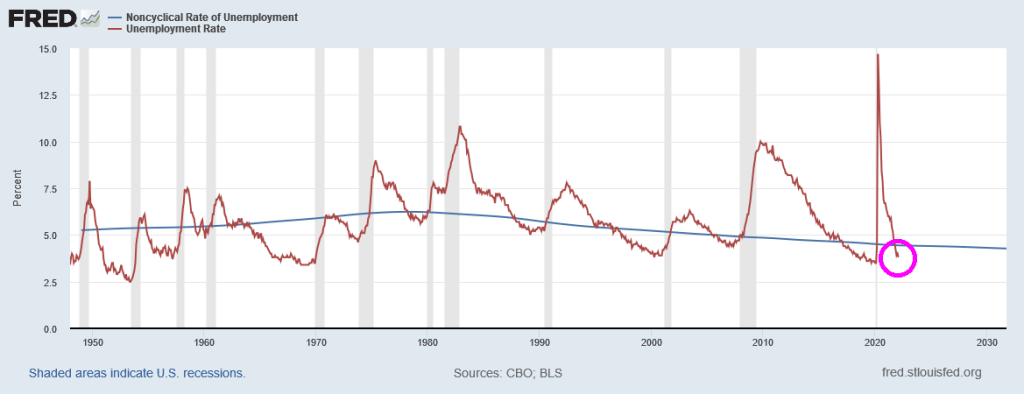
But even the latest unemployment rate report (3.8%) is signalling that The Fed should be raising interest rates since it is lower than the Natural Rate of Unemployment or NAIRU (4.44%).
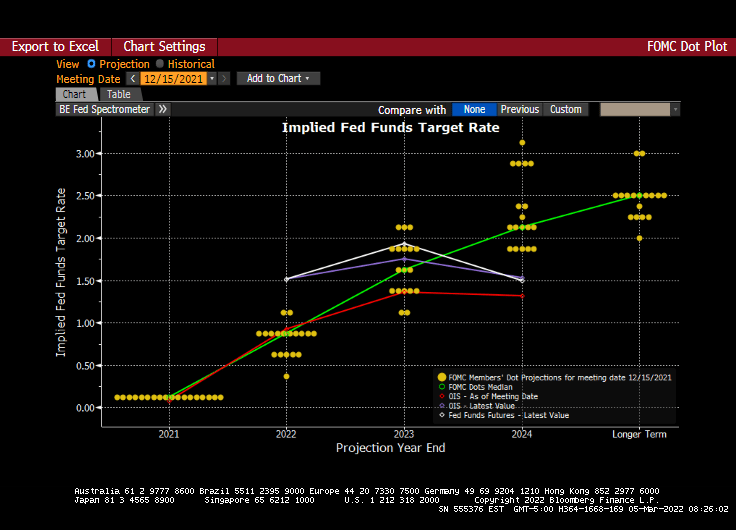
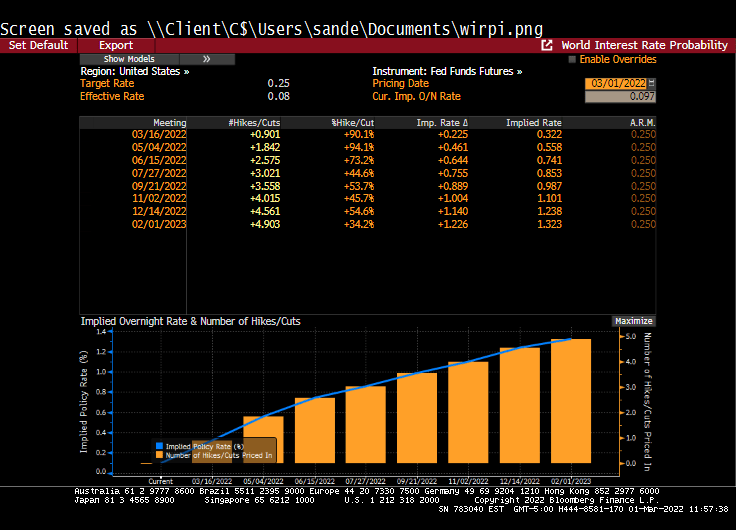
And we have the next Fed policy error on March 16th. The Fed dots plot looks like the glide slope for an aircraft, but the message is that rates will be going up at future meetings.
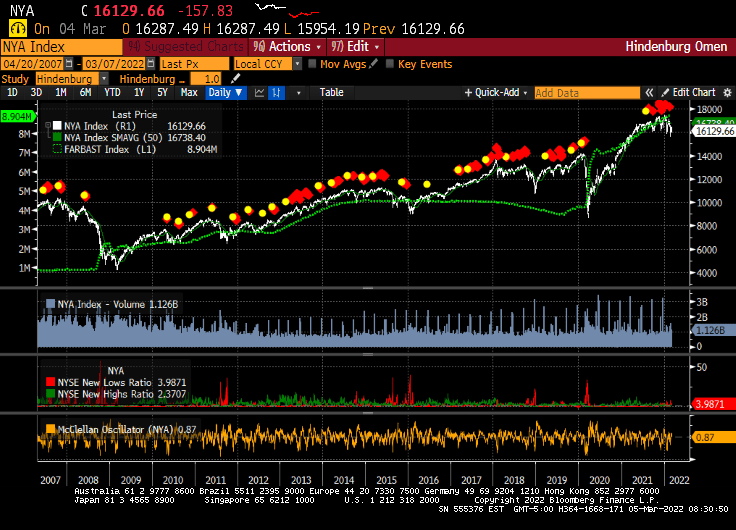
And just for amusement, I present to you the infamous Hindenburg Omen chart that forecast the 2008/2009 stock market correction. Since that correction, the Hindenburg Omen has been flashing “danger” but the only correction was the COVID-linked correction of early 2020. While the Hindenburg Omen is flashing red right now, The Federal Reserve’s balance sheet (green line) has protected against market corrections. Let’s see what happens if and when The Fed decides to remove the epic monetary stimulus.
Its anyone’s guess as to whether The Fed will actually tighten monetary policy.
Despite crude oil, natural gas and gasoline price skyrocketing, House Speaker Nancy Pelosi proclaimed that
“The president has already talked about releasing oil from the — the st– as he already has done from the (slurred, inarticulate). And (slurred, inarticulate) I’m not for drilling on public lands.”
Well, if President Biden rescinded his executive order on drilling, pipelines, etc., we would see a reduction in energy prices AND inflation. But between Biden’s anti-fossil fuel orders and the Russia-Ukraine conflict, we can see that the WTI Cushing crude oil spot price has risen from $47 per barrel in early January 2021 to $112.05 today. That is over a doubling of crude oil prices.
Energy prices are up across the board, particularly gasoil, heating oil and coal.
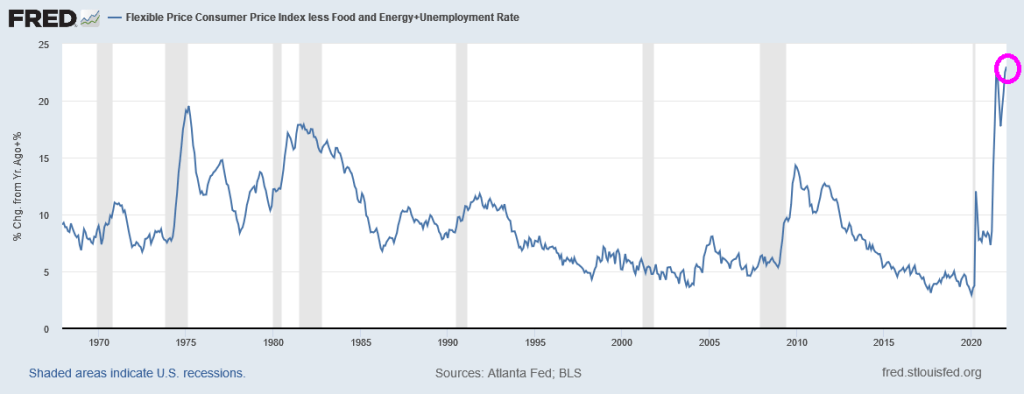
If we use the core Flexible Price Index as a measure of inflation, we can see that Americans are the most miserable in modern history (Core Flexibe CPI + U-3 Employment rate).
UPDATE! House Republicans introduced the “American Independence from Russian Energy Act” on Feb. 28, a measure meant to authorize the Keystone XL pipeline, boost domestic oil and gas production, and prevent President Joe Biden’s executive branch agencies from halting energy leasing on federal land and water, among other provisions. Yet on March 1, the legislation was shot down by Democrats in a 221–202 vote, almost entirely along partisan lines.
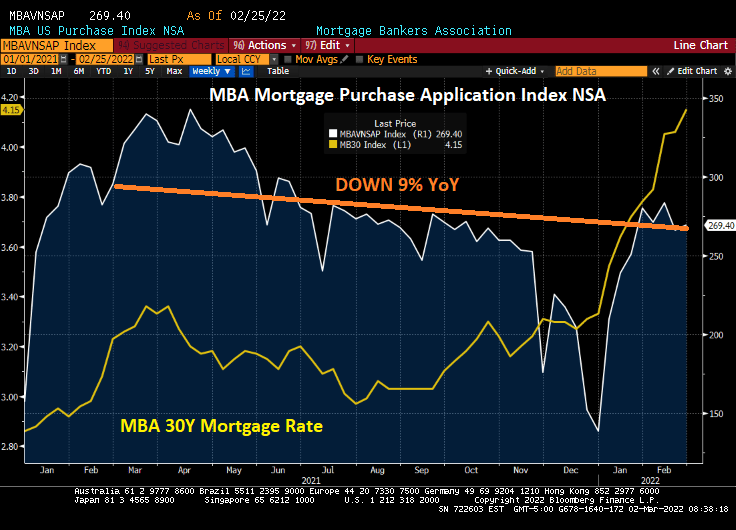
While Corelogic’s January home price index was hot, hot, hot (UP 19.1% YoY), today’s mortgage applications index for the week ending February 25, 2022 was not, not, not.
Mortgage applications decreased 0.71 percent from one week earlier, according to data from the Mortgage Bankers Association’s (MBA) Weekly Mortgage Applications Survey for the week ending February 25, 2022.
The seasonally adjusted Purchase Index decreased 1.76 percent from one week earlier. The unadjusted Purchase Index increased 1.16 percent compared with the previous week and was 9 percent lower than the same week one year ago.
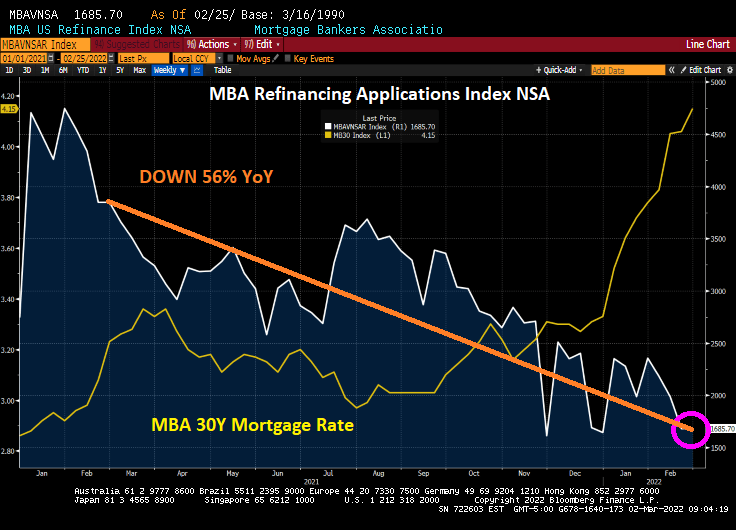
The Refinance Index increased 1 percent from the previous week and was 56 percent lower than the same week one year ago.
Yes, the mortgage industry is going through some difficult times. But not as difficult as trying to understand Biden’s State of the Union address: “Putin may circle Kyiv with tanks, but he’ll never gain the hearts and souls of the Iranian people.” Huh?
And then Biden’s closing remark was “Go get ’em!” What? Go get whom? The Russians? Inflation? Trump supporters?? I feel like Biden thought the SOTU was the annual Army-Navy football game.
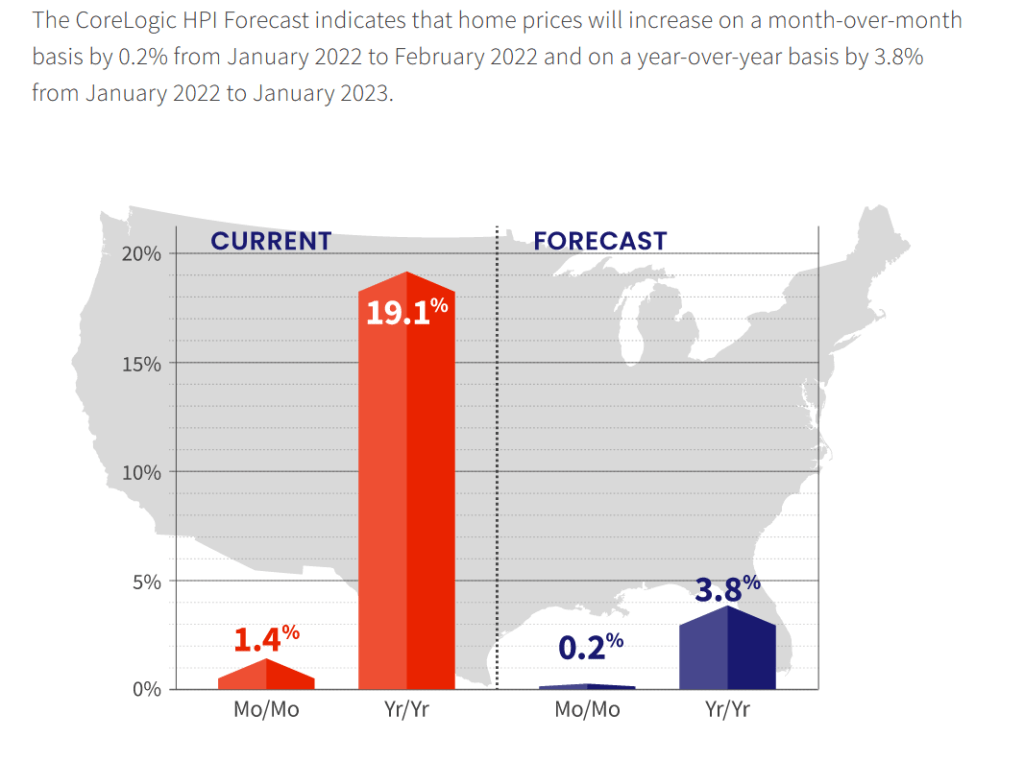
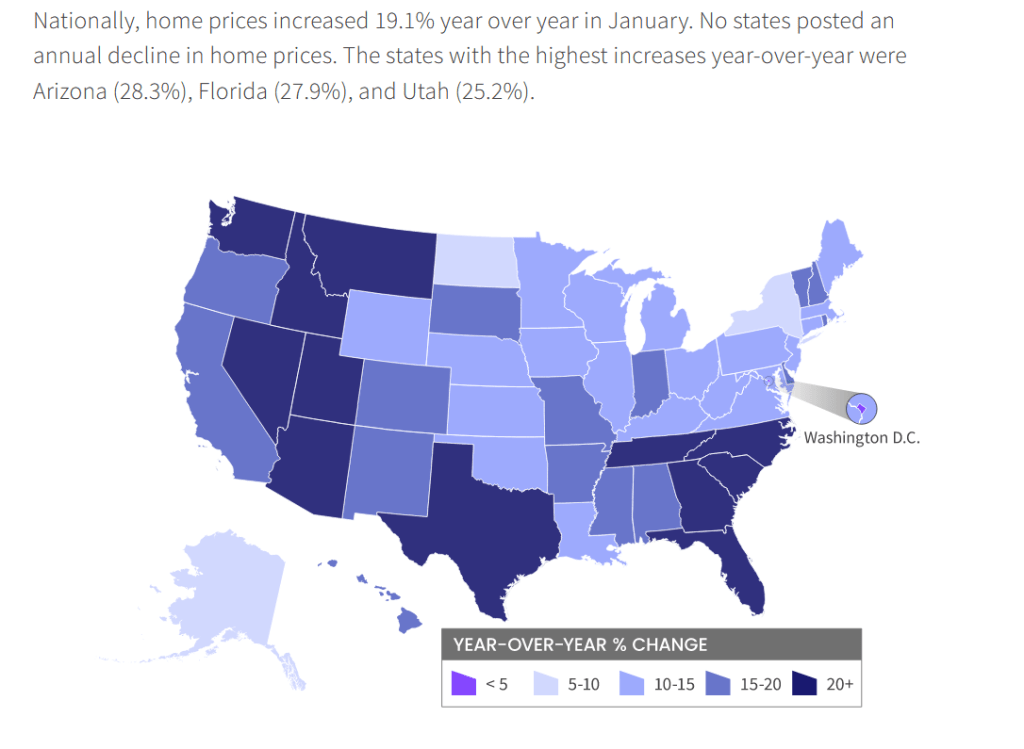
Home prices nationwide, including distressed sales, increased year over year by 19.1% in January 2022 compared with January 2021. On a month-over-month basis, home prices increased by 1.4% in January 2022 compared with December 2021 (revisions with public records data are standard, and to ensure accuracy, CoreLogic incorporates the newly released public data to provide updated results).
But Corelogic is still forecasting only 3.8% YoY growth in 2022.
Home prices are hot, hot, hot in all states except North Dakota and New York. The fastest growing states are lower taxes, higher growth states.
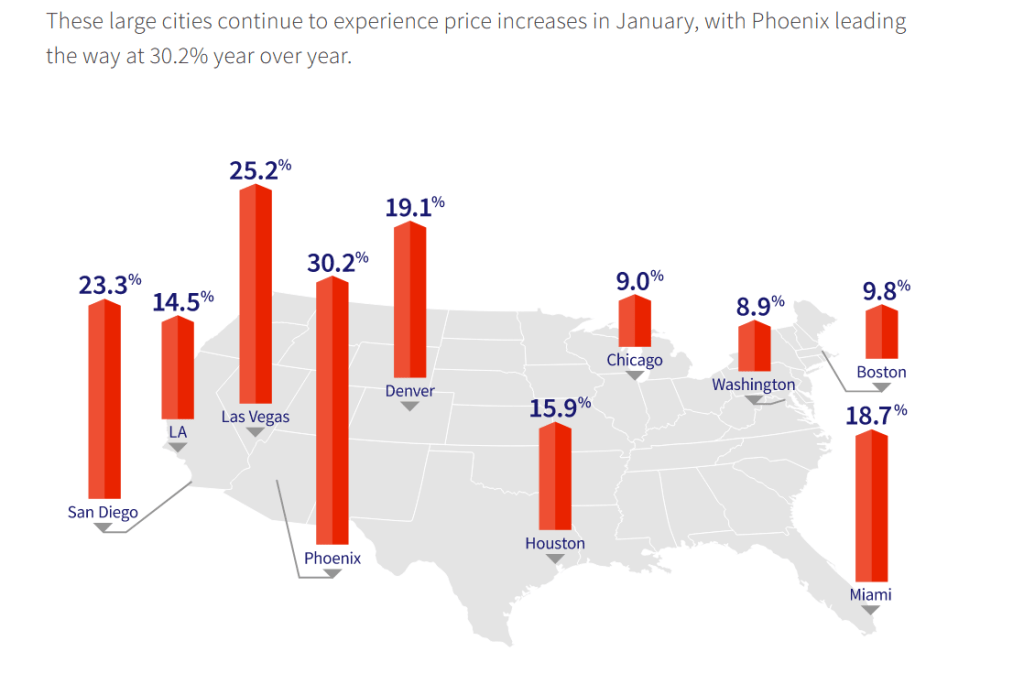
Phoenix, Las Vegas and San Diego are booming. But Chicago and Washington DC are growing at near 9% YoY.
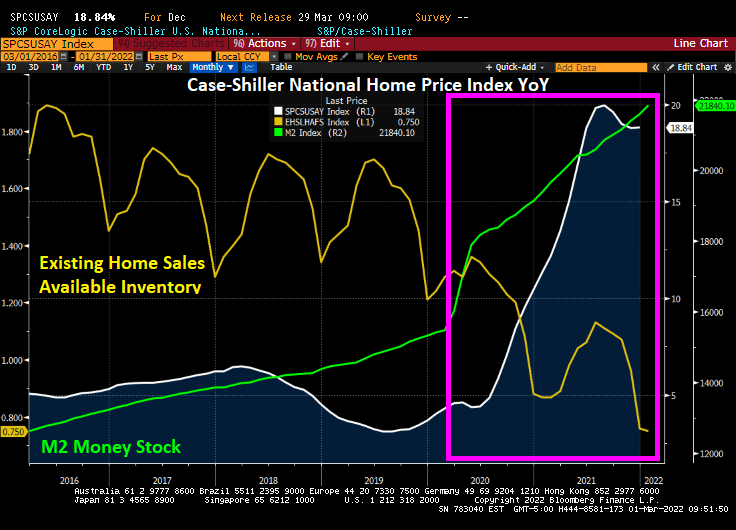
Case-Shiller’s December report show home prices growing at 18.84% YoY thanks to Fed stimulypto and historic low inventory of homes available for sale.
As someone who needs to move to Ohio, I would really appreciate it if mortgage rates would more closely follow the 10-year Treasury yield. But alas, Bankrate’s 30-year mortgage rate just rose to 4.30% as the US Treasury 10-year yield dropped -8.2 basis points.
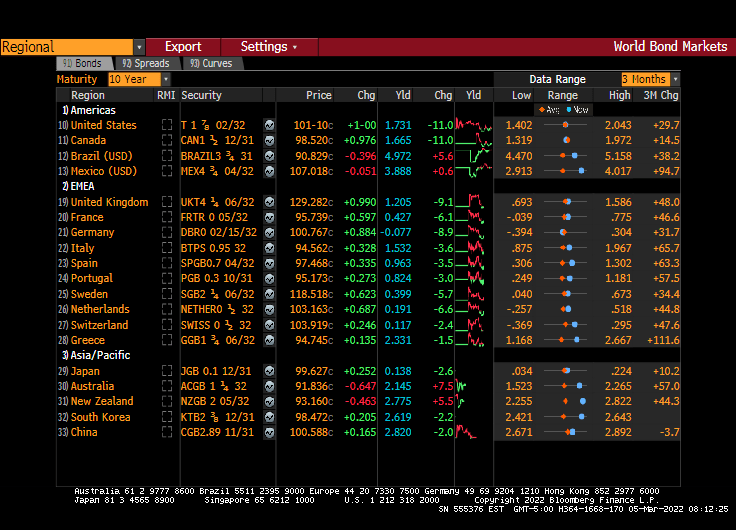
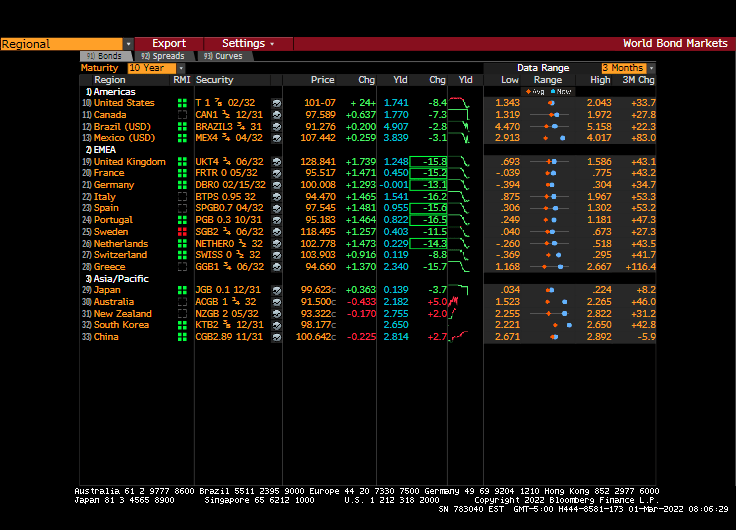
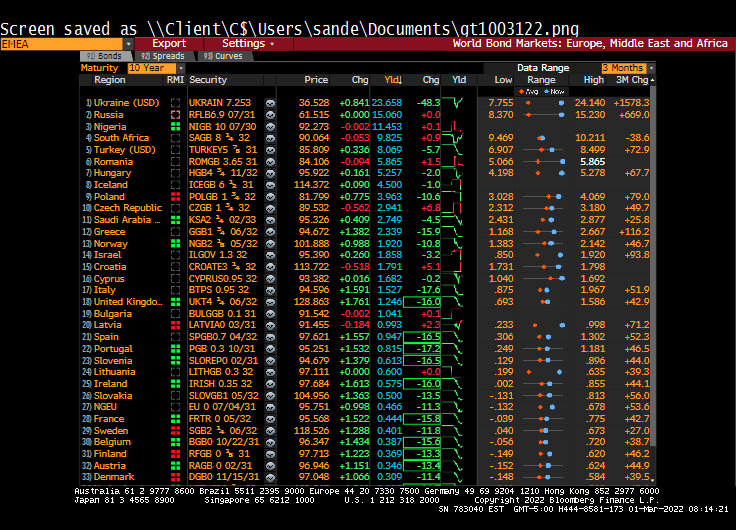
Europe. Middle East and Africa (EMEA) sovereign yields are all down over 10 basis points averaging around -15 bps.
Ukraine’s 10-year yield has plummeted by -48.3 bps this morning.
The anticipated meeting between Russia and Ukraine on Belarus soil was a failure. Likely due to Belarus showing-off their modern air force capabilities.
The U.S. merchandise-trade deficit unexpectedly widened in January to an all-time high, reflecting a record value of imports and a drop in shipments overseas.
The shortfall grew to $107.6 billion last month from $100.5 billion in December, according to Commerce Department data released Monday.
Meanwhile, the US Treasury 10Y yield fell to 1.884%.
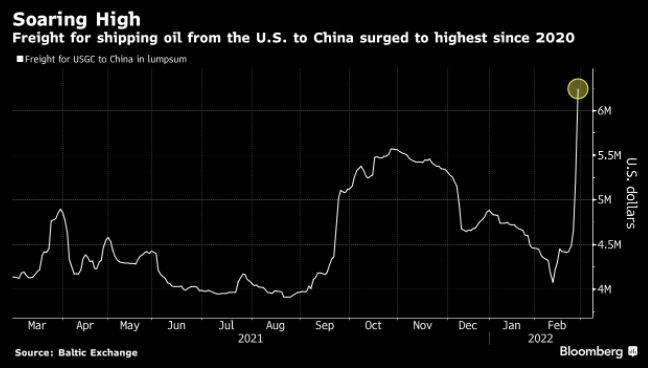
The cost for shipping from the US to China has surged.
Meanwhile, the Russian Ruble is getting clobbered.
At least Putin hasn’t put himself on Russian currency … yet. Or nyet.
Russia is still attacking Ukraine and I am still seeing stories about actor/comedian Bob Saget’s cause of death. So now for something completely different.
And this doesn’t include the inflation in prices caused by the Russian invasion of Ukraine. Yet.
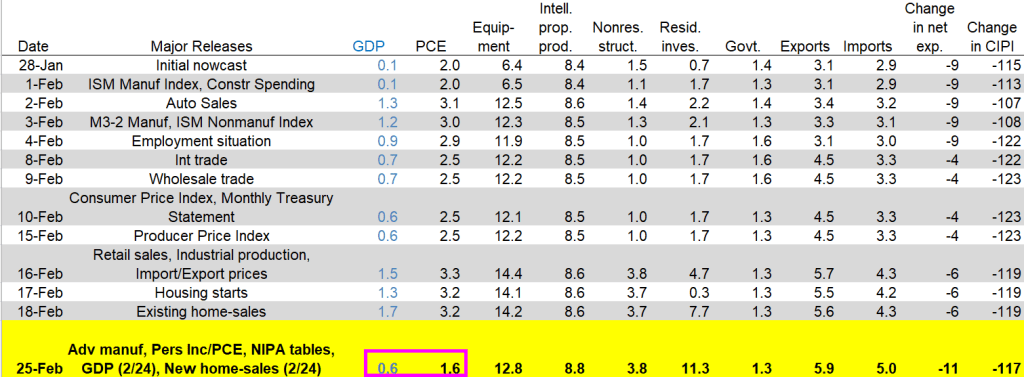
US Personal Consumption Expenditures (PCE) price index rose by 5.2% in January, the fastest rate since mid-1983.
With CPI inflation at 7.5% YoY, the Taylor Rule suggests a Fed Funds target rate of 13.35%, higher than the current rate of 0.25%. Overstimulated much??


You must be logged in to post a comment.