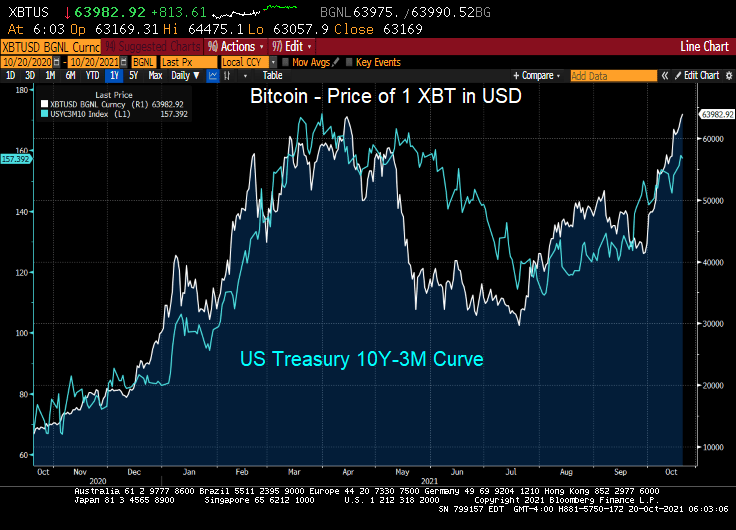
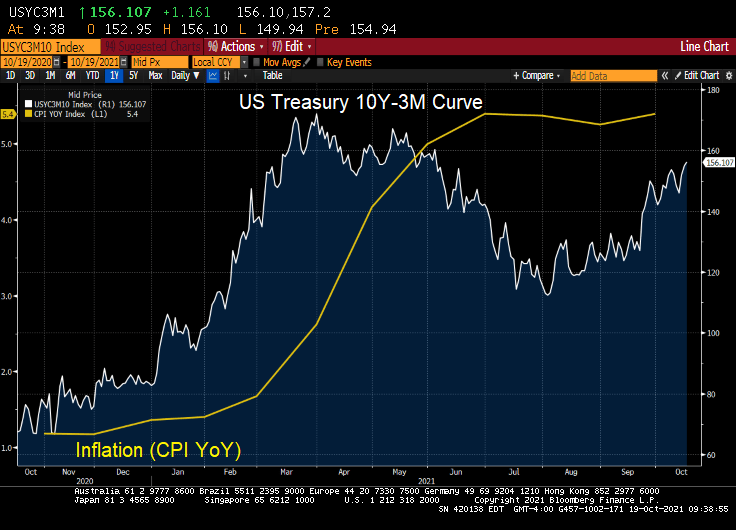
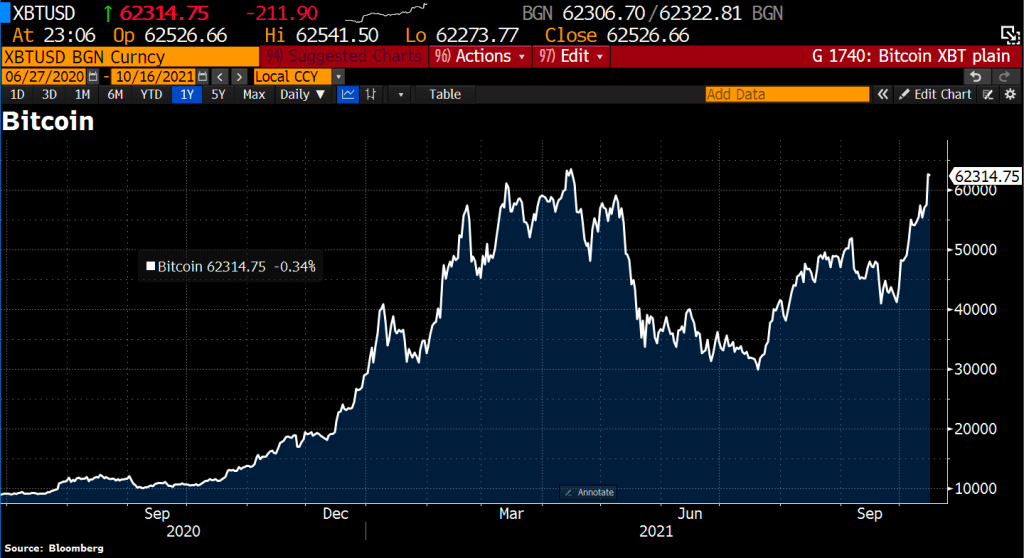
I have no idea why Jack Dorsey tweeted “705742.” But I do know that Bitcoin hit 63,982.92 this morning as the US 10Y-3M curve has been steepening.
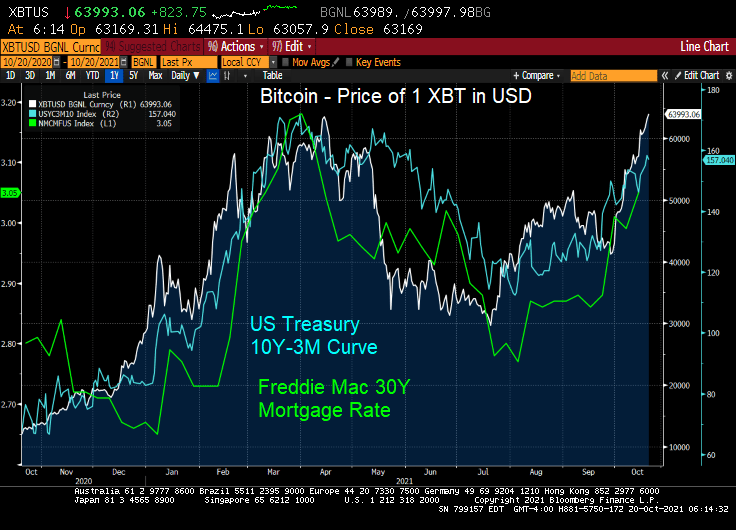
Since the 3-month Treasury yield has been repressed to near zero, the 10Y-3M curve is pointing to rising 10-year yields. Which likely means that 30-year mortgage rates will be rising too.
UPDATE! Bitcoin hits 66,615 as Proshares Bitcoin Strategy E rises as well.
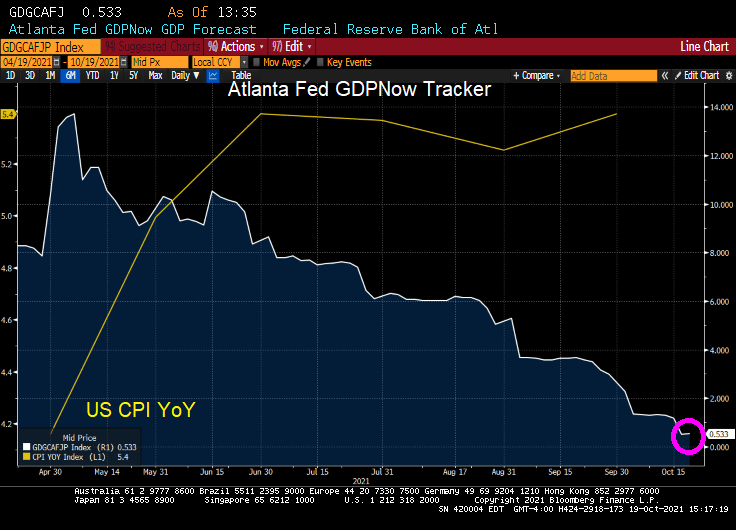
The Atlanta Fed’s GDPNow model estimate for real GDP growth (seasonally adjusted annual rate) in the third quarter of 2021 is 0.5percent on October 19, down from 1.2 percent on October 15. After recent releases from the US Census Bureau and the Federal Reserve Board of Governors, the nowcasts of third-quarter real personal consumption expenditures growth and third-quarter real gross private domestic investment growth decreased from 0.9 percent and 10.6 percent, respectively, to 0.4 percent and 8.4 percent, respectively.
US real GDP nosedived to 0.5% according to the Atlanta Fed GDPNow real-time tracker.
Again, The Fed and Federal government pumped trillions of stimulus into an unprepared economy resulting in massive bottlenecks. So, we are getting declining GDP and rising inflation.
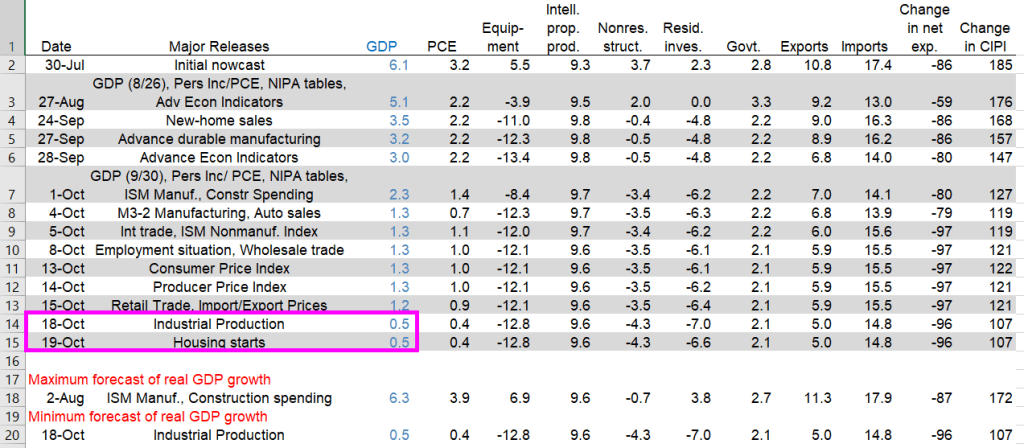
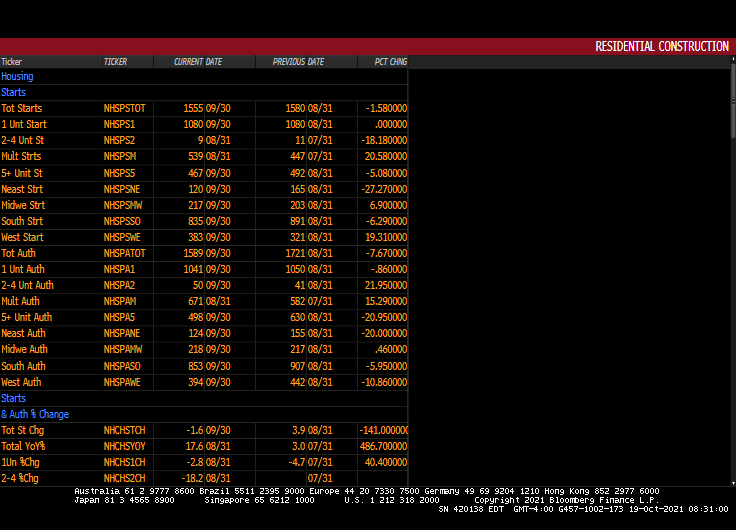
Yesterday’s industrial production dove leading to the 0.5% GDP figure. Today’s housing starts didn’t impact GDP in a meaningful way.
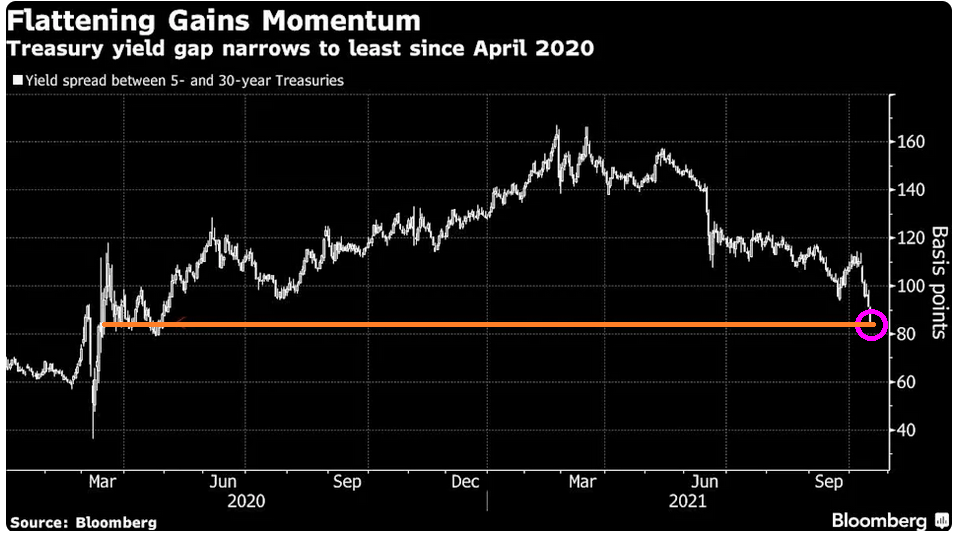
The US Treasury yield curve has flattened to almost pre-Covid levels, signalling fear of inflation. And given our bottlenecked economy that The Fed and Federal government seem not to understand (or care), the flattening signals a wild ride ahead.
The Treasury yield curve flattened sharply Monday as surging energy prices stoked inflation fears and added fuel to growing expectations that the Federal Reserve will have to lift policy rates as soon as next year.
The gap between 5- and 30-year yields shrunk to as little as 84.5 basis points, raising concerns over it potentially signaling a growth slowdown, before rebounding to about 88 basis points. The low Monday put the spread at its least since April 2020, a time when pandemic fears brought the global economy to a near shutdown. Five-year yields are up 4 basis points to around 1.168%, while the 30-year bond yield was down around 1 basis point at 2.03% at 12:36 p.m. New York time.
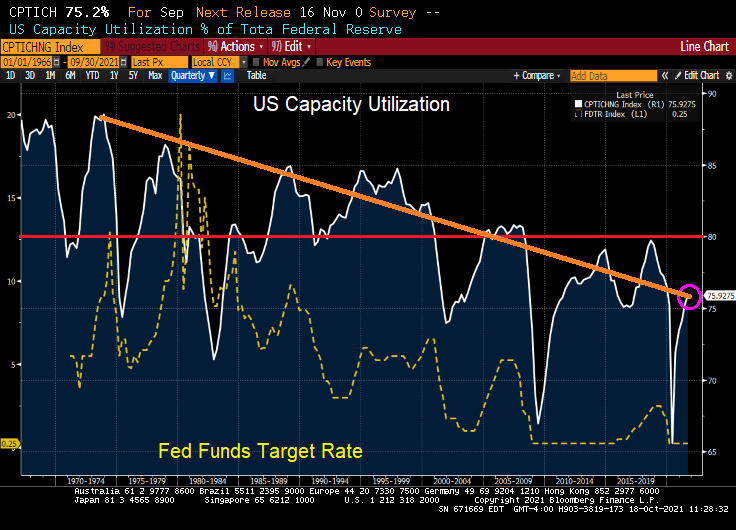
It used to be that capacity utilization was a signal for The Federal Reserve to raise or lower their key target rate. When capacity utilization rose above 80%, the economy was deemed to getting “hot” and The Fed would raise rates. And vice-versa.
But then mass outsourcing occurred, primarily to China and southeast Asia. Since the 1970s, the general trend in US capacity utilization has been downward. But the last time the US saw capacity utilization of above 80% in Q4 2007. Capacity utilization almost hit 80% in August 2018
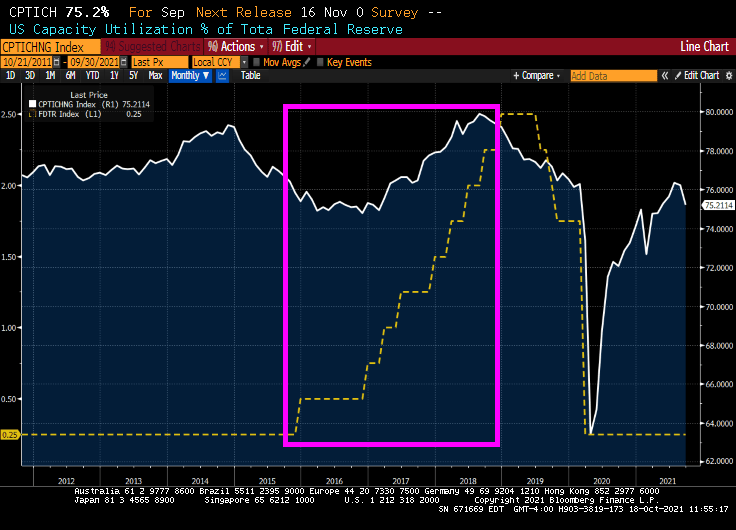
Oddly, The Fed started raising their target rate in 2015 under Fed Chair Janet Yellen AS CAPACITY UTILIZATION WAS FALLING. Capacity utilization hit almost 80% as The Fed put the brakes on rate hikes before Covid struck.
So, capacity utilization was obviously not on the mind of Yellen and the FOMC. Call it the new abnormal.
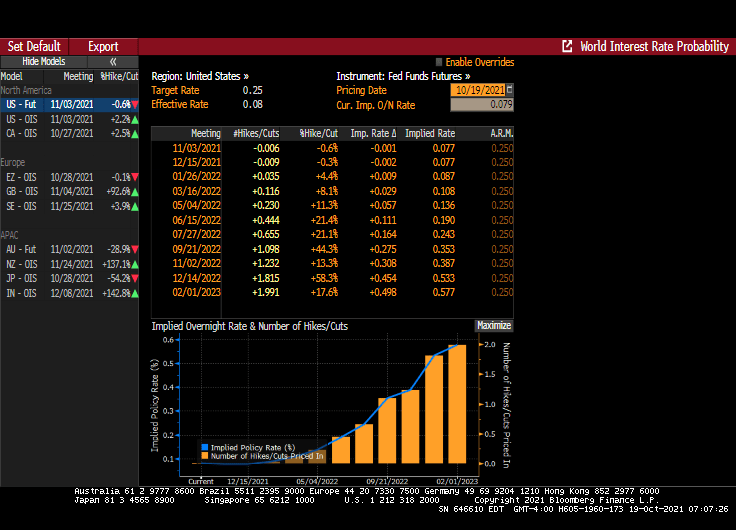
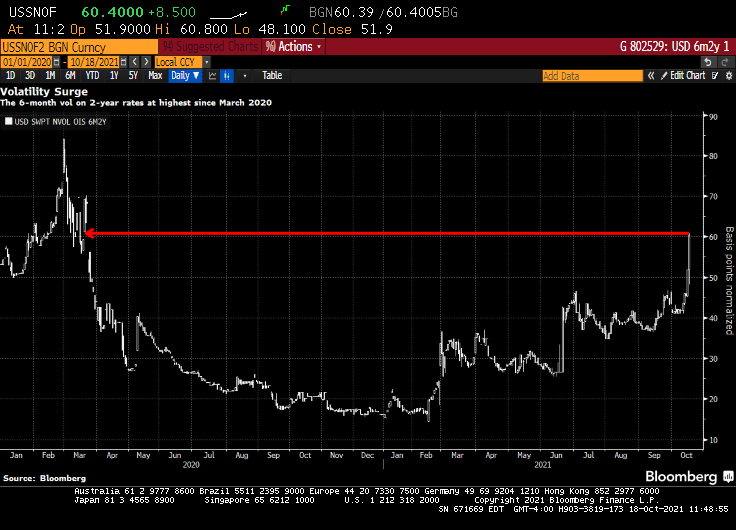
With capacity utilization falling, the path of Fed policy rate has shifted sharply over the past couple of weeks, to currently pricing first hike into the September 2022 FOMC meeting and second hike by February 2023 — there are now 100bp of rate hikes priced by the end of 2023, in line with the Fed’s dot-plot forecast.
Short-dated volatility on front-end U.S. rates — known as the upper left corner of the volatility surface — continues to catch a bid over the U.S. morning session, spurred by a sharp hawkish re-pricing of the Fed’s policy stance.
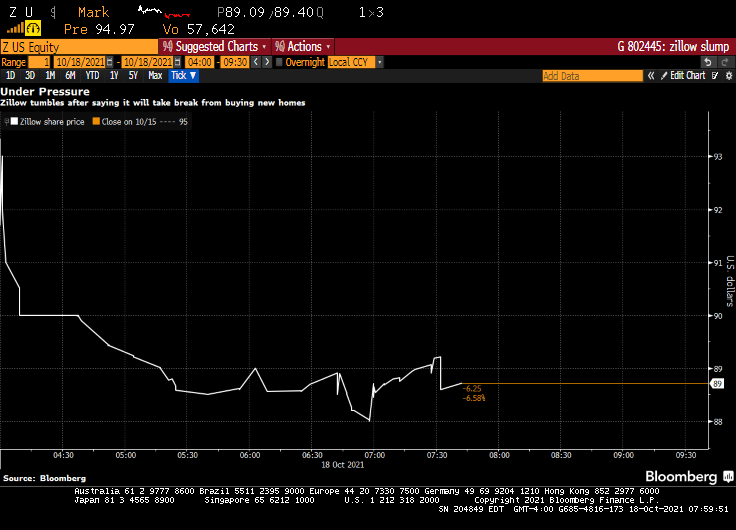
Zillow Group Inc. shares fell as much as 6.8% in premarket trading Monday after the online real estate firm said it would stop buying new homes and work to clear a backlog of properties it already has.
The Seattle-based company, which acquired more than 3,800 homes during the second quarter, has seen its stock price tumble about 27% this year after it nearly tripled in 2020 amid the pandemic-fueled housing market boom.
The shares have come under additional pressure in recent weeks after a viral TikTok video from a real estate agent in Las Vegas said an unnamed company was pulling off a convoluted scheme to manipulate housing prices in his home market. Zillow is also facing increased competition from firms like Opendoor Technologies Inc., which announced in August that it bought about 8,500 homes during the second quarter.
Zillow, which acquired more than 3,800 homes in the second quarter, will stop pursuing new home purchases as it works through a backlog of properties already in its pipeline.
“We are beyond operational capacity in our Zillow Offers business and are not taking on additional contracts to purchase homes at this time,” a spokesperson for Zillow said in an email. “We continue to process the purchase of homes from sellers who are already under contract, as quickly as possible.”
Zillow is best known for publishing real estate listings online and calculating estimated home values – called Zestimates – that let users keep track of how much their home is worth. The popularity of the company’s apps and websites fuels profits in Zillow’s online marketing business.
Of course, The Fed dumping in trillions into a bottlenecked housing market is helping to fuel the flipper fire.
Is this a secret warning about a possible slowdown in the housing market?
Has The Federal Reserve lost control of the economy? And inflation? The answer is likely yes. Why?
The Covid crisis has been played by the Federal government as an excuse for insane levels for spending coupled with massive monetary stimulus from The Federal Reserve.
As an example of The Fed losing control is US savings. The Fed’s model is to drive savers into consumption, therefore raising production and increasing GDP growth. But alas, The Fed can’t overcome the fear faced by consumers with Covid, Covid shutdowns, and rapidly rising prices.
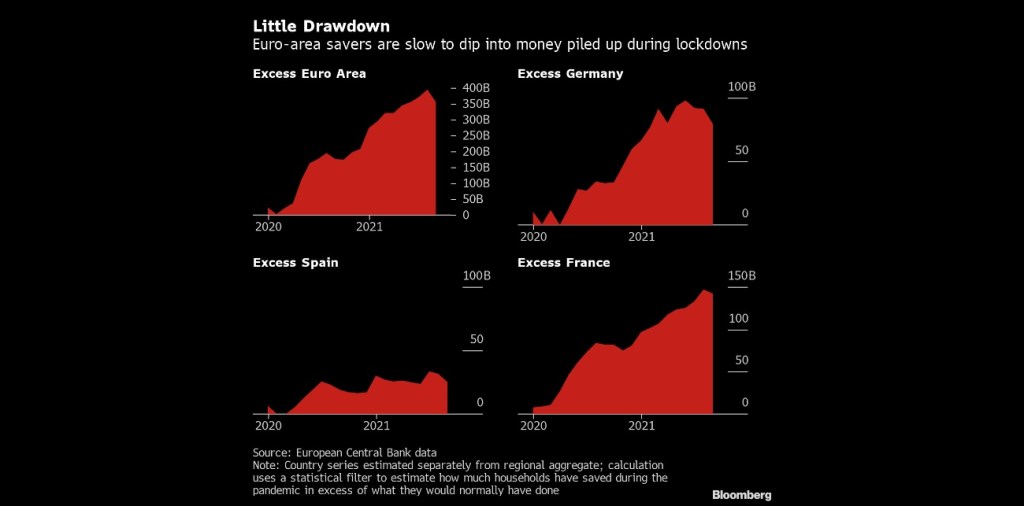
(Bloomberg) — Consumers in Europe and the U.S. aren’t rushing to spend more than $2.7 trillion in savings socked away during the pandemic, dashing hopes for a consumption-fueled boost to economic growth on both sides of the Atlantic.
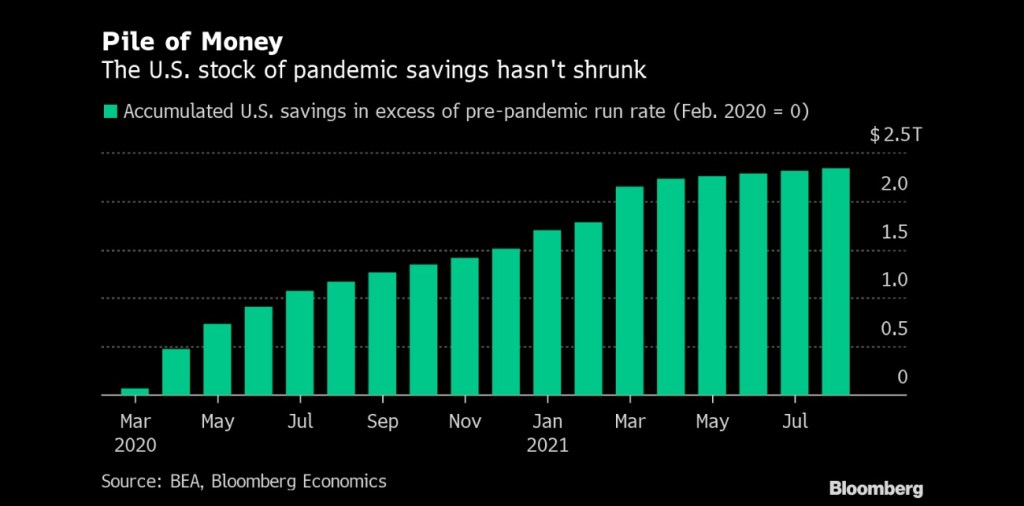
In the wake of lockdown easing during the northern hemisphere’s summer holiday season, excess savings in euro-area bank balances declined only marginally in August, and Italy still recorded an increase, according to calculations by Bloomberg Economics. In the U.S. there has also been no drawdown, the figures show.
The absence of a consumption surge that had been anticipated by some economists may speak against the prospect of a lasting inflation shock feared by central banks. While higher balances could help households cope with skyrocketing heating bills, tepid demand might temper businesses’ ability to push through permanent price increases.
In the USA, we see accumulated savings despite near-zero deposit rates at banks.
To be sure, The Fed reacted (or overreacted) to the Covid outbreak by increasing the money supply and their purchase of Treasuries and Agency MBS as the Federal government went on a wild spending spree.
But with trillions in Stimulypto Federal spending and Fed money printing, the bottlenecks in the economy (which apparently weren’t known before … ) have contributed to massive price increases that aren’t going away any time soon.
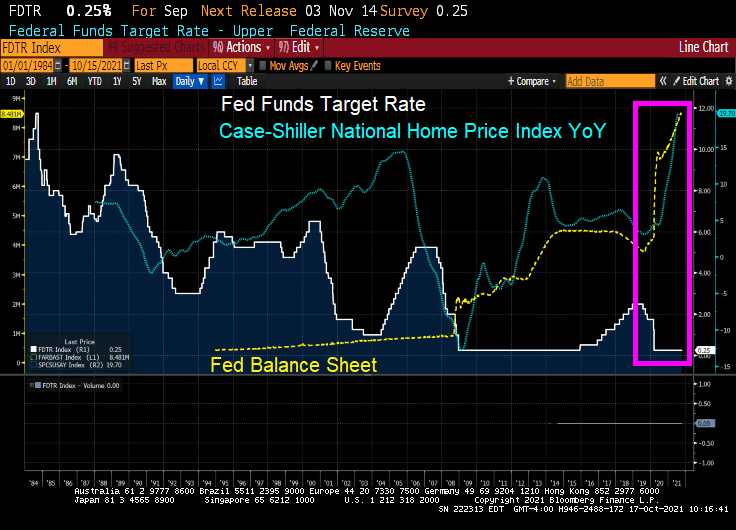
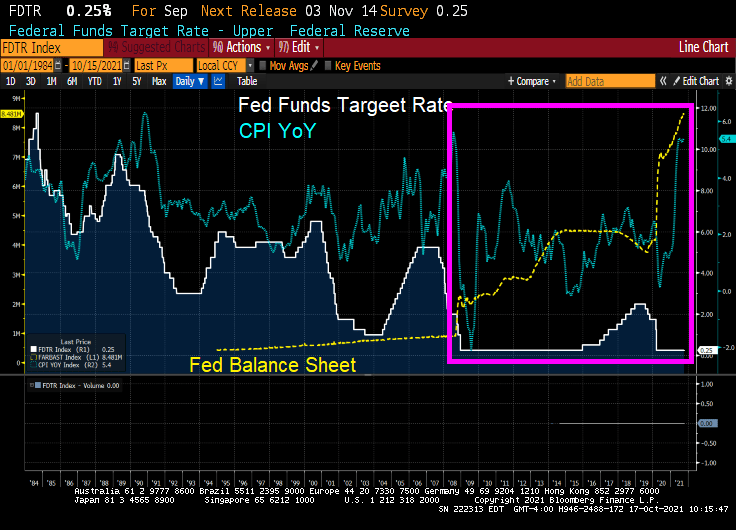
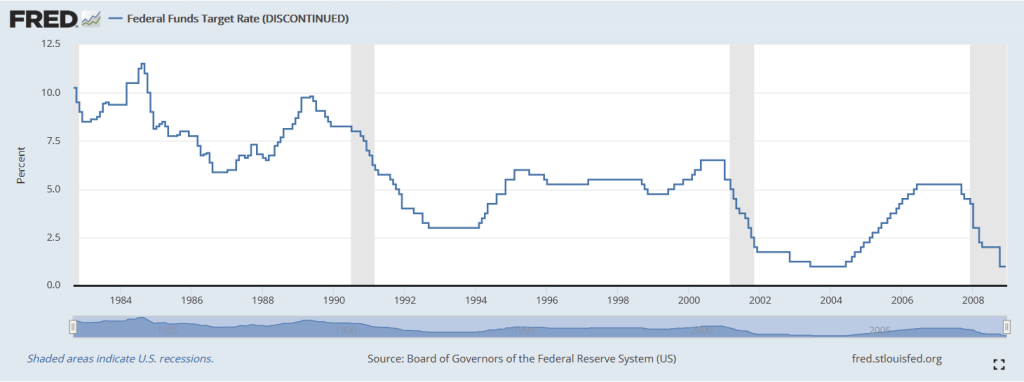
Notice how Fed monetary policies changed after the housing bubble burst and ensuring financial crisis/Great Recession. Before 2008, The Fed periodically whipsawed their Fed Funds target rate. But since late 2008, we have seen hardly any move from The Fed (except for 2017-2020 while Trump was President). For Obama,
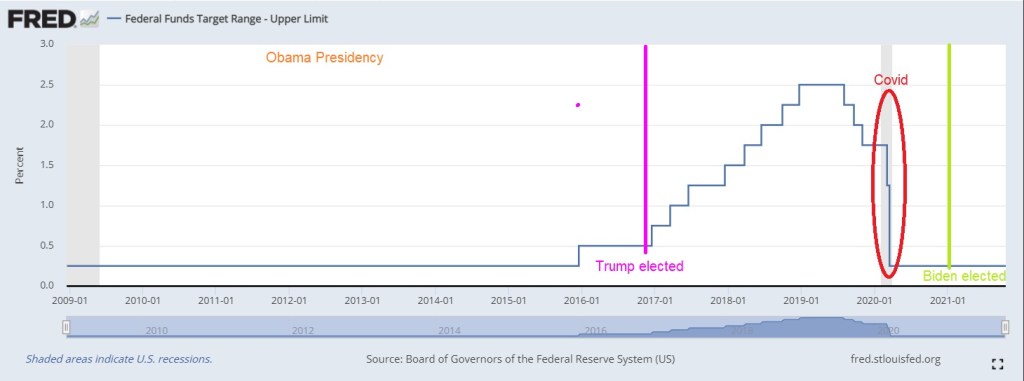
Here is a look at The Fed’s record under Obama, Trump and Biden. The Fed raised their target rate only once under Obama until Trump was elected. Then The Fed raised rates 8 times. Then began lowering them again (5 times) leading to a big drop when Covid stuck. So for Trump, The Fed changed their target rate 13 times compared to 1 rate change under Obama and none under Biden.
And the above chart is only The Fed’s target rate. My point is that Yellen failing to raise rates under Obama has resulted in this over DC-Stimulypto we are seeing today.
Note the difference in Fed policies BEFORE the financial crisis. We need to return to a normal Fed policy rather than the hyper-inflationary zero-rate, QE policies since 2008.
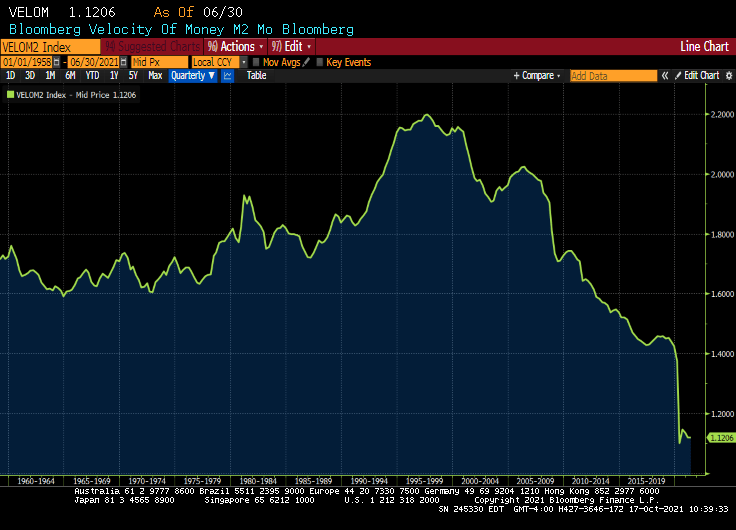
M2 Money velocity (GDP/M2 Money) remains near an all-time low.
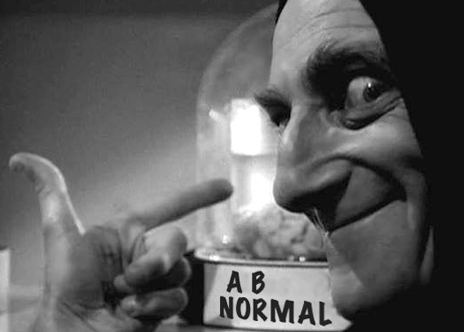
But given DC’s spending spree and all-time lows for M2 Money Velocity, The Fed is going to need to keep purchasing trillions in debt at low interest rates. The abnormal Obama years (Bernanke/Yellen) are the NEW abnormal. Or should I say abby normal policies?
Dr. Frederick FrankensteinAre you saying that I put an abnormal brain into a seven and a half foot long, fifty-four inch wide GORILLA?
So, yes, Bernanke and Yellen put into place abnormal policies that Powell is following into the world’s largest economy (or gorilla).
Only Igor and The Federal Reserve would pick such abnormal policies that ultimately lead to massive misallocations and inflation.
On a side note, do Biden and Transportation Secretary Pete Buttigieg really believe that they can fix the backed-up ports that are flooded with cargo thanks to Stimulypto? By Christmas??
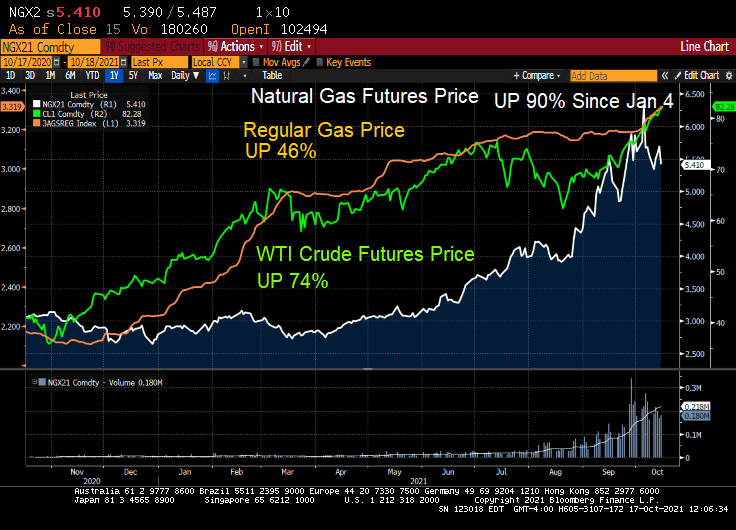
Not with natural gas prices up 90% since January 4th!
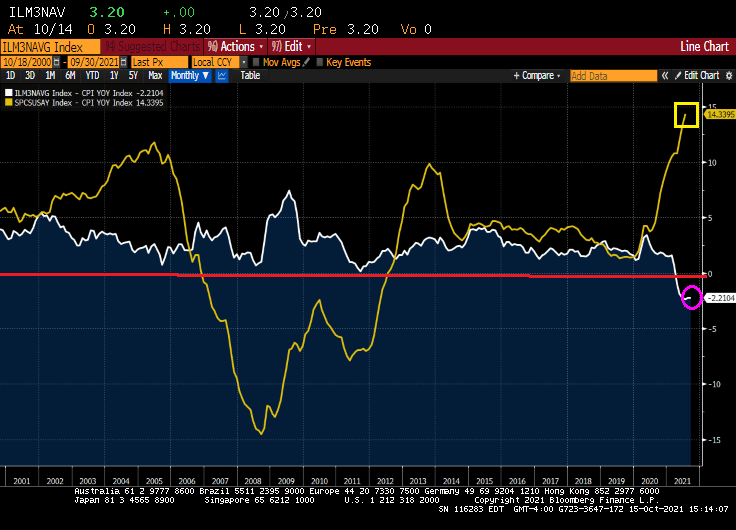
This is a time even unlike the disastrous housing bubble of the 2000s that led to the financial crisis and Great Recession. Even during the housing bubble years, we still had positive REAL mortgage rates: Bankrate 30Y Fixed rate – CPI YoY. But today we have even FASTER REAL home price growth and NEGATIVE mortgage rates!
And yes, REAL home price growth is 14.34% YoY while REAL hourly earnings growth is -0.79%.
The University of Michigan consumer survey came out today and buying conditions for housing improved to 75. Which means that more people were negative than positive due to skyrocketing home prices.
With negative 30Y mortgage rates and rising apartment rents, is it time to buy? Just remember what happened to Leon in Blade Runner.


You must be logged in to post a comment.