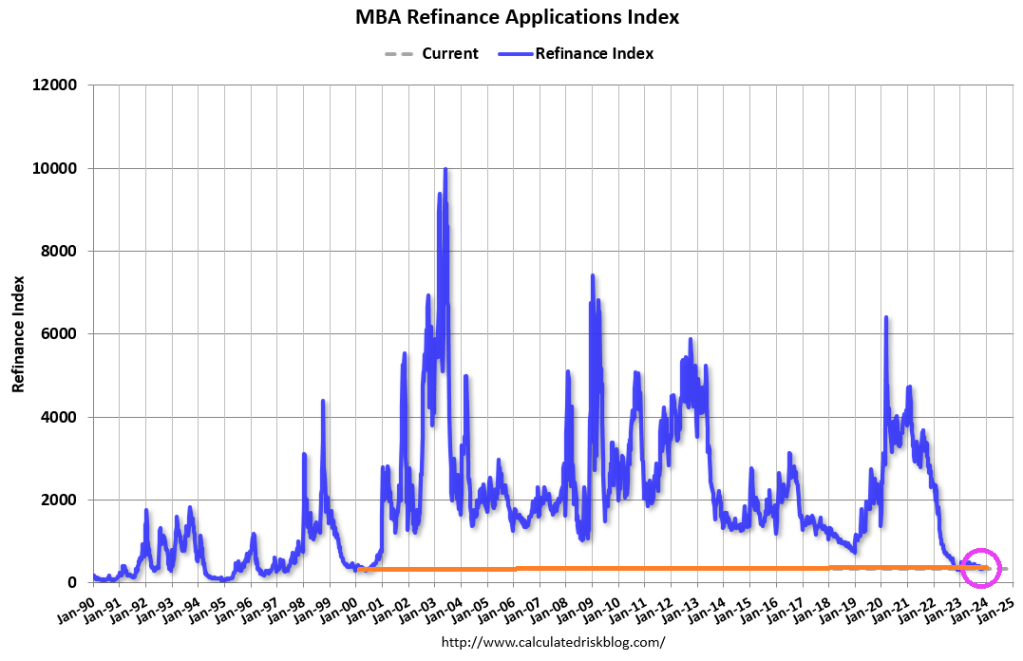
US inflation is lower than it was a year ago (cheers from The View CNN and MSNBC cheerleaders), but inflation remains stubborning above The Fed’s 2% target rate and will likely remain above 2% for the nexf few years. So mortgage demand is much like inflation … mortgage demand increased in the latest week but generally is very low compared to last year.
Mortgage applications increased 2.5 percent from one week earlier, according to data from the Mortgage Bankers Association’s (MBA) Weekly Mortgage Applications Survey for the week ending November 3, 2023.
The Market Composite Index, a measure of mortgage loan application volume, increased 2.5 percent on a seasonally adjusted basis from one week earlier. On an unadjusted basis, the Index increased 1 percent compared with the previous week. The Refinance Index increased 2 percent from the previous week and was 7 percent lower than the same week one year ago.
The seasonally adjusted Purchase Index increased 3 percent from one week earlier. The unadjusted Purchase Index increased 1 percent compared with the previous week and was 20 percent lower than the same week one year ago.
The 30-year fixed mortgage rate dropped by 25 basis points to 7.61 percent, the largest single week decline since July 2022. But, mortgage rates are up 169% under Biden and Bidenomics.
Bidenomics, which is also Yellenomics (the former Fed Chair and current Treasury Secretary) has The Good, The Bad and The Ugly to say for it.
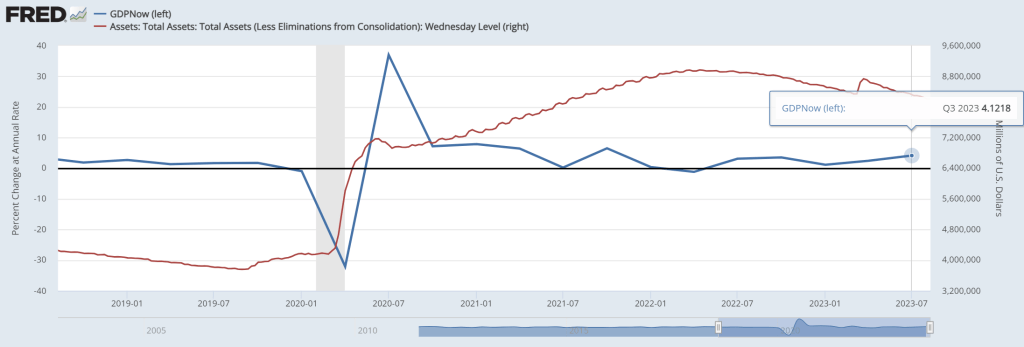
First, The Good! The Atlanta Fed’s GDP Now real time GDP tracker has Q3 GDP at … 4.12%. Pretty good, but bear in mind that there is still more than $8 trillion in Fed Monetary Stimulus outstanding (aka, Yellenomics).
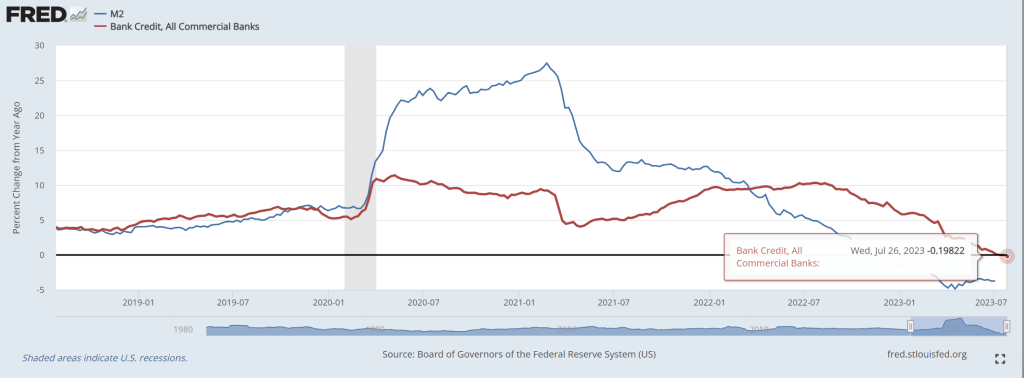
Second, The Bad. Bank credit growth is now negative.
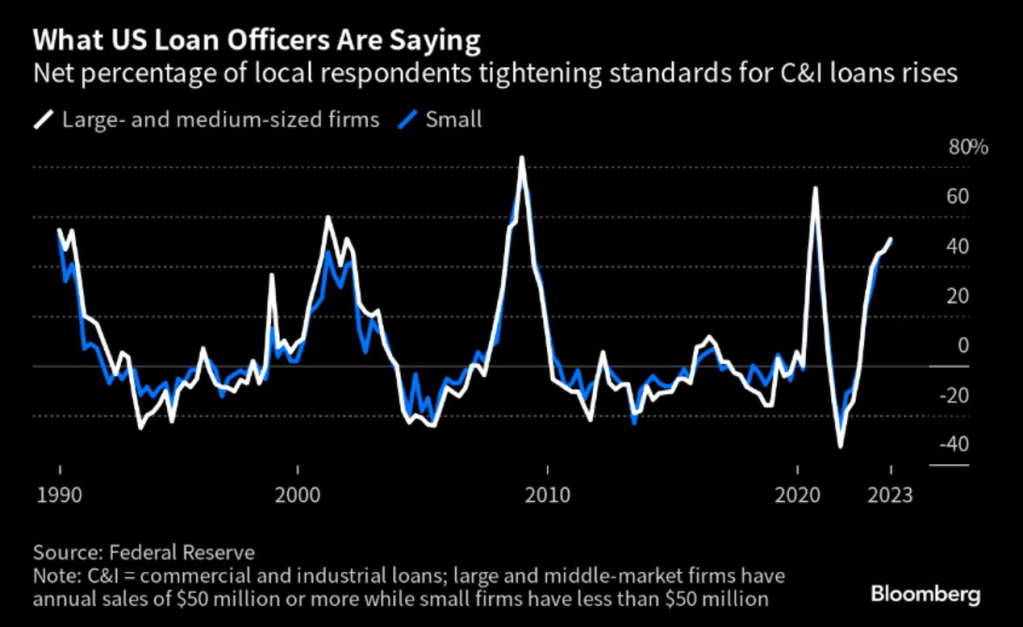
As lenders are tightening credit standards for commercial and industrial loans.
The ugly? There are several candidates for this dishonor.
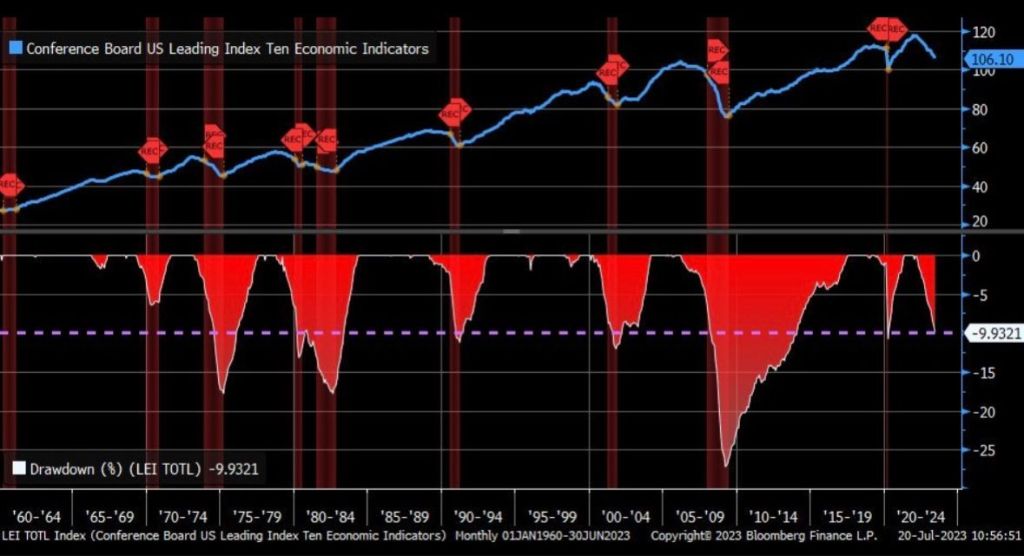
One, The Conference Board’s leading economic indicators is down -10.
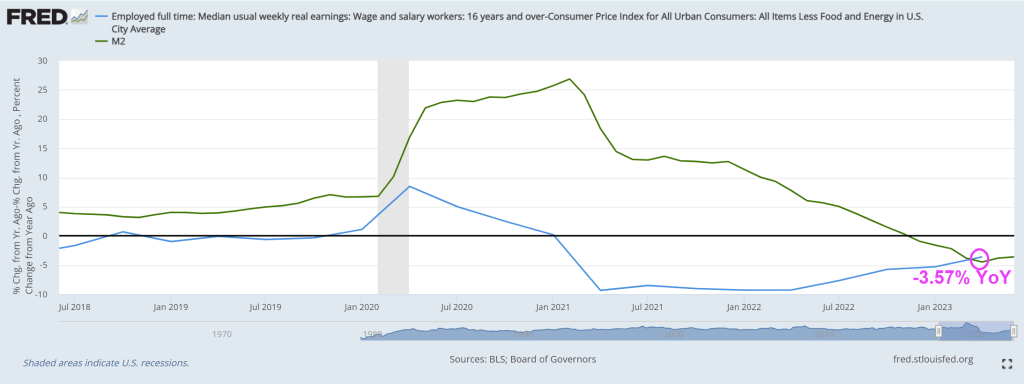
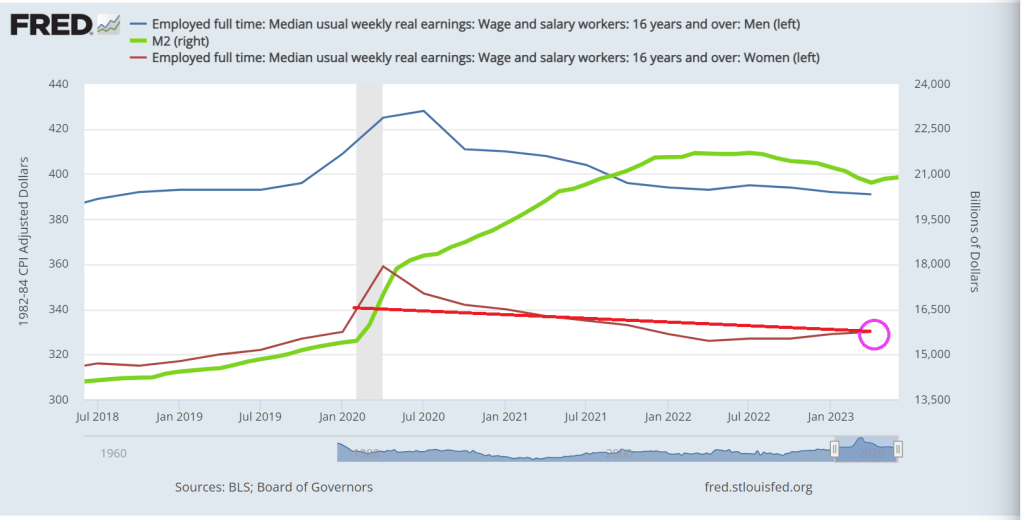
Two, REAL median weekly earnings growth remains negative at -3.57% YoY.
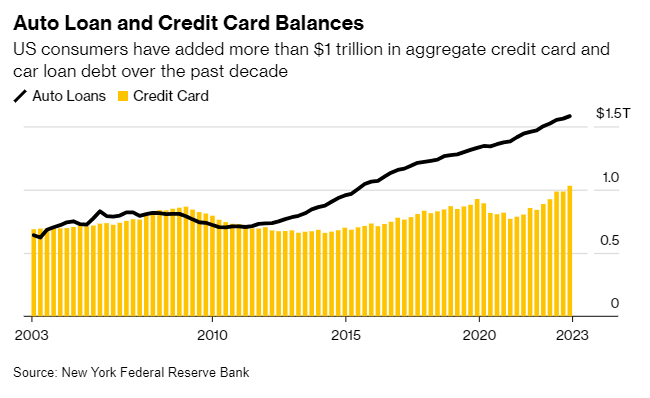
Third, auto loan and credit card balances are at $1.5 TRILLION making further consumer credit more difficult to finance GDP growth.
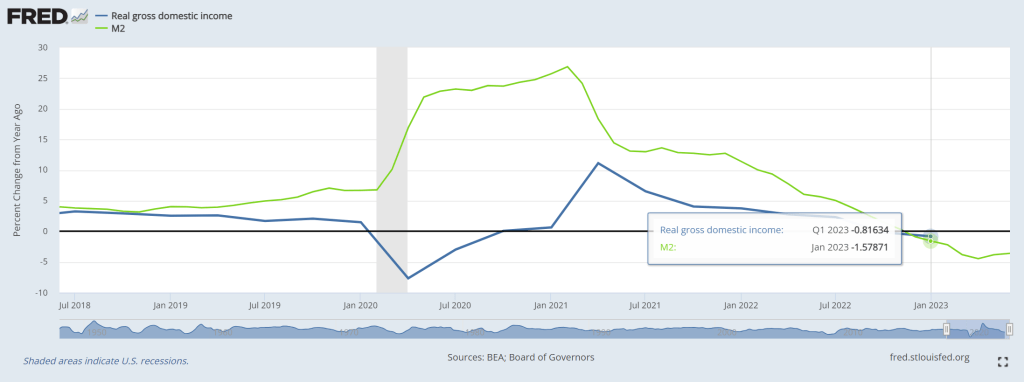
Fourth, Real Gross Domestic Income growth was negative in Q1 2023.
I could go on and on about the negatives of Bidenomics (e.g., massive distortion of Federal spending towards green energy and big donors). Isn’t the earth moving closer to the Sun in its elliptical orbit?? HOW is spending trillions on green energy work as we move closer to the Sun??
During the COVID-19 pandemic the occurrence of remote work jumped, out of sheer necessity. The technology was already available, but the pandemic accelerated its adoption and bypassed the hesitation of employers to allow people working from home. In many cases, remote work has been successful and therefore seems to have become a permanent feature, often in hybrid form. For employers, it has become an employee benefit to attract people in a tight labor market and it saves on office space costs. The flipside of the latter is that demand for office space has seen a structural downward shift. It is estimated that the underlying value of office space in New York City has permanently declined by 39%. This suggests that at current prices, there is a bubble in commercial real estate. In this special we are particularly interested in the implications for financial stability and the economic outlook. First we take a look at the development of commercial real estate prices and commercial real estate lending. Then we discuss the Fed’s recent stress test on large banks that included a large decline in commercial real estate prices. In contrast to the Fed’s exercise, we show that distinguishing between large and small banks provides a sharper picture of the vulnerabilities in the US economy. In particular, the connection between commercial real estate and small banks, through commercial real estate lending, could pose a threat to financial stability and make a recession worse.
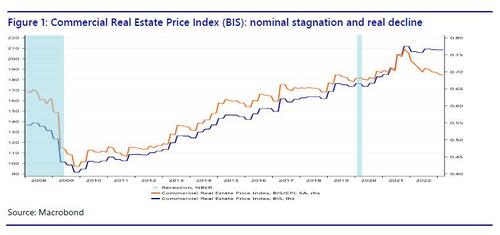
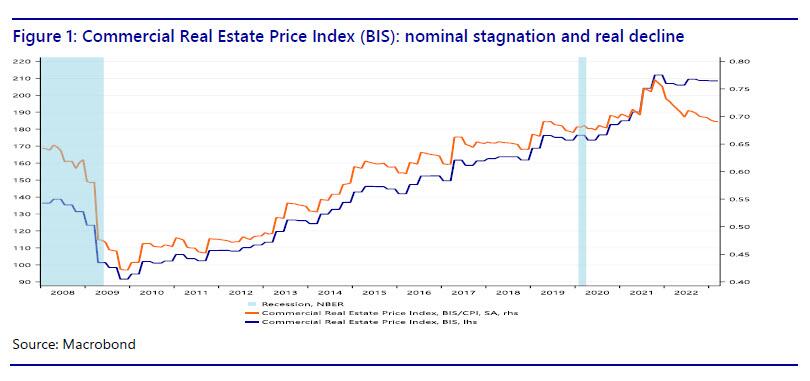
Commercial real estate heading south
If we plot the BIS commercial real estate price index, it is clear that since the Great Recession, commercial real estate (CRE) prices have more than doubled in nominal terms (the blue line in Figure 1), but have moved sideways since 2021. This suggests that prices have reached a plateau. However, in recent years inflation has obscured the movement of CRE prices in real terms (the orange line), which shows a peak in 2021, but since then there has been a decline, almost to the level during the COVID-19 pandemic. In other words, CRE prices are already failing to keep up with inflation. Is this an indication that the CRE bubble is already deflating? With nominal CRE prices remaining elevated, most of the nominal price correction is likely still to come. If the 39% estimate by Gupta et al. for New York City is representative for the entire United States, we are heading for a major decline in CRE prices.
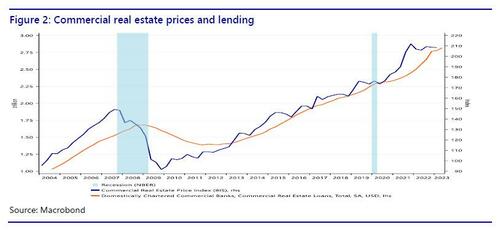
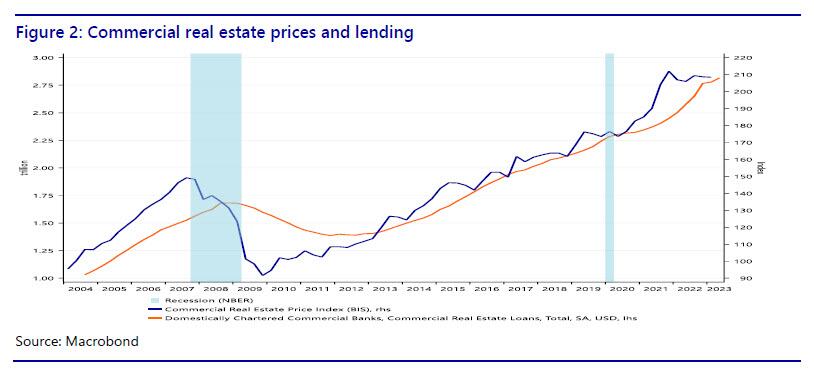
We can also plot the BIS index against CRE lending to show3 that rising prices for commercial real estate sparked a credit boom in commercial real estate (Figure 2). Given the academic literature linking financial crises to credit booms and busts, this should be cause for concern. Moreover, Minsky (1986) notes that an emphasis by bankers on the collateral value and the expected values of assets (instead of cashflows) is conducive to the emergence of a fragile (as opposed to a robust) financial structure.
If excess demand for office space pushed up commercial real estate prices, and if that increased CRE lending by banks, what does a structural downward shift in demand for office space mean? If CRE prices are deflating, what does that mean for the indebted CRE sector? Is this going to lead to defaults? And what does that mean for the banks that did the CRE lending? Is the deflation of the CRE bubble a threat to financial stability? Also note that due to the steep hiking cycle by the Fed, some companies in the CRE sector may find it difficult to refinance their loans at substantially higher rates.
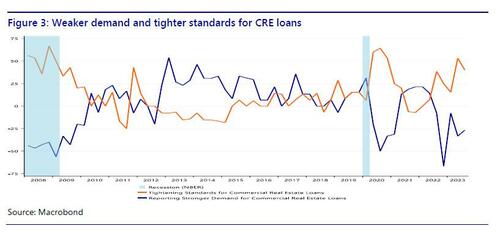
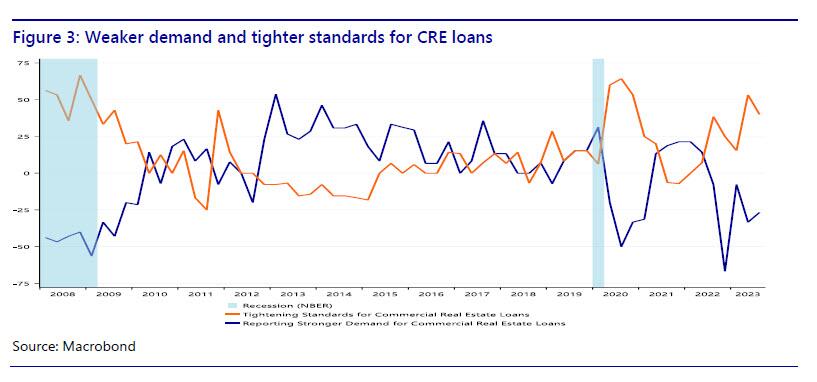
We can dig deeper by looking at the demand and supply developments in CRE lending. If we look at the Fed’s SLOOS data (figure 3), it is clear that demand for CRE loans strengthened especially between 2012 and 2017. Lending standards loosened between 2012 and 2015. This era coincides with a strong rise in the CRE price index, which may have motivated banks to expand CRE lending. Demand for CRE loans weakened during the pandemic, then bounced back as the economy reopened, but headed south again in 2022. Loan standards tightened during the pandemic, then loosened again when the economy rebounded, but have tightened since 2021. In other words, there seems to be a correlation between CRE prices and demand and supply developments in CRE lending. Currently, both are heading south, if we look at CRE prices in real terms and CRE lending in terms of net demand. It seems that rising CRE prices sparked a credit boom in CRE and now that the CRE price bubble is deflating, the CRE sector has less appetite to borrow and banks are tightening their lending standards.
The Fed’s incomplete stress test
CRE prices are falling in real terms and credit for the CRE loans is tightening. Does this pose a problem to the economy? Not if we believe the Fed’s June 28 press release that accompanied the annual bank stress test. The stress test looked at “a severe global recession with a 40 percent decline in commercial real estate prices, a substantial increase in office vacancies, and a 38 percent decline in house prices. The unemployment rate rises by 6.4 percentage points to a peak of 10 percent and economic output declines commensurately.” However, according to the Fed “all 23 banks tested remained above their minimum capital requirements during the hypothetical recession.” Therefore, the central bank concluded that “large banks are well positioned to weather a severe recession and continue to lend to households and businesses even during a severe recession.” However, one line in the press release reveals the main problem with the Fed’s stress test: “The banks in this year’s test hold roughly 20 percent of the office and downtown commercial real estate loans held by banks.” So where is the remaining 80%? If the stress test considers a huge decline in commercial real estate prices, it might be relevant to know how this affects the banks that hold 80% of the CRE loans made by banks. Therefore we take a closer look at CRE lending by large and small banks in the next section.
Bank lending: large vs small banks
We already saw in figure 2 that the rise in CRE prices until 2022 was accompanied by an increase in CRE lending. However, there is more to this story of we take a closer look at who has been doing the lending. So far we looked at aggregate bank lending to the CRE sector, without distinguishing between different types of banks. However, a closer look at the banking sector reveals a disturbing vulnerability that could be a threat to financial stability.
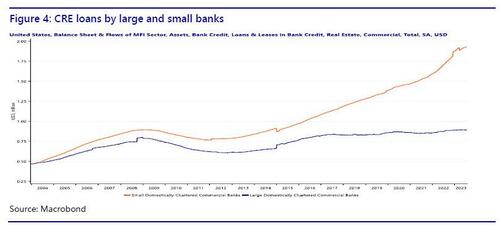
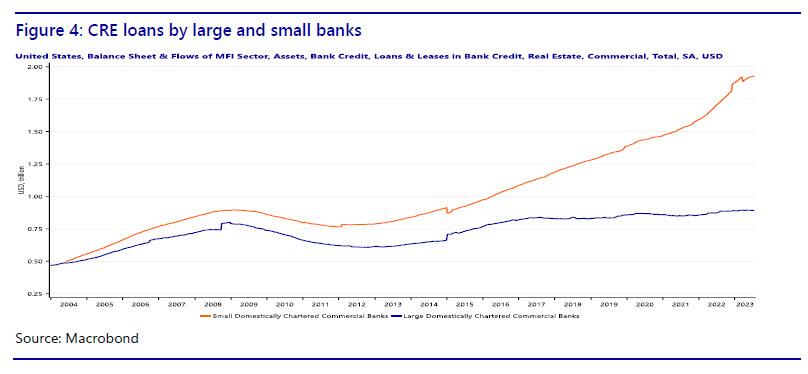
The Fed data on commercial banks distinguish between large and small banks. Large domestically chartered commercial banks are defined as the top 25 domestically chartered commercial banks ranked by size. Small domestically chartered commercial banks are defined as all domestically chartered banks outside of the top 25. Note that according to this definition a bank of say $80 billion would still be considered ‘small.’ In figure 4 we show how CRE lending has evolved, distinguishing between large and small banks.
It turns out that CRE lending by large banks has hardly increased in the last 15 years, while at the same time CRE lending by small banks has more than doubled. In other words, the growth in loans to commercial real estate has come from small banks. In fact, small banks have taken over the role of main provider of commercial real estate loans. Therefore, the Fed’s stress test omits the most relevant part of the banking sector for commercial real estate. While commercial real estate lending by large banks has remained stable since 2006, commercial real estate lending by small banks has increased rapidly. We could even talk of a credit boom in commercial real estate loans provided by small banks.
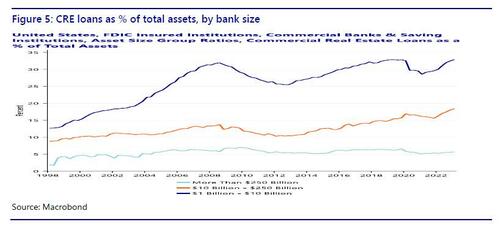
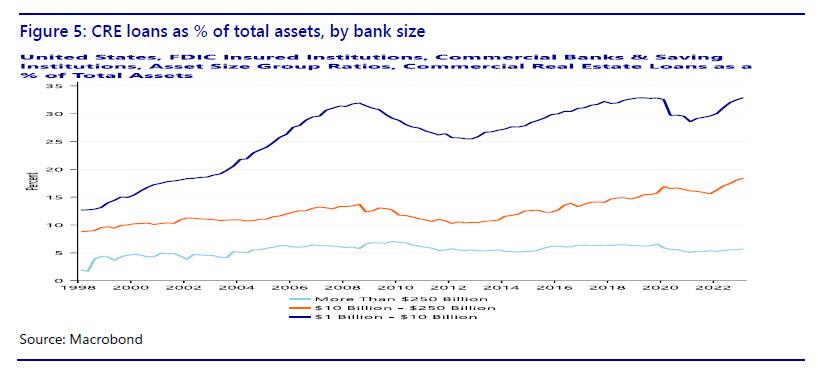
Whether the increased share of CRE lending by small banks is a problem also depends on the relative importance of CRE loans for small banks (Figure 5). FDIC data (Quarterly Banking Profile) distinguish at least three classes of asset size: more than $250 billion, $10-250 billion, and $1-10 billion. The first class contains only large banks as defined by the Fed stress test, the second class is a mix of large and small banks, the third class only contains small banks. While for the largest banks, CRE loans were only 5.7% of total assets in the first quarter of 2023, for the smallest banks this is 32.9%! For the intermediate-size banks the CRE loans are 18.4% of assets. So not only is 80% of the CRE bank loans made by small banks, these loans also make up a much larger fraction of the balance sheet of small banks.
Finally, it is important to note that small banks are regional banks. In fact, the US has so many small banks because for much of its history it was difficult for banks to open a branch in another state. This legislation has been abolished, and the amount of banks in the US has fallen, but there are still many small banks with predominantly regional clients. This means that CRE risk in small banks is also regionally concentrated. Instead of a diversified nationwide CRE loan portfolio, a small bank tends to make loans to local borrowers. Consequently, if commercial real estate in a region turns sour, the small banks in the area will be highly exposed. Bubble or not, any adverse development in the CRE sector is going to hit small banks harder than large banks.
The commercial real estate-small bank nexus brings together two vulnerable sectors that could rapidly deteriorate in a self-reinforcing loop. Small banks have already shown vulnerable to higher interest rates and deposit outflows in March and commercial real estate is high on the list of financial stability concerns of US regulators. We have shown that the two sectors are critically connected and in the next section we speculate on the feedback mechanisms that could arise and make things worse.
Roads to ruin: feedback mechanisms
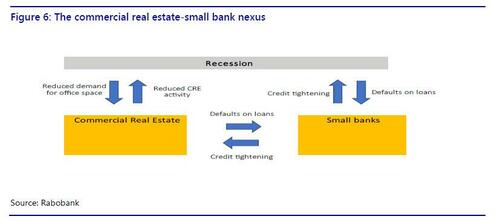
The commercial real estate-small bank nexus allows for several scenarios in which both sectors could be destabilized. In the first two scenarios, a crisis occurs in one sector, causing problems in the other sector. Tighter credit and reduced activity in the CRE sector could push the economy into a mild recession. In the third scenario, a mild recession causes problems in both sectors, which could then reinforce each other and make the recession worse.
In scenario 1, a small banking crisis leads to problems in CRE. Given that the majority of CRE loans have been made by small banks, continued problems for small banks, caused by or leading to deposit flight, could force them to tighten lending to the CRE sector. This would reduce the supply of credit to CRE, causing additional problems for the CRE sector, on top of office vacancies and stagnating prices.
In scenario 2, a CRE crisis causes small banks to collapse. Even if small banks stabilize in the near future from the recent deposit flight problems, they could subsequently be dragged down by a crisis in the CRE sector. Defaults in CRE will asymmetrically hurt small banks rather than large banks, because of the concentration of CRE risks at small banks. This could lead to a new round of deposit flight from small banks to large banks and money market funds. The losses on loans and loss of funding could be lethal to small banks.
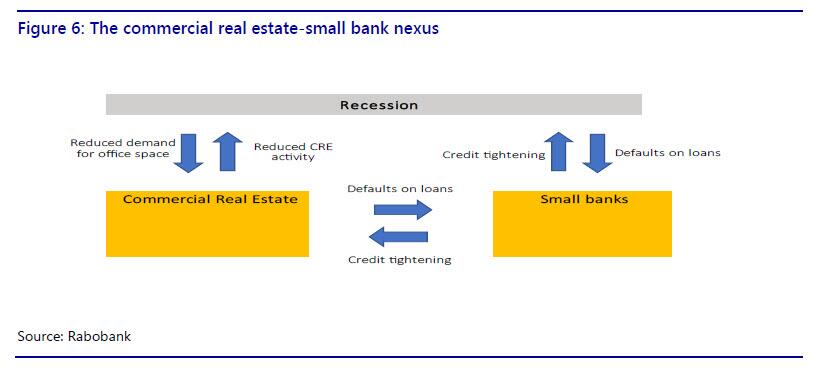
In scenario 3, a mild recession could cause a small banking crisis and a CRE crisis. In turn, this could lead to a more severe recession. A mild recession, for example caused by the Fed’s hiking cycle, will hurt the banking sector and the CRE sector at the same time. In particular, a recession would further reduce demand for office space. This will add to the problems in the CRE sector. Increased CRE defaults will hurt banks, especially the smaller ones with relatively more exposure to CRE. Losses on CRE loans will force banks to tighten credit, including for the CRE sector. The self-reinforcing problems in the two sectors could further drag down the overall economy, making the initially mild recession more severe. Specifically, tighter credit and reduced activity in the CRE sector will drag down GDP growth further.
We summarize the specific feedback mechanisms in the commercial real estate-small bank nexus in figure 6.
More broadly, we already saw in March how problems at small banks had an immediate adverse impact on financial markets. In combination with a faltering CRE sector this could severely undermine confidence among investors, consumers and businesses. This would have a broad-based negative impact on GDP growth.
Conclusion
COVID-19 appears to have a lasting negative impact on demand for commercial real estate. The federal regulators are aware of the risks in commercial real estate, but the Fed’s stress test provides a false sense of security. The finding that large banks are able to absorb losses on CRE loans in case of a CRE crisis is encouraging, but the bulk of CRE bank loans has been provided by small banks. In fact, while CRE lending by large banks has been stable, there has been a credit boom in CRE loans provided by small banks, more than doubling the amount since 2006. What’s more, small banks are more vulnerable to the CRE sector in terms of exposure and have already been hit by deposit outflows earlier this year. The commercial real estate-small bank nexus exposes the US economy to a vulnerability that could threaten financial stability and either cause a recession or make a recession more severe.
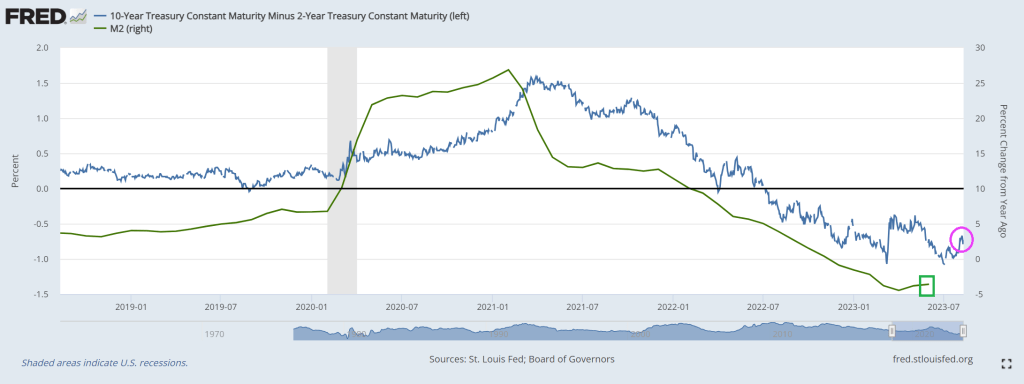
And another day, another inverted 10Y-2Y yield curve!
This chart goes along with negative bank credit growth.
Lastly, we have the Conference Board’s leading index plunging to -10!
Thanks in part to Cap’n Crunch, Fed Chair Jerome Powell!
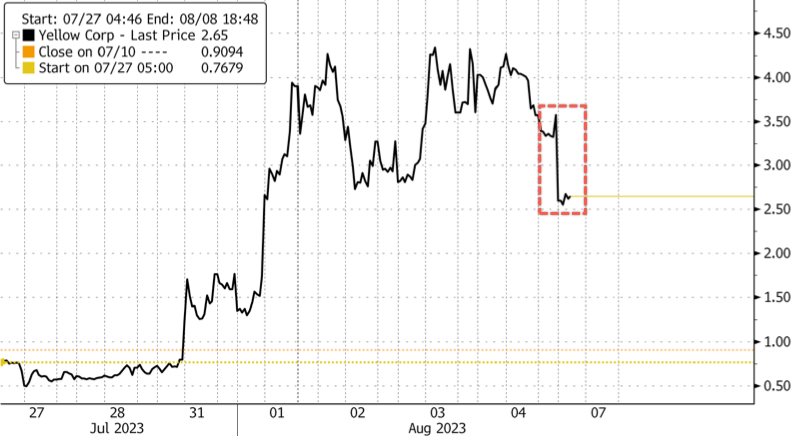
“It is with profound disappointment that Yellow announces that it is closing after nearly 100 years in business,” said Yellow CEO Darren Hawkins in a statement Sunday.
Hawkins continued, “Today, it is not common for someone to work at one company for 20, 30, or even 40 years, yet many at Yellow did. For generations, Yellow provided hundreds of thousands of Americans with solid, good-paying jobs and fulfilling careers.”
Yellow’s bankruptcy marks the largest filing in US trucking history. The firm was responsible for roughly 15% of major corporations’ less than truckload. It has struggled with a sizeable debt load and changing consumer habits in a post-Covid environment. Yellow has $1 billion in debt due in 2024 alone and has struggled to find common ground with the Teamsters Union.
Hawkins blamed the union for the company’s failure:
“We faced nine months of union intransigence, bullying and deliberately destructive tactics.”
Yellow asked the Delaware court for permission to make payments, including employee wages and benefits, taxes, and certain vendors essential to its businesses.
Much of Yellow’s business halted weeks ago when it stopped making pickups. It axed most non-union employees and closed its yards at the end of July.
Stifel research director Bruce Chan said the demise of Yellow has been “two decades in the making,” blaming poor management and strategic decisions from the early 2000s.
For the overall trucking industry, Amit Mehrotra with Deutsche Bank said the collapse of Yellow is “clearly very positive for the companies that remain open for business.” He listed Old Dominion, Saia, CSX, and FedEx among other top picks in the industry.
Yellow shares trading in New York plunged more than 26% on the news. This followed a 781% surge from about 50 cents on July 27 to a high of $4.34 last Thursday.
Bidenomics = missing free markets replaced by the massive Federal foot of idiotic policies.
US average hourly earnings continued at 4.4% year-over-year (YoY). However, the last core inflation reading was 4.8% YoY, so real wages continue to decline.
Rent CPI for June was 7.8% YoY.
Here is the rest of the story.
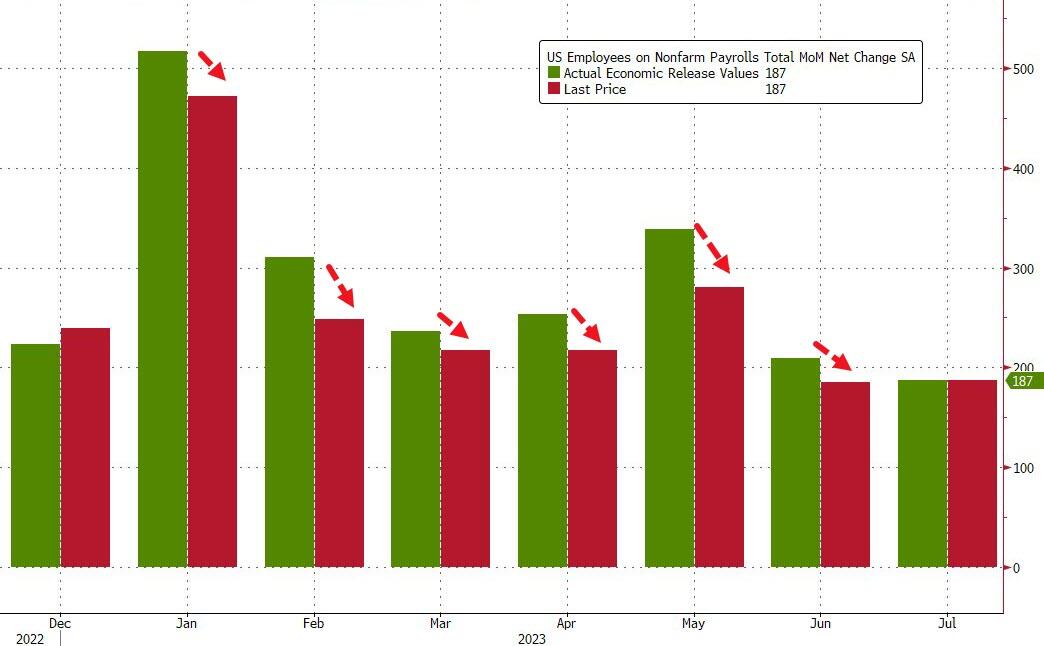
In keeping in with Biden admin’s penchant of constantly fabricating data, both May and June numbers were revised sharply lower of course:
May revised down by 25,000, from +306,000 to +281,000
June was revised down by 24,000, from +209,000 to +185,000.
To show just how ridiculous the data manipulation is, consider this chart – every monthly payrolls report in 2023 has been revised lower.
And on the disappointing jobs report and massive revisions of past data (the REAL inflation plaguing the nation is The Federal goverment lying about data), the US Treasury 2 year yield dropped like Biden on a flight of stairs.
Here are the faces of Washington DC. Lies, corruption, government for sale to highest bidder, cynacism, oppression, fear mongering, etc. This is Biden’s legacy.
The US Fiscal position is very bad and the US is beginning to look like a third world economy. And with Biden and Democrat AGs filing indictments against Biden primary Presidential oppoonent, that country is Venezeula! Like skyrocketing interest on the Federal debt to pay for green energy hustlers and the Ukraine war.
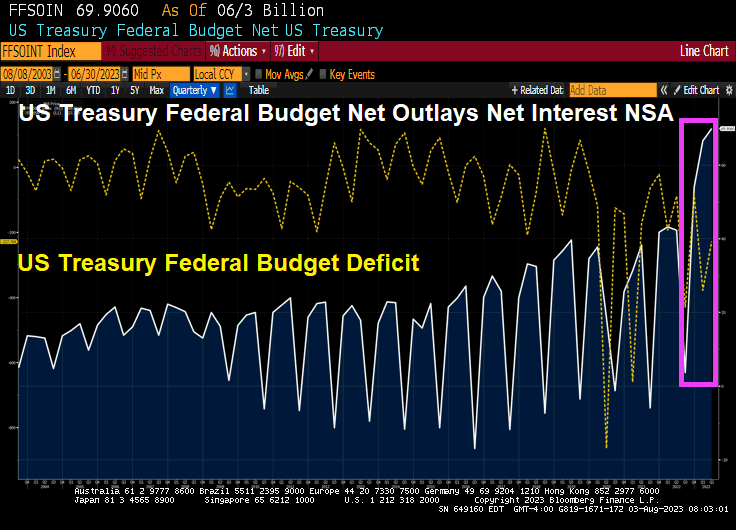
The US Federal Deficit continues to grow as seen in the charts below. A $2.25 Trillion dollar run rate deficit is significantly worse than the $1.3 Trillion that was recorded in Fiscal 2022. This level of deficit is unprecedented in an economy with low unemployment and theoretically no recession. Naturally, we ask just how big the deficit will be if we have either a recession or a crisis? In the dotcom bust, the GFC and the COVID shock, the deficit expanded massively.
Taking Garic’s math one step further, the US incurred a deficit of $1.3T in Fiscal 2022 (September). If the current run rate is sustained that would imply an annualized deficit of $2.9 Trillion.
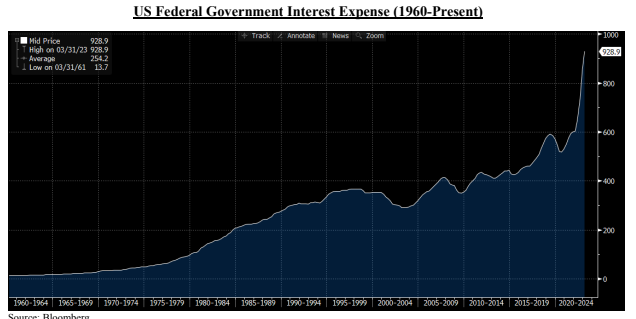
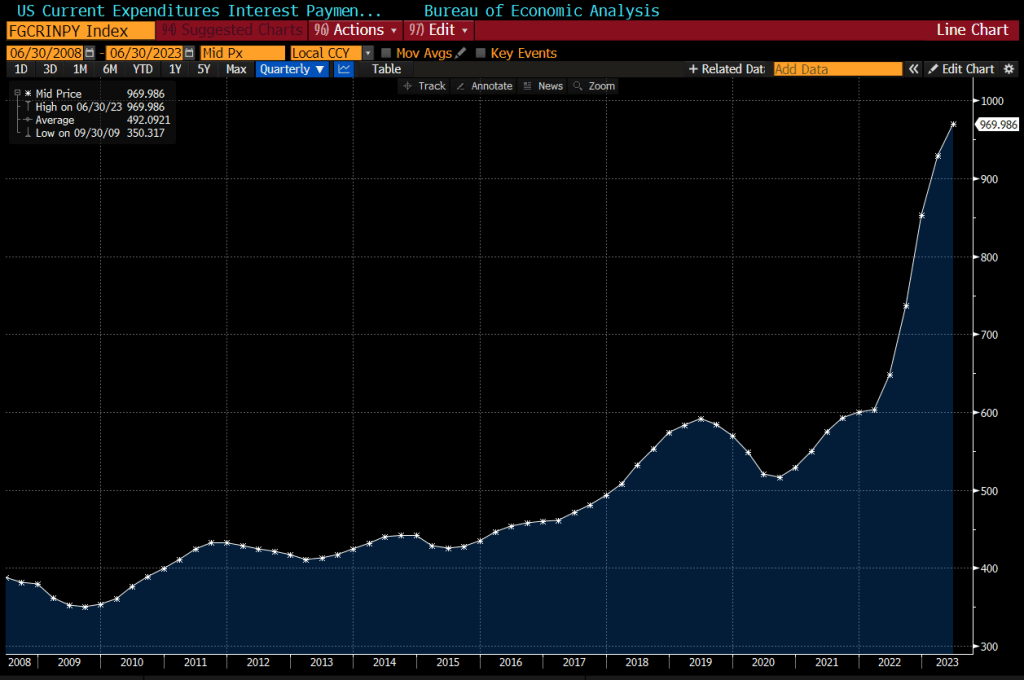
Of course, one big driver of this deficit is the interest cost incurred by the Government itself. It is rapidly approaching a $1 Trillion dollar run rate which means the Government is spending more in interest than on national defense. As you can see in the schedule below, the Fed’s rate hiking campaign has been very expensive for the US Government since a large portion of the federal debt is in shorter maturities which currently pay ~ 5.3% in interest. As recently as September of 2021, many of these same securities had much lower interest cost – as low as only 10-30 basis points.
Looking at the chart above, we wonder: is there anything about this that looks remotely sustainable? We are at that point in the movie where raising interest rates to fight inflation actually makes things (including inflation) worse. Worse because deficits swell and will need to be monetized.
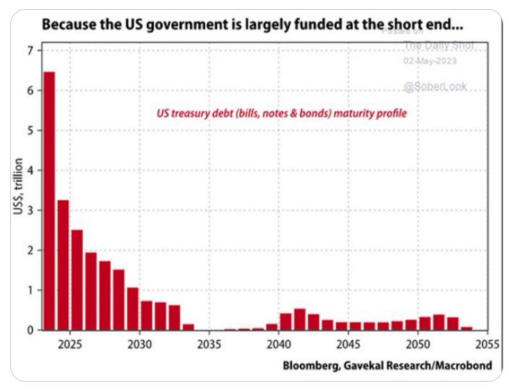
Furthermore, the issue is acute because the US Government uses the short-term bond market to Fund most of its debt. As the chart below from Gavekal Research/Macrobond shows, the Government needs to roll over $6 Trillion of maturing notes in 2023 and $3 Trillion of notes in 2024. This does not take into account any of the roughly $1.2 Trillion of bonds and notes that will be sold into the market by the Fed if Quantitative Tightening continues. Nor does it account for the ever increasing US Federal Deficit which will easily exceed $2.2 Trillion this year.
In short, the US Government has some serious funding challenges particularly when we consider that foreigners have been net sellers of our bonds since 2014.
IT’S THE DEBT, STUPID
On January 19, 2023 the US Federal Government hit its debt ceiling of $31.4 Trillion. Extraordinary spending measures kicked in which allowed the Government to keep operating. This lasted until June when Treasury Secretary Yellen informed Congress that a debt default was imminent if the ceiling was not raised.
After the usual political posturing, Congress did two things: (i) they agreed to place a two year cap on spending increases for a small portion of the budget that amounted to only 7% of the total budget. (like placing a band aid on a gaping wound); and (ii) they agreed to suspend the debt limit and to not replace it with another figure until January of 2025. We do not think they have ever.
Put it differently, let’s call this “Government Gone Wild!”
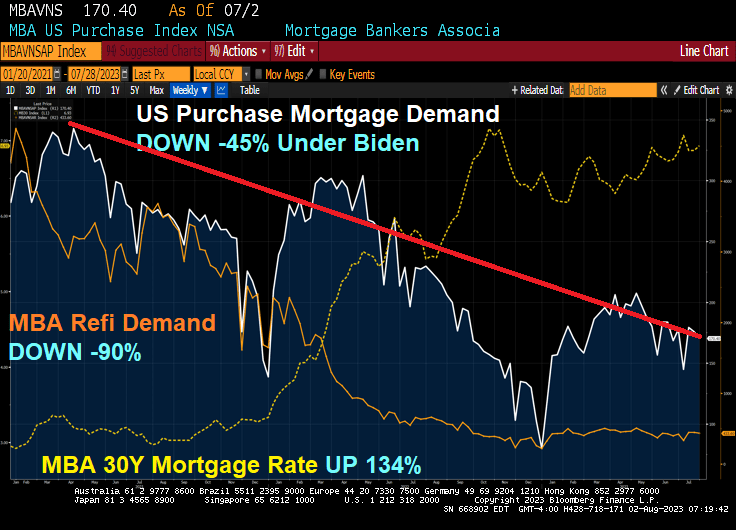
Inflation under Biden has been very painful for the US middle class and low wage workers. That inflation has resulted to surging mortgage rates thanks to The Fed’s counterattack.
The result? Mortgage rates are up 134% under Bidenomics, while mortgage purchase demand is down -45% since Biden was selected. And mortgage refinancing demand is down a staggering -90%!
Mortgage applications decreased 3.0 percent from one week earlier, according to data from the Mortgage Bankers Association’s (MBA) Weekly Mortgage Applications Survey for the week ending July 28, 2023.
The Market Composite Index, a measure of mortgage loan application volume, decreased 3.0 percent on a seasonally adjusted basis from one week earlier. On an unadjusted basis, the Index decreased 3 percent compared with the previous week. The Refinance Index decreased 3 percent from the previous week and was 32 percent lower than the same week one year ago. The seasonally adjusted Purchase Index decreased 3 percent from one week earlier. The unadjusted Purchase Index decreased 3 percent compared with the previous week and was 26 percent lower than the same week one year ago.
US interest expenses have surged by about 50% in the past year, to nearly $1 trillion on an annualized basis.
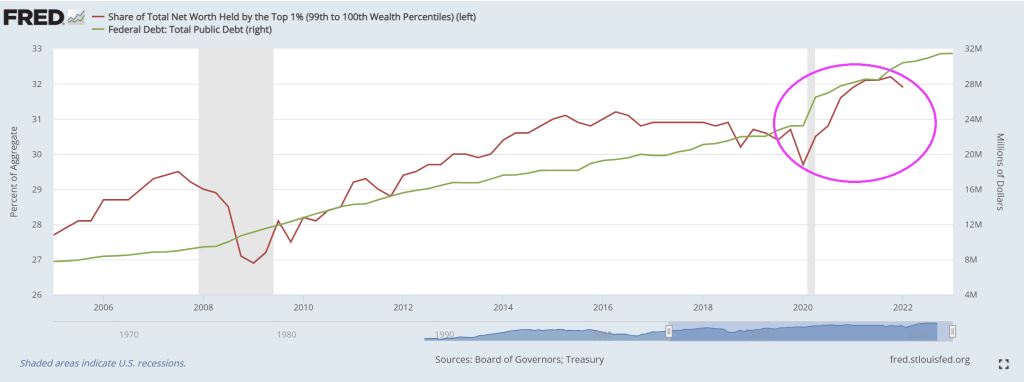
Look at the share of net worth by the top 1% as Treasury borrows more money.
Oddly, Biden is not talking about about putting US government policies up for sale to the highest bidders. But don’t worry. Biden is the King of Corruption in the District of Corruption (Washington DC).
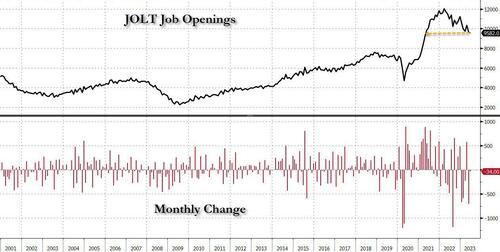
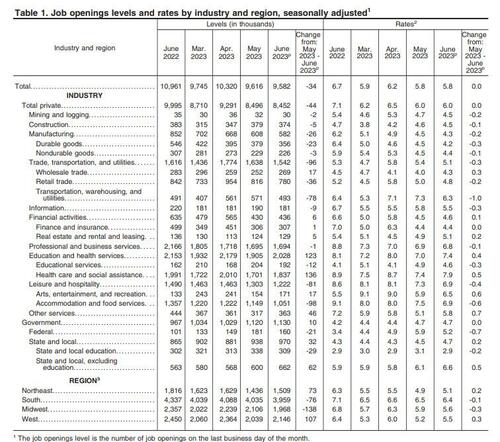
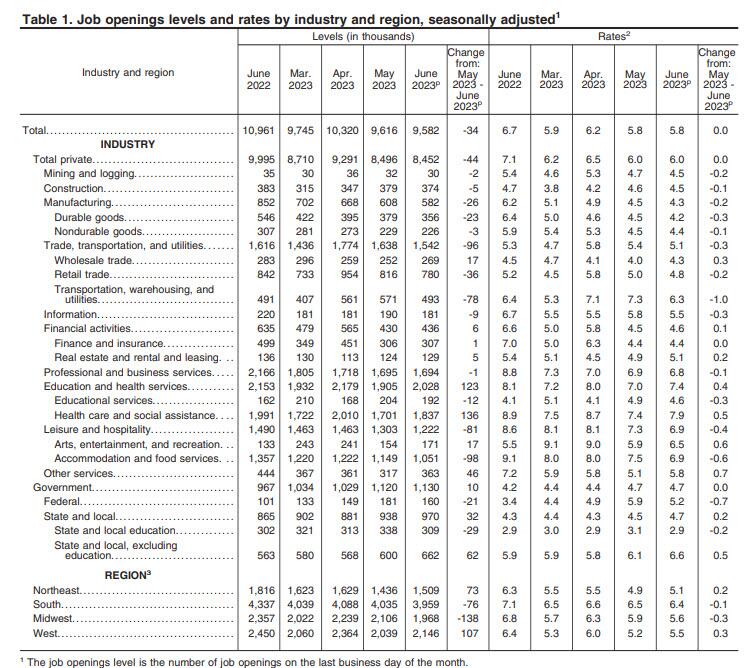
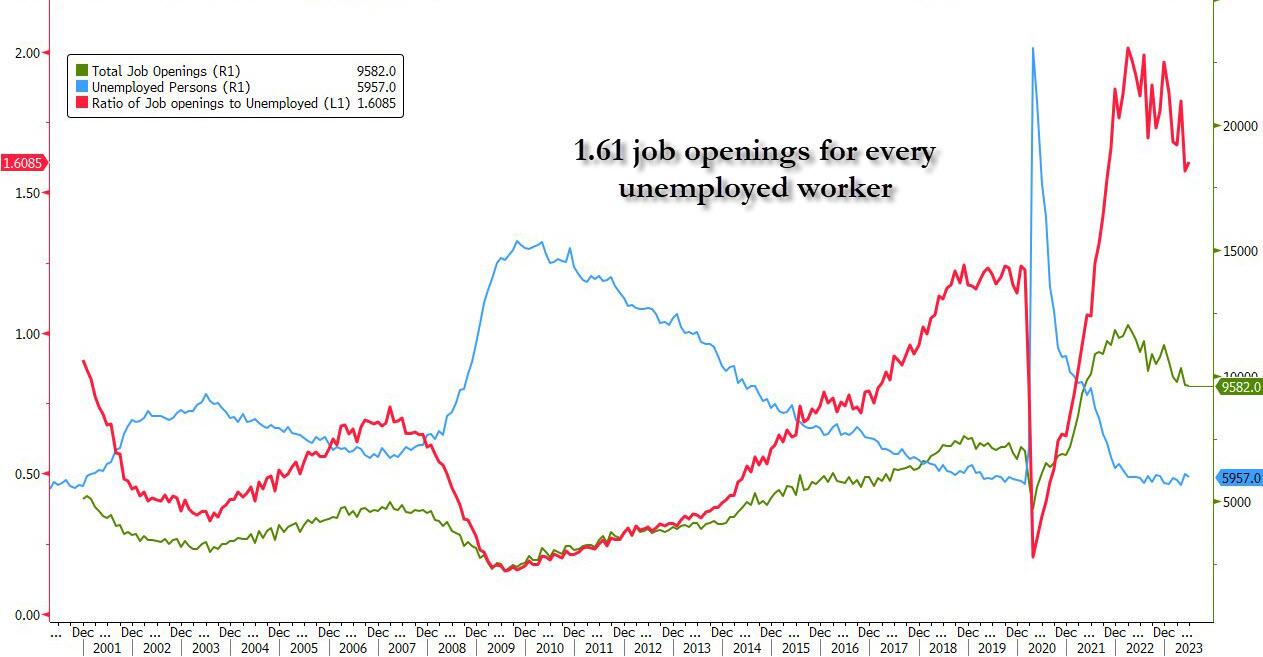
The number was about 1.4 million below the 11 million from a year ago and below the consensus estimate of 9.6 million, a rare miss in a series which has been best known for decisively beating Wall Street’s expectations.
According to the BLS, the largest increases in job openings was in health care and social assistance (+136,000) and in state and local government, excluding education (+62,000). Job openings decreased in transportation, warehousing, and utilities (-78,000), state and local government education (-29,000), and federal government (-21,000)
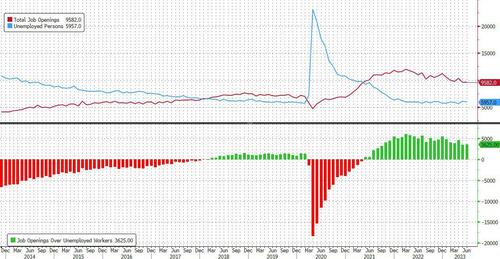
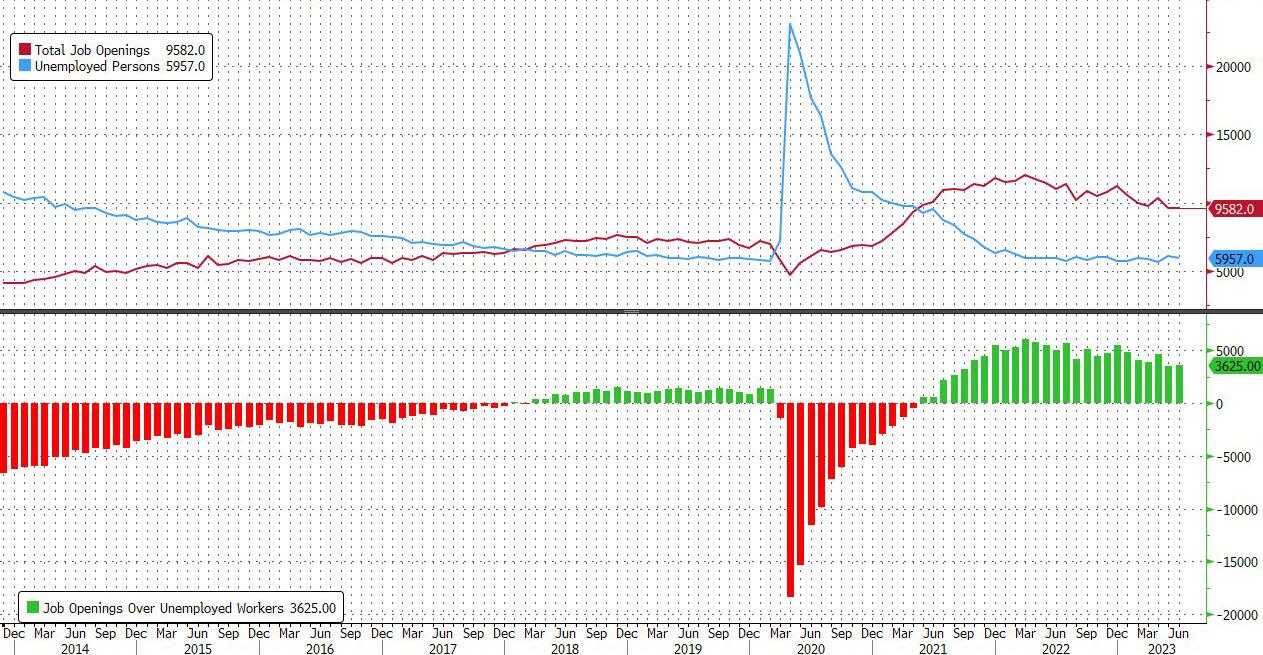
The slide in the number of job openings meant that after rising to the highest since January 2023 in April, in June the number of job openings was just 3.7625 million more than the number of unemployed workers, the lowest since Sept 2021.
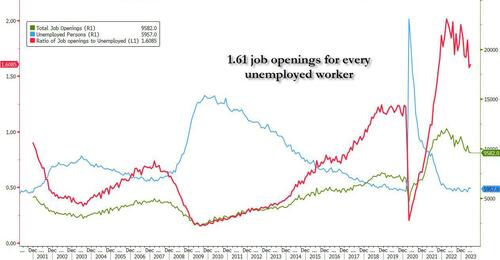
Said otherwise, after rising to 1.82 openings for every worker in April, in June the number dropped to just 1.61, which would have been the lowest level since Oct 2021 if it weren’t for last month’s sharp downward revision.
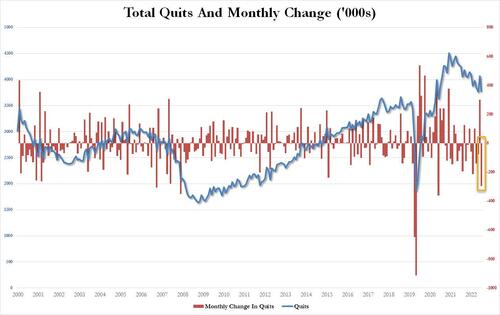
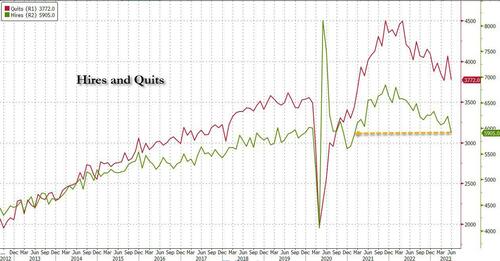
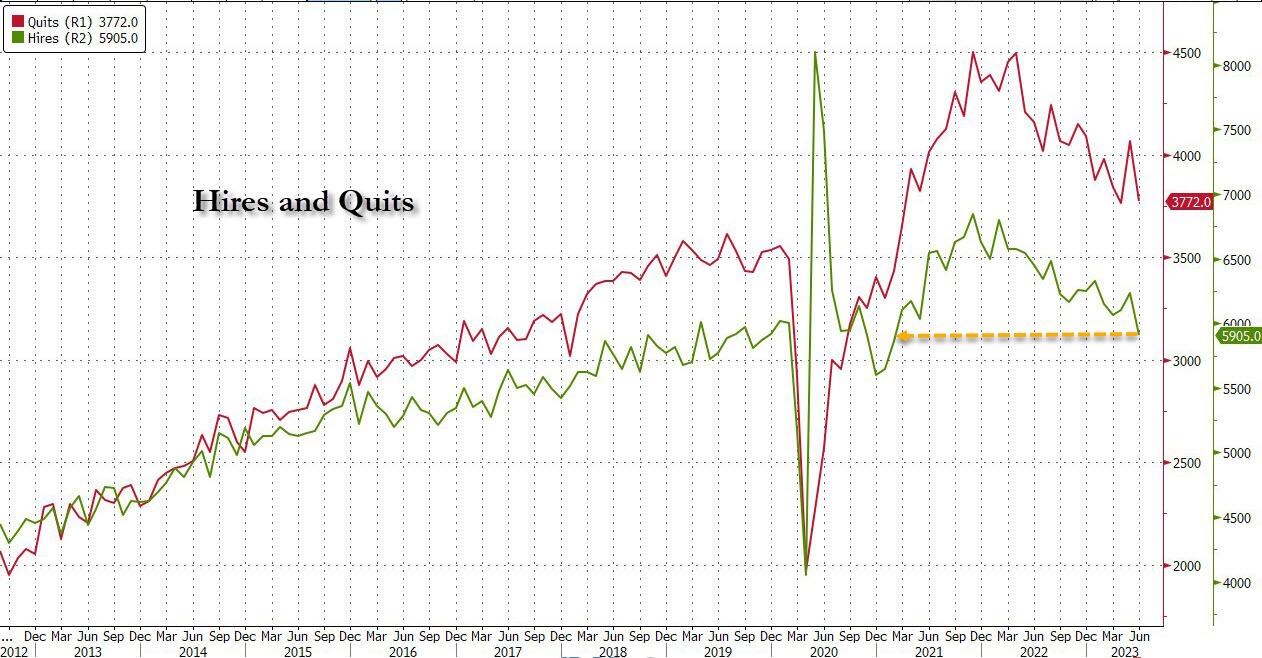
Yet even as the number of job openings dropped only modestly from the (sharply) downward revised print for May (because under Biden, no number is ever revised stronger), conflicting data remained and in June, the number of people quitting their jobs – an indicator traditionally associated with labor market strength as it shows workers are confident they can find a better wage elsewhere – unexpectedly tumbled by 295K to just 3.772MM, the biggest monthly drop since May 2021.
According to the BLS, the number of quits decreased in several industries, with the largest decreases in retail trade (-95,000), health care and social assistance (-75,000), and construction (-51,000). The number of quits increased in arts, entertainment, and recreation (+20,000).
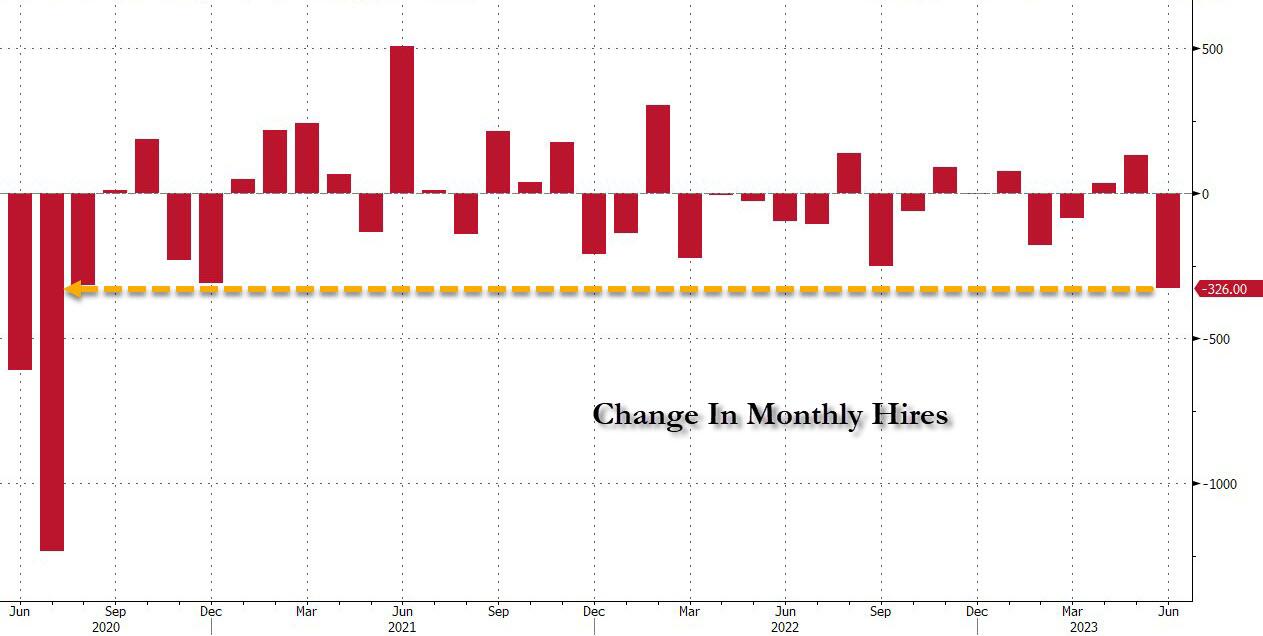
And just in case some still believe Biden’s strong jobs lie, the number of hires also tumbled in June, crashing by 326K – the biggest monthly drop since July 2020…
… to 5.905MM, the lowest since February 2021.
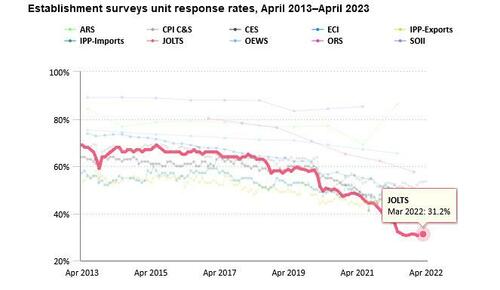
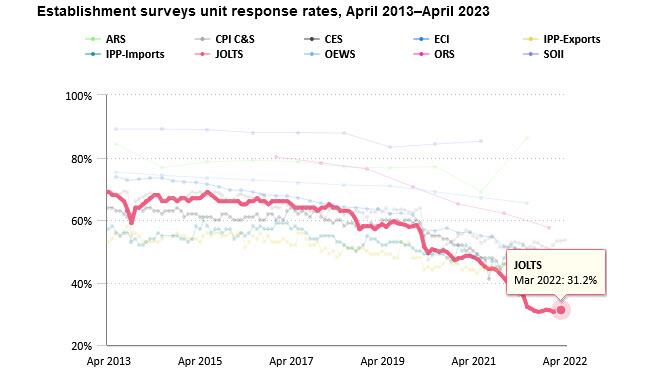
Of course, as we have explained on multiple occasions previously, none of the above data actually matters or is credible for the simple reason that the response rate of the JOLTS survey is stuck at a record low 31.2%. Which means that only those who actually have job openings to report do so, while two-thirds of employers are either non-responsive or their mail is quietly lost in the mail.
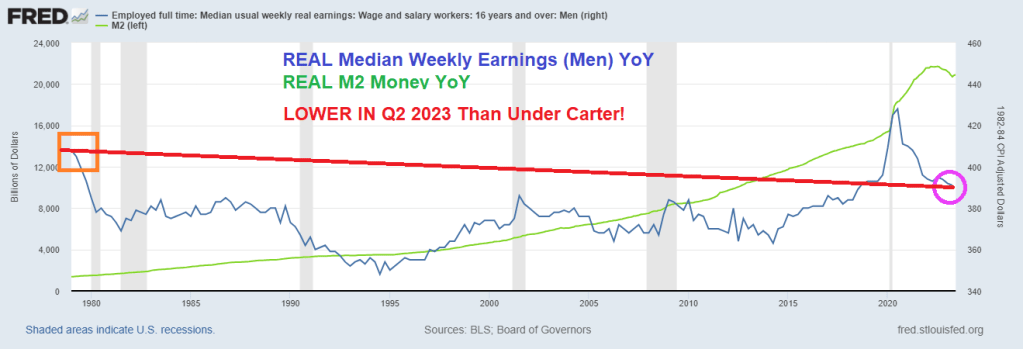
President Jimmy Carter is usually the bar for terrible Presidents. Under Carter, the US experienced economic stagnation and soaring inflation. At least it led to the election of Ronald Regan!
So, Biden’s much mentioned Bidenomics have produced REAL MEDIAN WEEKLY EARNINGS FOR MEN that is currently below 1979 levels under Jimmy Carter.
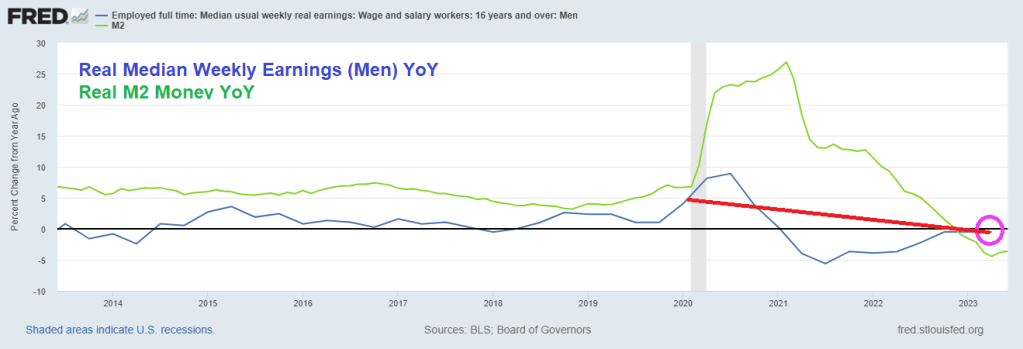
Even worse for Bidenomics, REAL MEDIAN WEEKLY EARNINGS GROWTH FOR MEN was -4.45% In April 2023, while the last reading prior to Covid under Trump was 6.674% YoY in February 2020. So, Bidenomics isn’t even back to Trump levels for men.
I like this chart which I call “Yellenomics” because it illustrates The Fed’s Folly of money printing and its impact on real earnings. After the Trump wage growth boom, real median weekly earnings for men has been steadily declining.
Women, on the other hand, did show a gain since Carter, but still lower than the last month before Covid struck. Women’s real median weekly earnings growth YoY since Q2 2021 are down -5%. So, Bidenomics has been less sucky for women than men.
Reminds me of The Yardbird’s classic “I’m A Man.” Worse off under Biden than under Jimmy Carter. Although The Yardbird’s “Over Under Sideways DOWN” is more emblematic of Bidenomics.
Bidenomics should be renamed Corruptionomics given Biden’s habit of selling government influence to anyone willing to waive a few million.
One of the casualties? Yellow trucking. Carrier Yellow Corp. ceased all operations at 12 p.m. Sunday, according to a notice on the gates at its terminals. Its stock price is now sub $1.
On Friday, Yellow laid off most of its nonunion employees in areas like customer service, information technology and sales. The company stopped making pickups earlier in the week and has been delivering the remaining freight in its network ahead of what appears to be a permanent closure.
After months of negotiations with its Teamsters workforce, the carrier has been unable to reach terms over proposed operational changes it has said were required for its survival. In a breach of contract lawsuit filed last month regarding the matter, the company said it could be out of cash as soon as mid-July.
Most are expecting Yellow to announce it will file for bankruptcy Monday.
Not surprising given the disastrous earning per share. The culprits? High energy costs and a hostile Teamsters Union (labor costs and practices).
A closer look at Yellow’s earning per share deterioration as Biden’s energy folicies has taken hold and crushed the life out at Yellow Trucking.


You must be logged in to post a comment.