The Biden/Harris economy is a disaster.
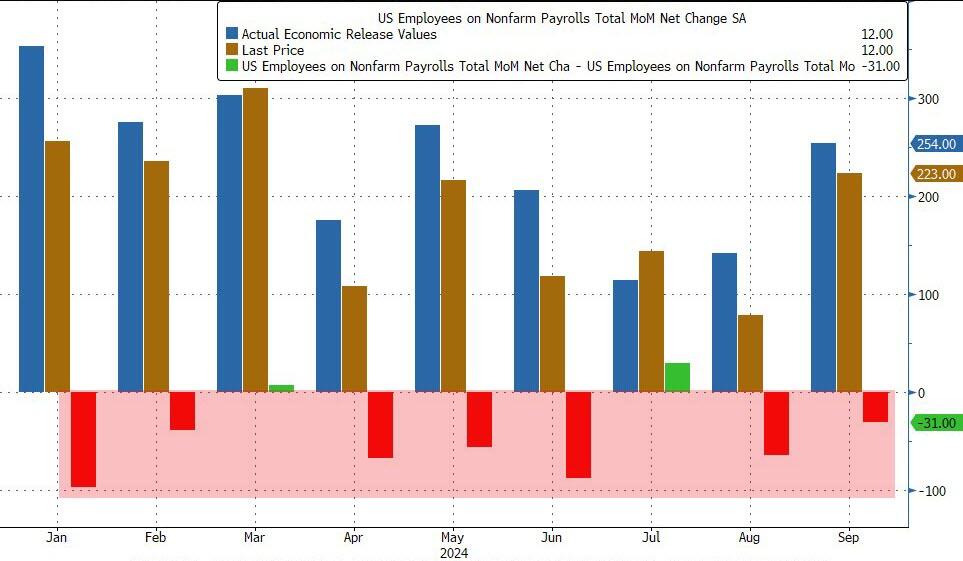
After last month’s catastrophic JOLTS report, which was a disaster across the board, and which was meant to give the Fed a green light to cut rates more after Biden won the election (which he didn’t, but the Fed still had to cut even if Trump is now in control), some speculated that Biden’s Department of Labor will do everything in its power to sabotage further rate cuts by the Fed, most notably the upcoming December decision in two weeks time, by pushing out much stronger than expected economic data. That’s precisely what happened moments ago when the DOL reported that in October, the number of job openings in the US soared by a whopping 372K, the biggest monthly increase since August 2023, to 7.744 million from 7.372 million.
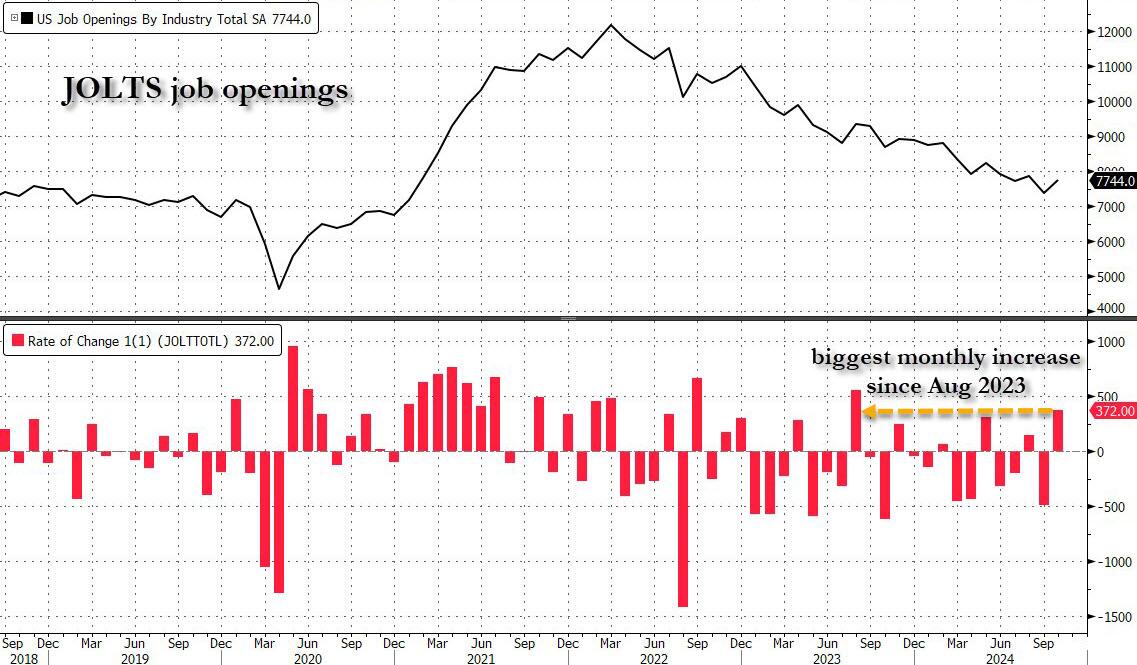
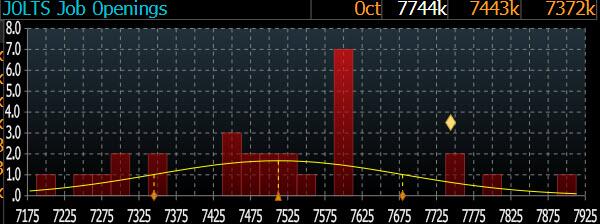
The JOLTS print smashed the median estimate of 7.519 million by 225K…

… with just 4 analysts (out of 28) predicting a higher job openings number.
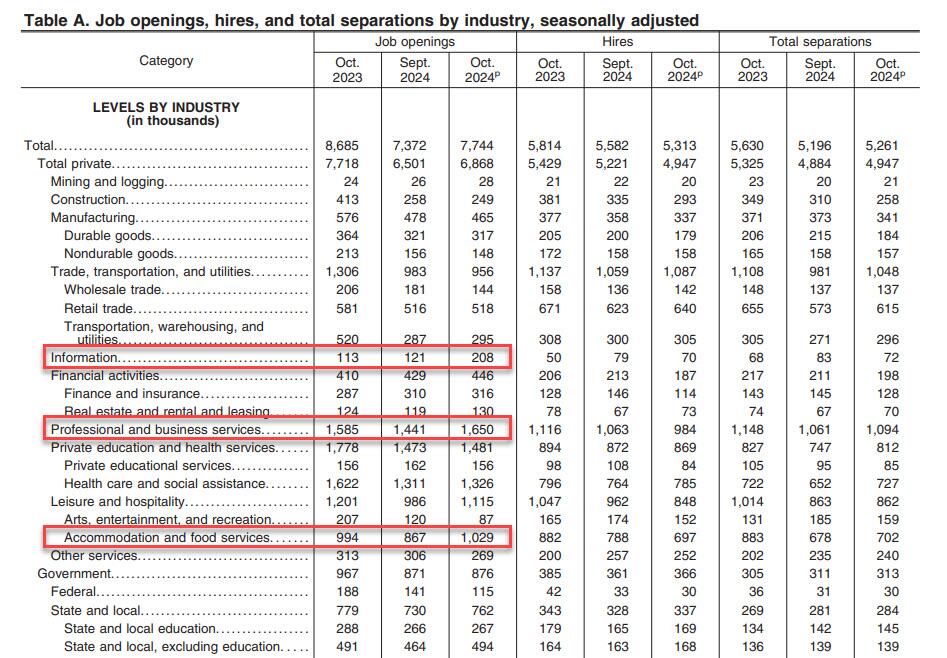
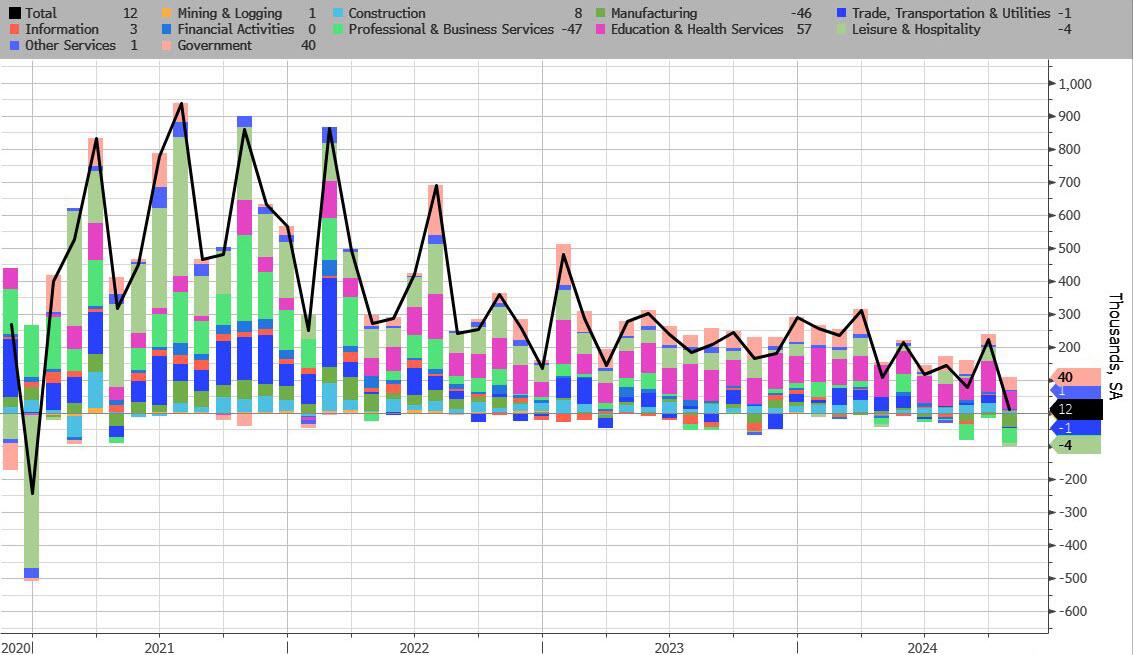
According to the DOL, the job openings rate, at 4.6 percent, changed little over the month. The number of job openings increased in professional and business services (+209,000), accommodation and food services (+162,000), and information (+87,000) but decreased in federal government (-26,000).
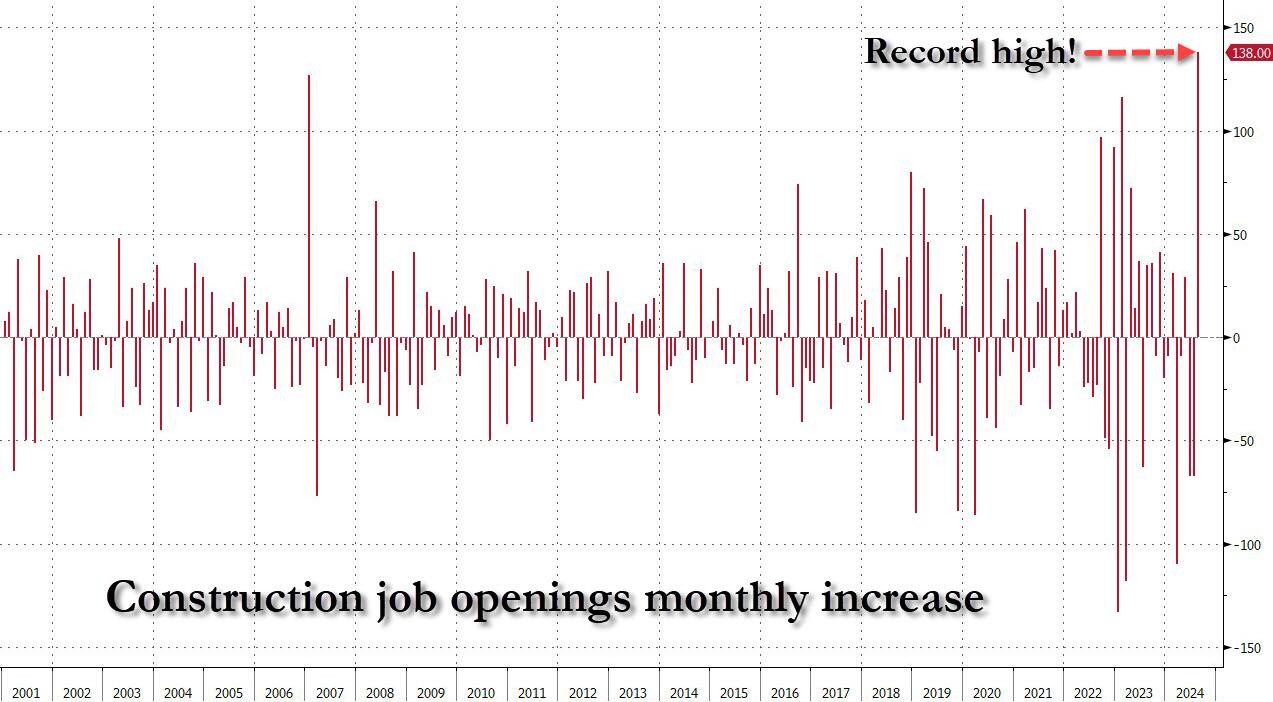
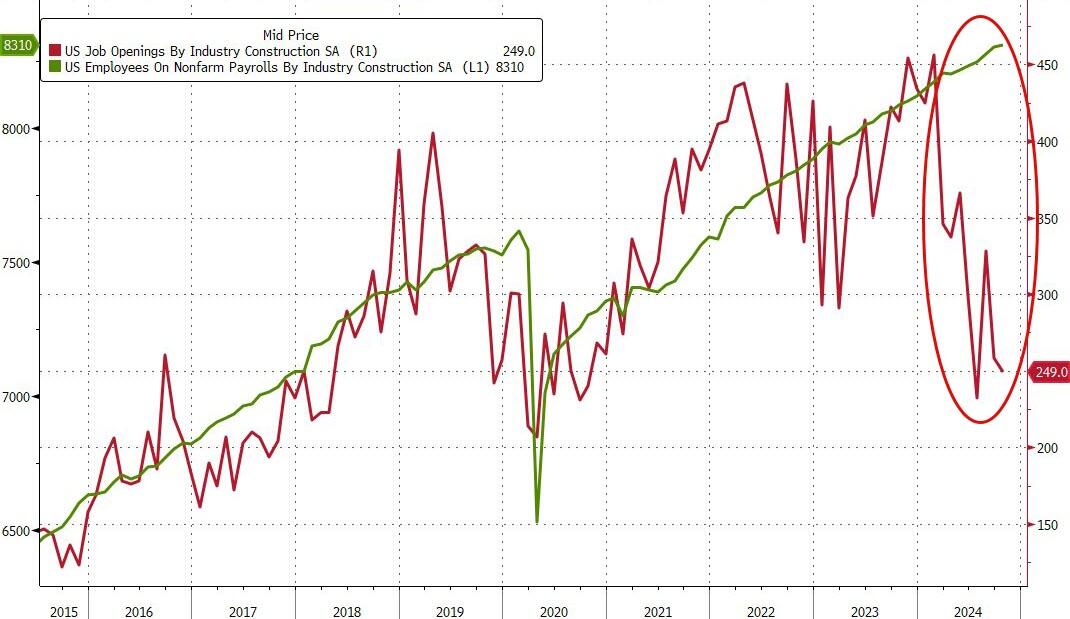
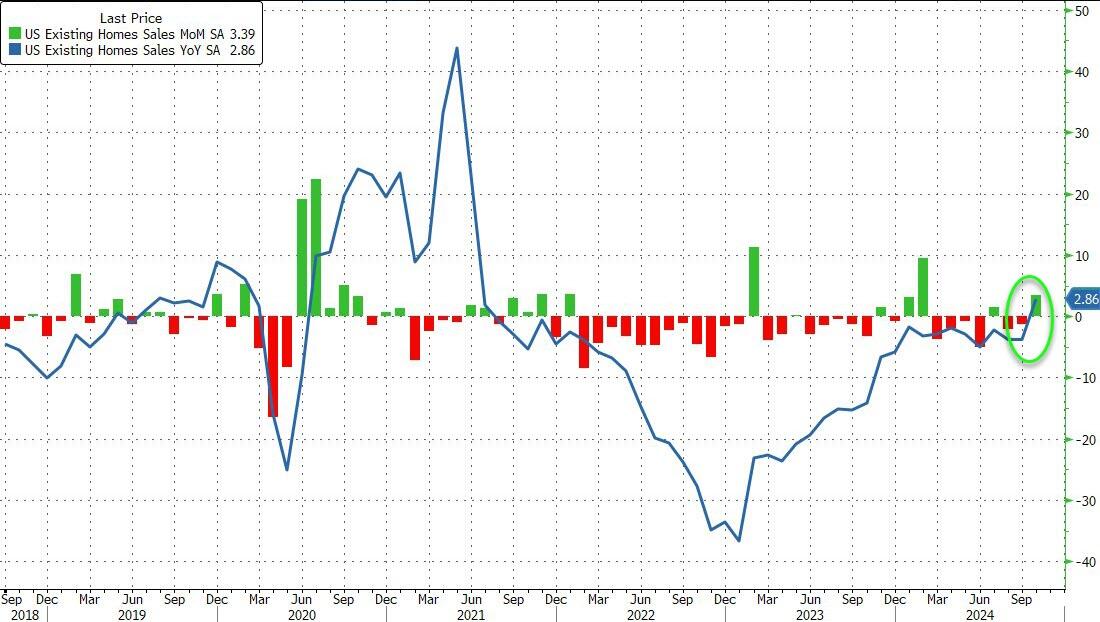
Amusingly, after we mocked two months ago the stunning surge in construction job openings just as a record chasm had opened between the manipulated number of construction jobs and openings…
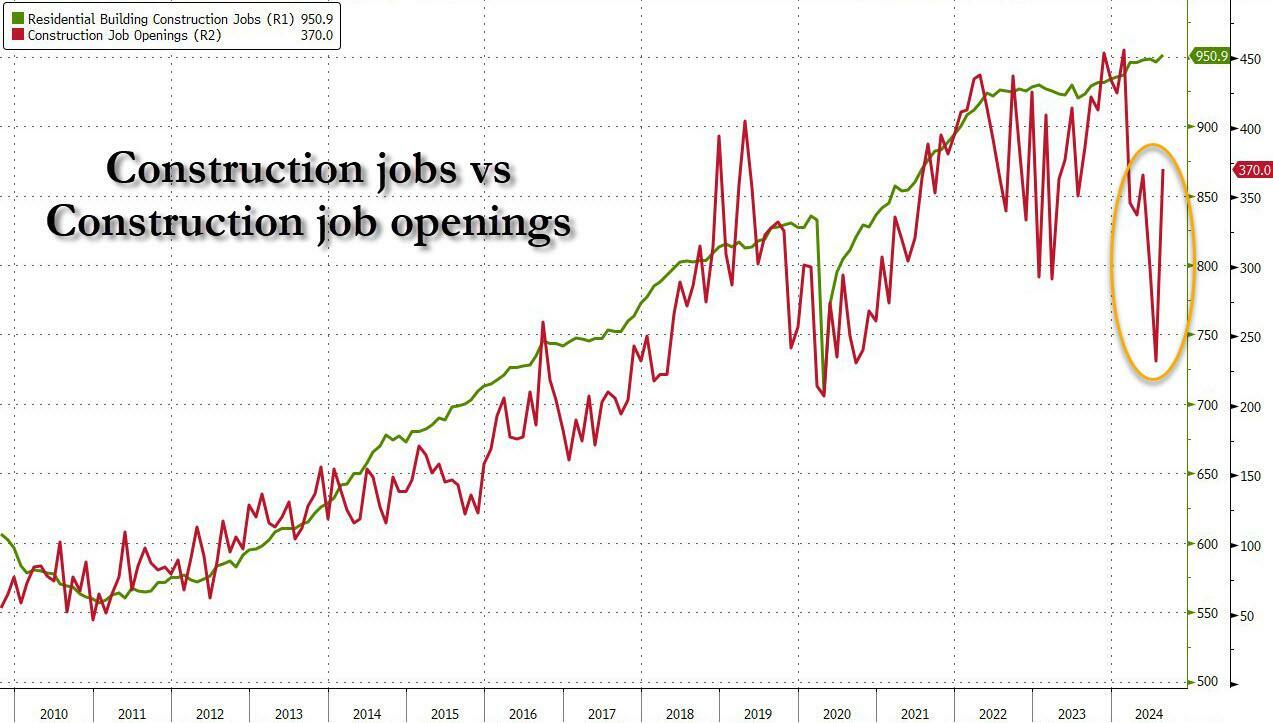
… which meant the biggest monthly surge in construction job openings on record at a time when the housing market has effectively frozen thanks to sky high interest rates, a simply glorious paradox of manipulated bullshit data…
… the BLS realized that it had to make an adjustment after getting called out, and Construction Job openings dropped by another 9K to 249K and back to post-covid lows. Oh, and yes, the number of “construction jobs” is about to fall off a cliff just as soon as Orange Man Bad enters the White House.
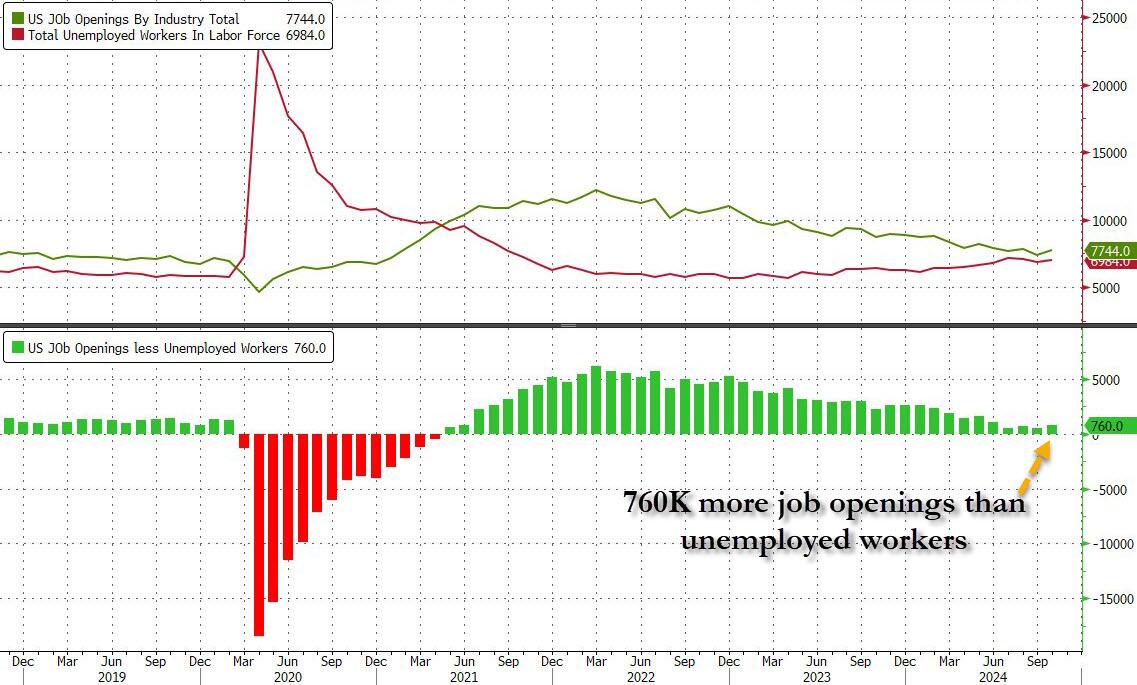
Setting the glaring data manipulation aside, in the context of the broader jobs report, in October the number of job openings was 770K more than the number of unemployed workers, an increase from the previous month and not too far from inverting once again, similar to what happened during the covid crash.
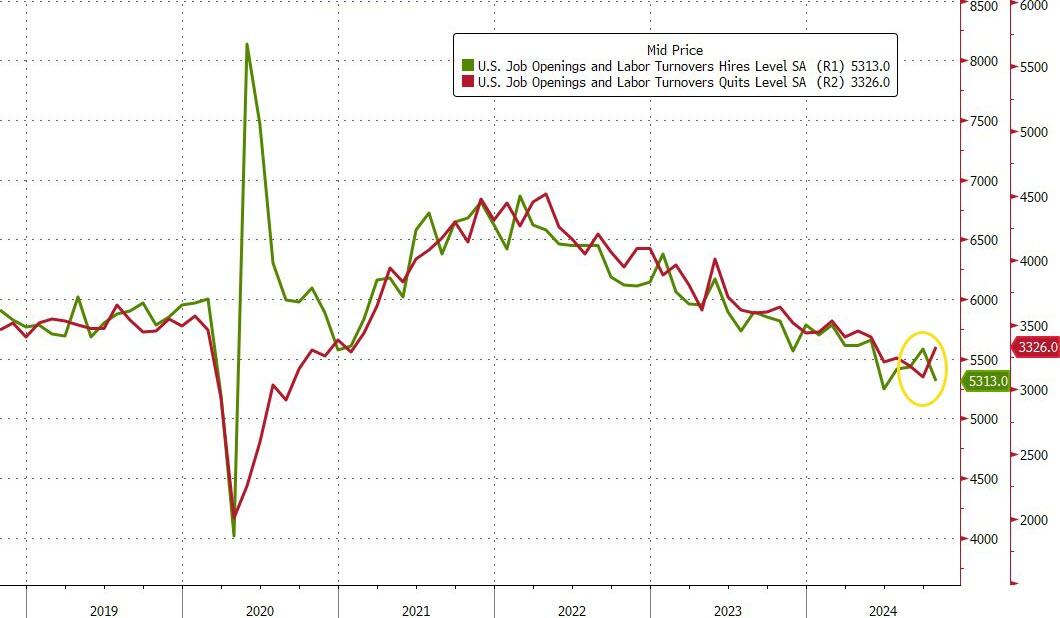
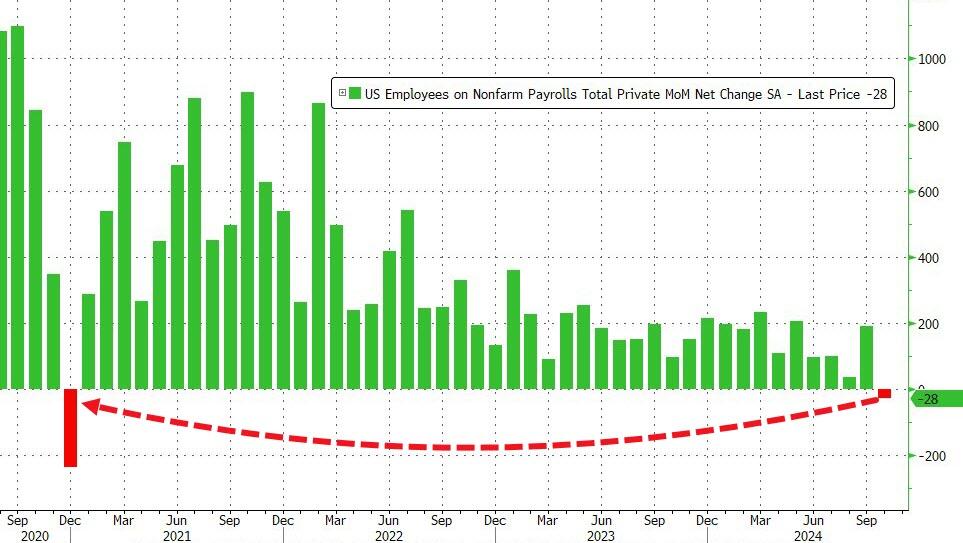
But while the job openings surge was a surprising reversal of the deteriorating trend observed for much of 2024, where even the DOL was stumped was the number of hires, which tumbled from 5.582 million to 5.313 million, a new post-covid low.
Commenting on the plunge, SouthBay Research notes that “hiring was weak in October and the last time hiring was this low was June and NFP slowed to 118K. But remember that this data aligns with the October Payroll data – not November’s. Both October NFP and the latest October JOLTS Hiring data cover the same period (through mid-October).” Furthermore, there were an additional 4 weeks since this JOLTS survey and hurricane recovery (aka hiring) rebounded. In addition, as the Job Openings indicate, employer intent to hire was already underway when this survey was completed.
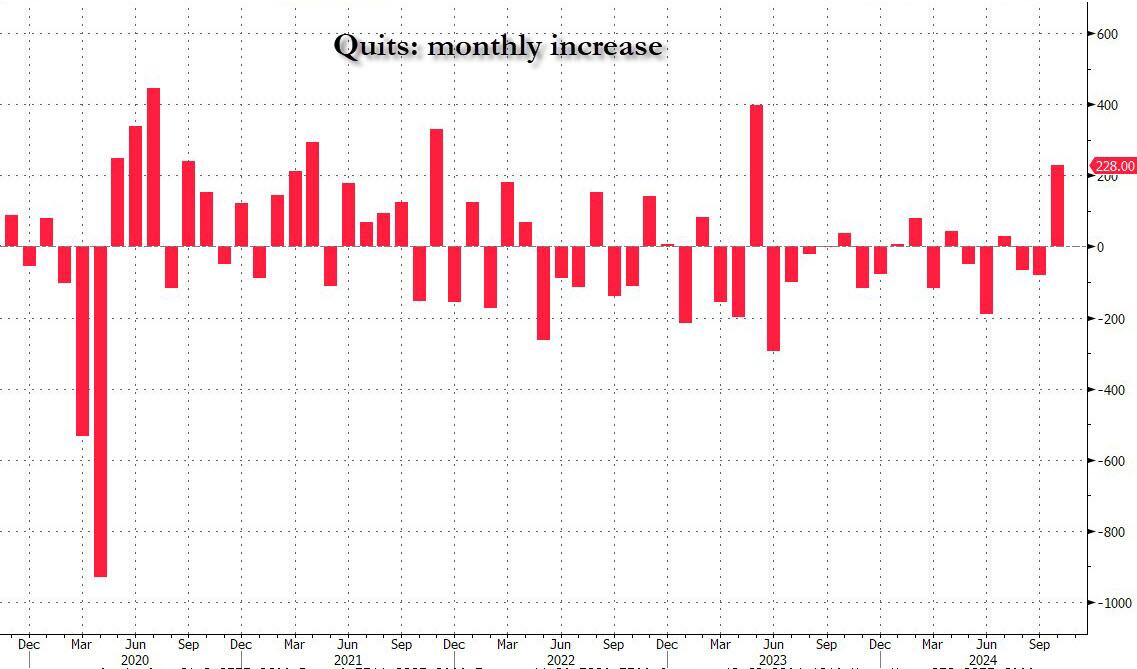
Meanwhile, the drop in hiring was offset by a surprise spike in the number of Quits, which rose by 228K from 3.098MM to 3.326MM, the biggest increase since May 2023, with quits increasing in accommodation and food services (+90,000).
Finally, no matter what the “data” shows, let’s not forget that it is all just estimated, and it is safe to say that the real number of job openings remains still far lower since half of it – or some 70% to be specific – is guesswork. As the BLS itself admits, while the response rate to most of its various labor (and other) surveys has collapsed in recent years, nothing is as bad as the JOLTS report where the actual response rate remains near a record low 33%
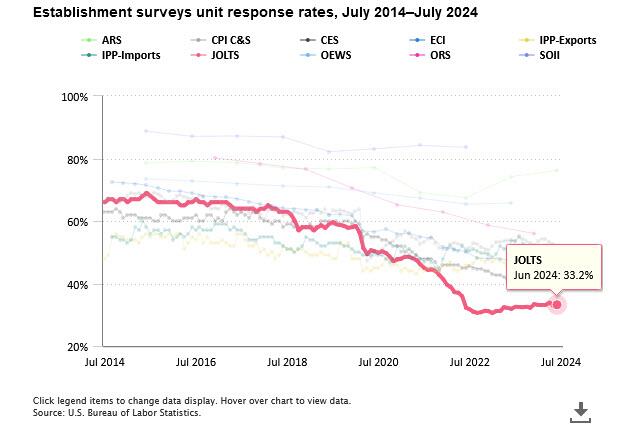
In other words, more than two thirds, or 67% of the final number of job openings, is made up!
Looking ahead to Friday’s November Nonfarm Payrolls, the report will be driven by hurricane recovery, with the JOLTS data pointing to a lot of weakness in exactly the areas October Payrolls slipped. As for organic hiring, there have been no anecdotal signs of hiring pullback heading into November. On the contrary: businesses seem to be inclined to ramp up a bit, now that Trump is president and promises a dramatic easing of regulations.


You must be logged in to post a comment.