Mortgage applications decreased 6.5 percent from one week earlier, according to data from the Mortgage Bankers Association’s (MBA) Weekly Mortgage Applications Survey for the week ending June 3, 2022. This week’s results include an adjustment for the Memorial Day holiday.
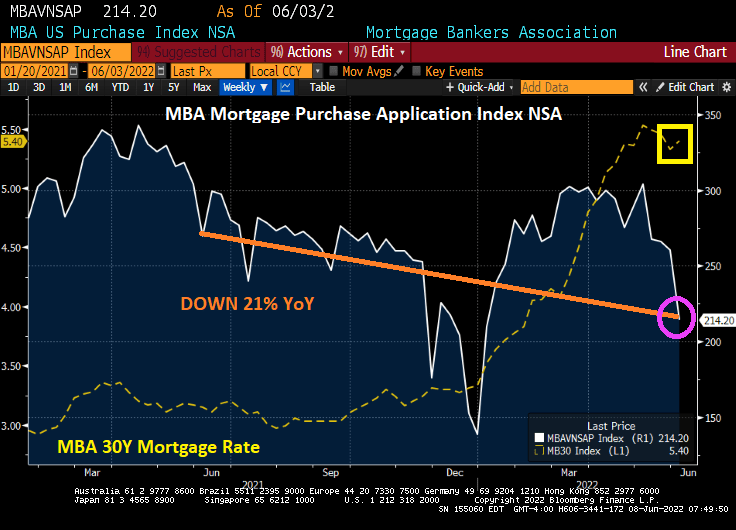
The seasonally adjusted Purchase Index decreased 7 percent from one week earlier. The unadjusted Purchase Index decreased 18 percent compared with the previous week and was 21 percent lower than the same week one year ago.
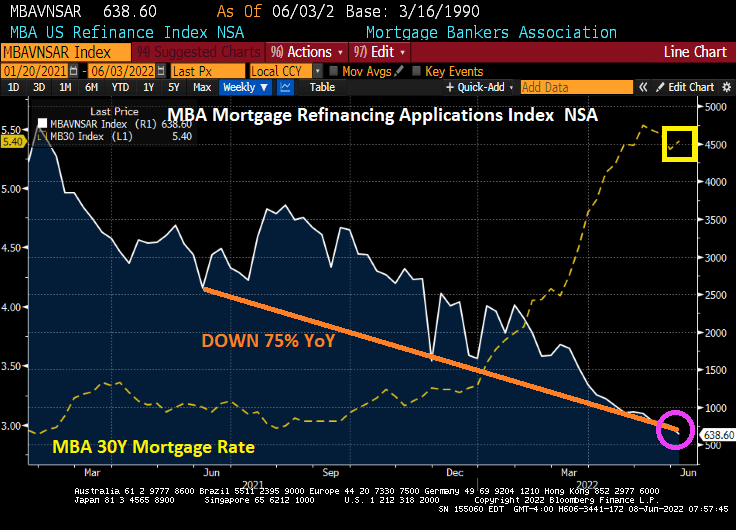
The Refinance Index decreased 6 percent from the previous week and was 75 percent lower than the same week one year ago.
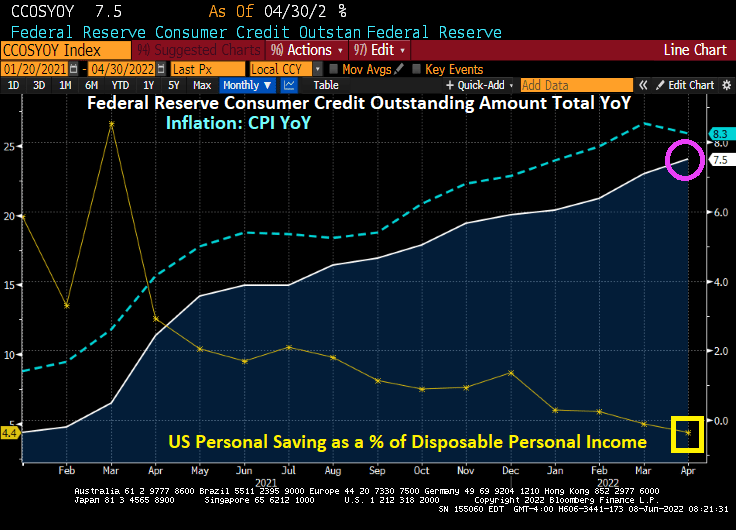
In related news (debt), consumer debt is rising at 7.5% YoY while the personal savings rate plunged to 4.4% in May as consumers borrow more and save less to cope with inflation.
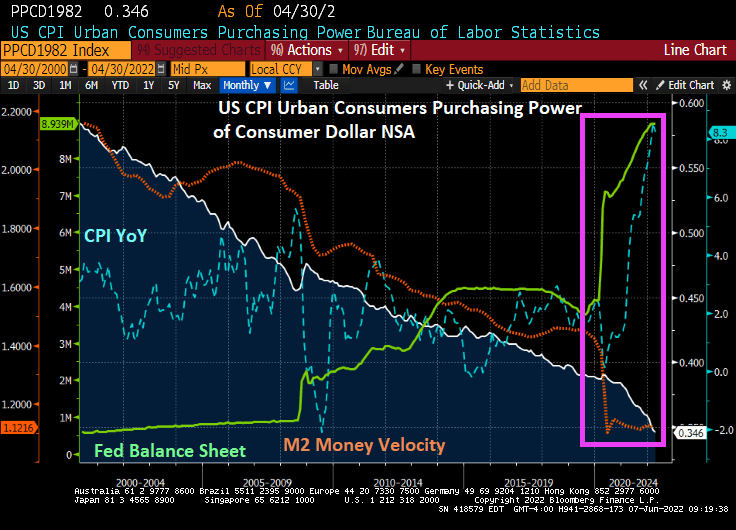
Here is my version of their chart since 2000 where you can seen the seismic shift in the balance sheet (toxic green slime line), particularly with The Fed’s response to Covid. The Fed is signaling a tightening in monetary policy to help reduce inflation (blue line).
But notice that M2 Money Velocity (GDP/M2) is now near the all-time low along with consumer purchasing power.
How BIG is The Fed’s balance sheet? Try more that a third of size of US GDP.
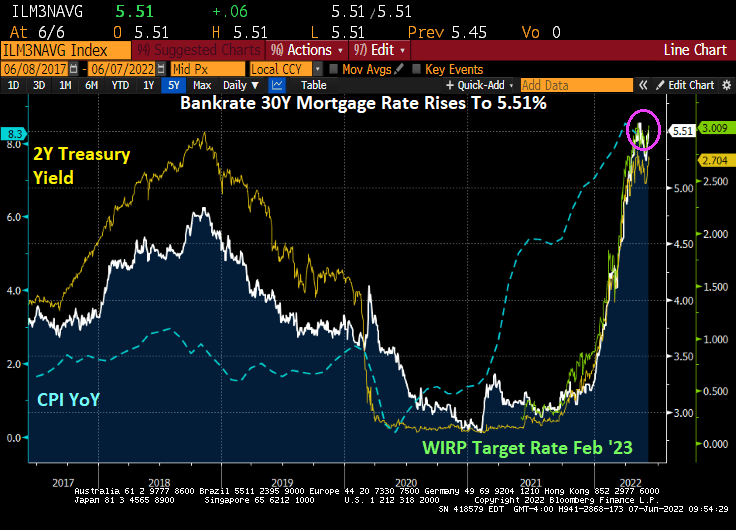
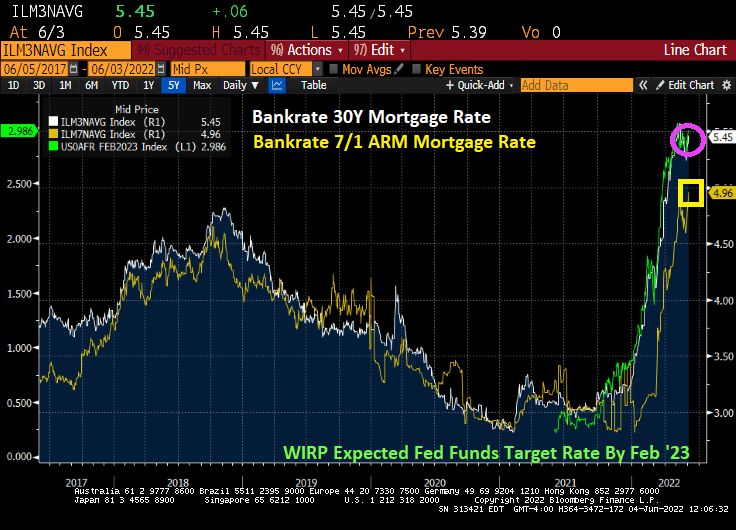
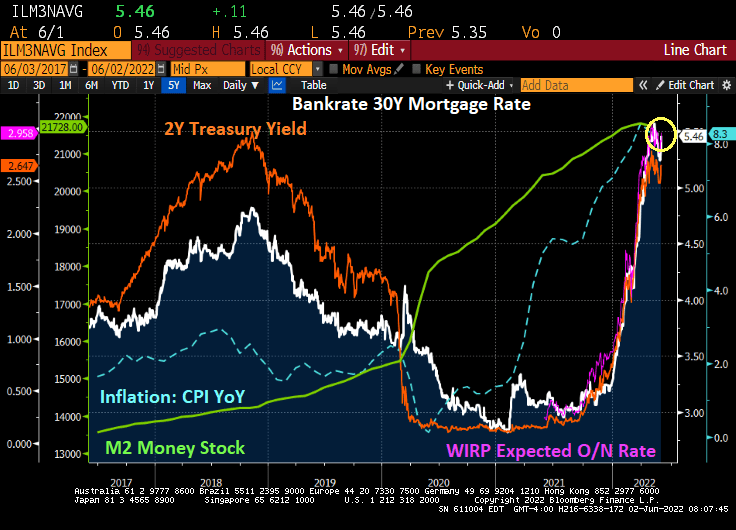
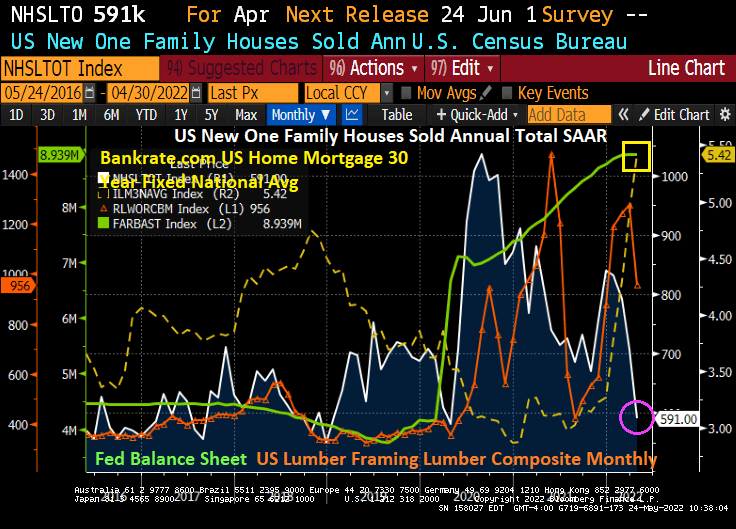
And as The Fed signals its inflation-fighting intentions, mortgage rates have shot up to 5.51%, the highest mortgage rate since June 2009.
You better hope it doesn’t get Cold Outside. Because the cost of heating your house just rose 5.74% this morning (natural gas futures). To $9.01.
Between Biden’s anti-fossil fuel policies and the war in Ukraine, natural gas futures are up 255% under Biden.
With rising natural gas prices, one would think American consumers and American home builders would start building higher-density housing like duplexes.
But The Federal Reserve has helped America build BIGGER houses (as in greater square footage).
Note that following the financial crisis and the takeover of the US economy by The Fed, median square footage of US housing starts rose with Fed easing. Median square footage started falling as The Fed leveled-off its asset purchases (green line). But when Covid struck and The Fed really went to town (aka, monetary stimulypto), median square footage started rising again.
The above chart demonstrate the conflict that can arise between a Presidential Administration and The Federal Reserve. President Obama wanted more green apartments built and less suburban growth, but thanks to The Fed, we got median square footage of new builds rising. But once The Fed took its enormous foot off the monetary accelerator pedal, median square footage started falling. Then Covid struck, The Fed intervened, and median square footage rose again.
But with alleged Fed monetary tightening, we should should see the demand for larger homes decline relative to smaller homes.
Mortgage rates have been climbing rapidly, making housing acquisition relatively less affordable.
Black Knight’s monthly P&I payment to average purchase price says it all.
My version of the Black Knight chart is slightly different, but tells the same story: home prices and mortgage rates are rising FAST with Fed stimulus, but should slow down.
The Fed has helped make housing not only more expensive, but larger in size. And the Biden Administration and war has helped make heating those large houses more costly.
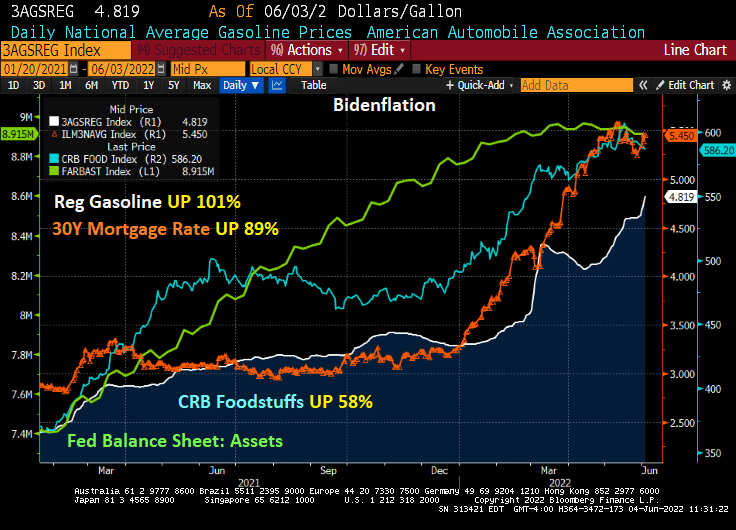
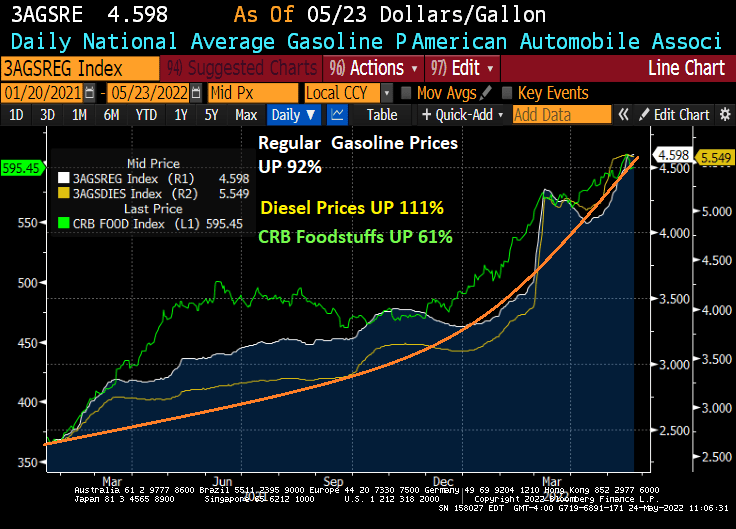
This is not the legacy that will endear President Biden to voters. Regular gasoline prices have risen 101% under Biden.
But it not just gasoline and diesel that are soaring (while the rest of us are sore!), CRB Foodstuffs are up 58% under Biden while the 30-year mortgage rate is up 89% under Biden.
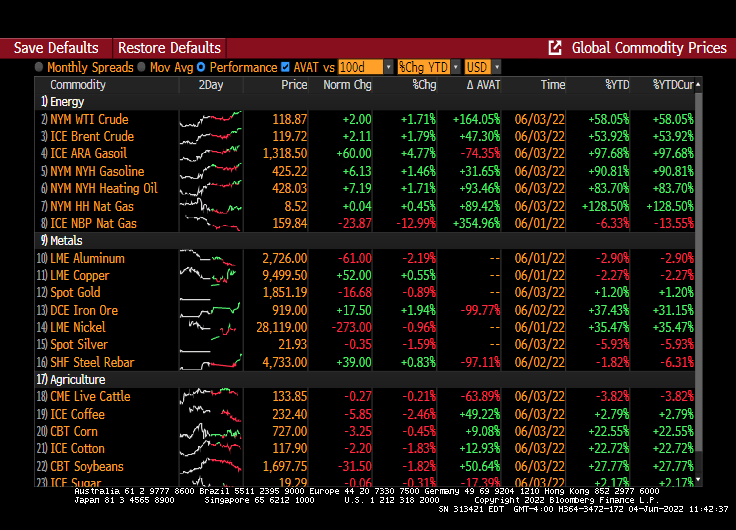
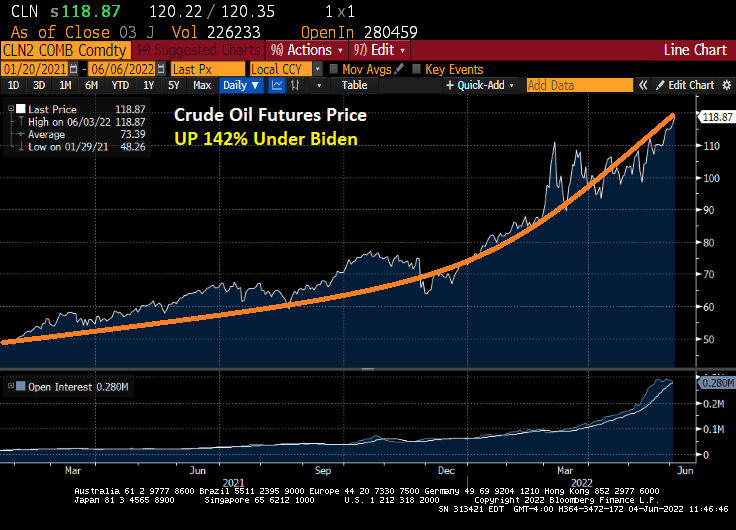
And this morning, WTI crude futures are up +1.71%.
And up 142% under Biden.
Prices are sizzling and clobbering the American middle class and low wage workers. But former Federal Reserve Chair and current US Treasury Secretary Janet Yellen never saw it coming.
Biden’s just killing us. And Powell is making up for Yellen’s keeping monetary stimulus too high for too long. Price? Mortgage rates are soaring.
Instead of President Ronald Reagan saying ““Mr. Gorbachev, tear down this wall” we need someone to tell President Biden and Federal Reserve Jerome Powell to “Stop driving up prices and making housing unaffordable.” Unfortunately, The Fed thinks that raising interest rates will temper price increases — it won’t. But it could tamper home price growth.
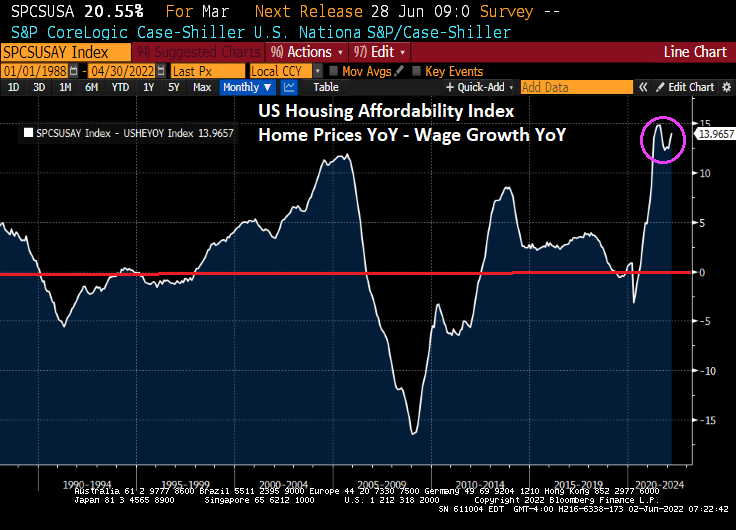
So what we are left with is soaring home prices AND soaring mortgage rates, leaving this scary chart. The housing cost index has risen 114.5% under Biden.
Its only going to get worse from here.
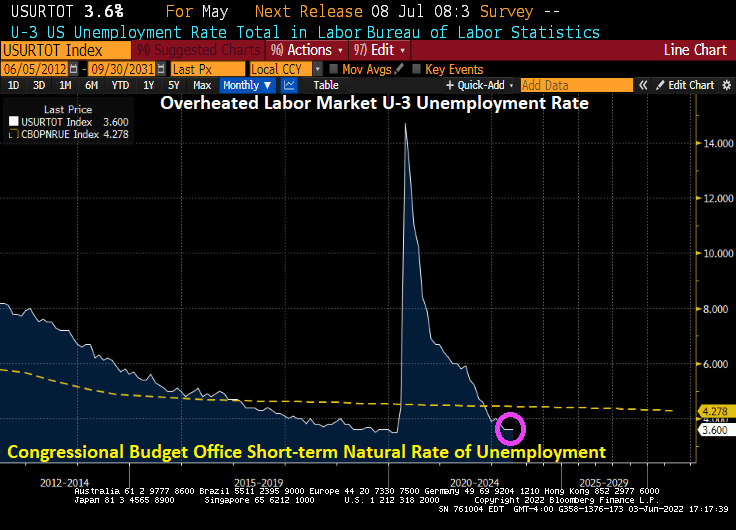
Today’s jobs report for May showed that the U-3 unemployment rate remained the same as April, 3.60%. However, that is lower than the NATURAL rate of unemployment of 4.445% indicating that the labor market is overheated. Historically, The Fed has tightened monetary policy by raising rates when this has happened. So, look for The Fed to keep raising rates.
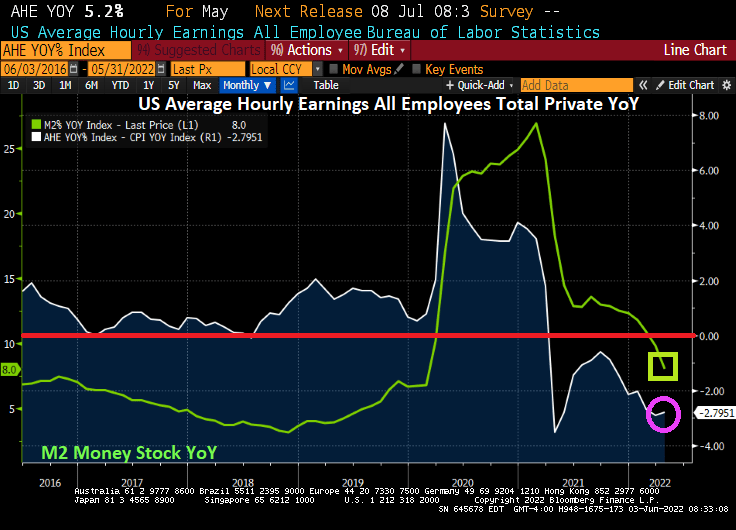
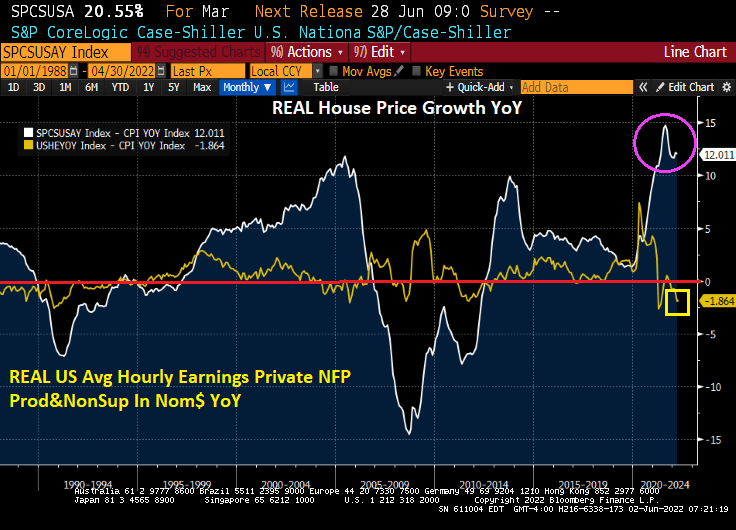
As I have mentioned before, REAL hourly wage growth is negative since March 2021, just after Biden signed his executive orders canceling drilling on Federal lands and cancelling the Keystone Pipeline. Later, he canceled off-shore drilling permits and Alaska drilling. Now we have REAL average hourly wages declining at -2.8% YoY as The Fed has been reducing M2 Money supply YoY.
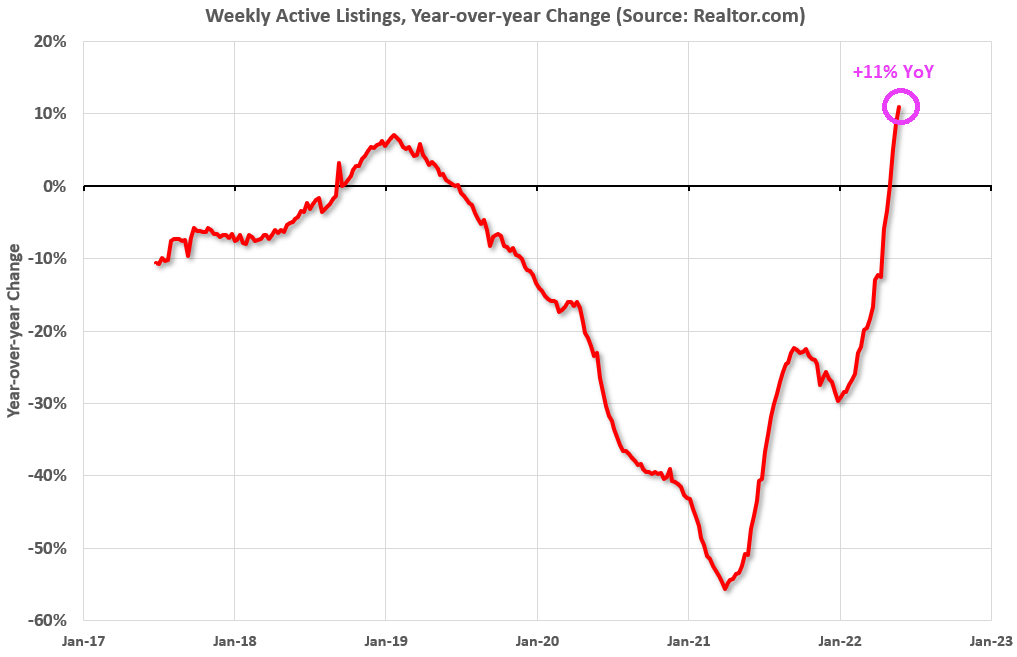
Listings of homes is up 11% YoY, the highest in several years.
Let’s see how the housing market does with soaring mortgage rates.
President Biden met with Federal Reserve Chairman Powell to discuss how to control the inflation that is crushing the middle class and low-wage workers.
Here is a good example of why Biden is worried. There is a mid-term election on the horizon and people are angry and scared. Housing, generally the largest asset owned (or rented) by a household is simply unaffordable thanks, in part, to the over-stimulation of the economy by 1) The Federal Reserve in terms of money printing and 2) the Federal government in terms of fiscal stimulus in response to the Covid outbreak in March 2020.
In nominal terms, the gap between US home prices (Case-Shiller National Home Price Index YoY – US Average Hourly Earnings YoY) is near the all-time high.
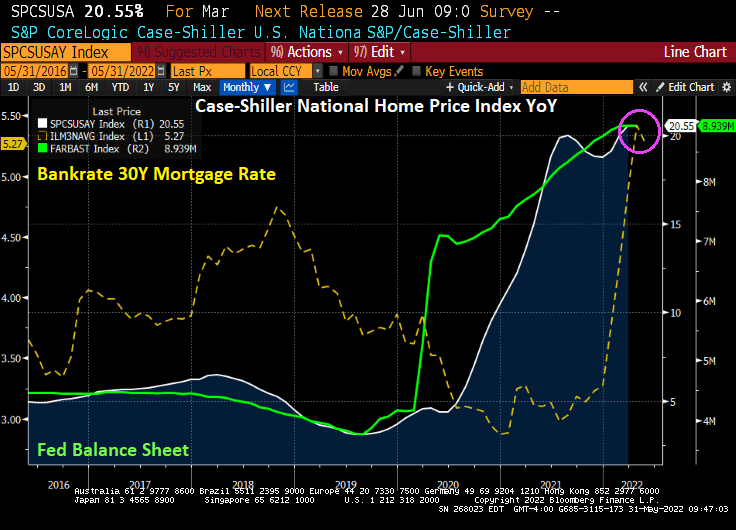
Yes, home price growth exploded upwards when The Fed rapidly expanded their balance sheet in response to the Covid outbreak … and only now are considering shrinking the balance sheet.
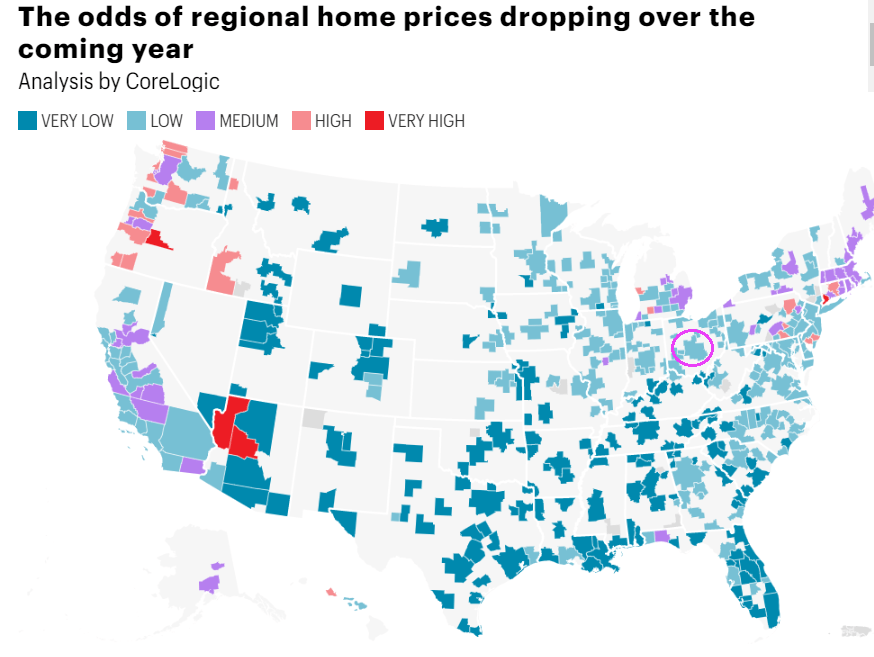
In terms of house prices, CoreLogic has a nice chart depicted the odds of home prices dropping over the coming year. I circled Columbus Ohio because that is where I am moving (knock on wood).
And then we have the 30-year mortgage rate rising with The Fed’s expected tightening of monetary policy. That will certainly make housing even less affordable, unless house price growth cools dramatically.
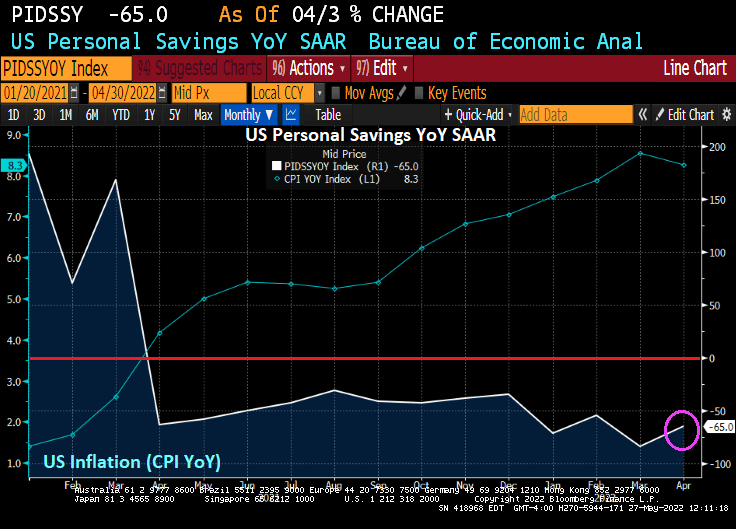
Americans’ Savings Rate Drops to Lowest Since 2008 as Inflation Bites.
Yes, inflation really bites. In fact, as US inflation is near the 40-year high, US personal savings declined -65% YoY as consumers try to cope with rising prices.
Its not only that personal savings is crashing in the face of inflation, revolving debt has soared as consumers try to cope with rising prices. I call this chart “The Biden Bowl.” Soaring consumer credit card debt with crashing personal savings.
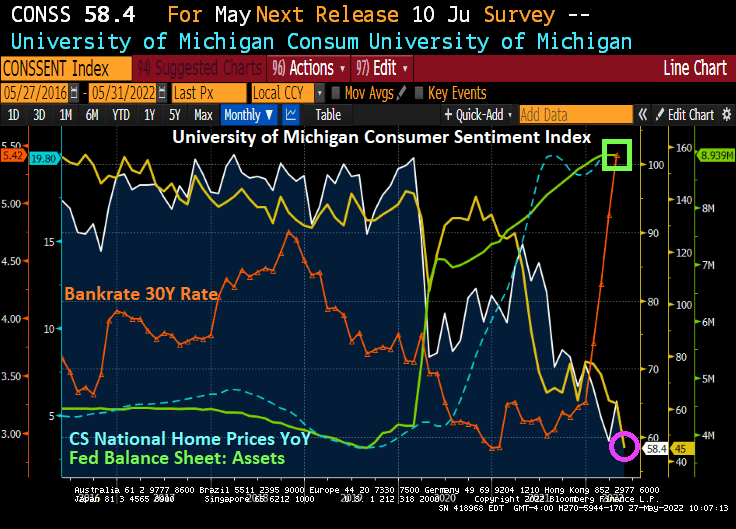
The University of Michigan Consumer Survey showed a decline in May to 58.4 (100 is baseline). Soaring inflation is a likely culprit.
But the truly horrible survey result is the UMich Buying Conditions for Houses, plunging to 45. The reason? Crazy, expensive house prices courtesy of The Federal Reserve and rising mortgages (also, courtesy of The Federal Reserve).
The buying conditions for houses is now the lowest in the history of the University of Michigan consumer survey. In fact, consumer sentiment for housing is far lower than during the awful housing bubble burst of 2008 and the subsequent financial crisis.
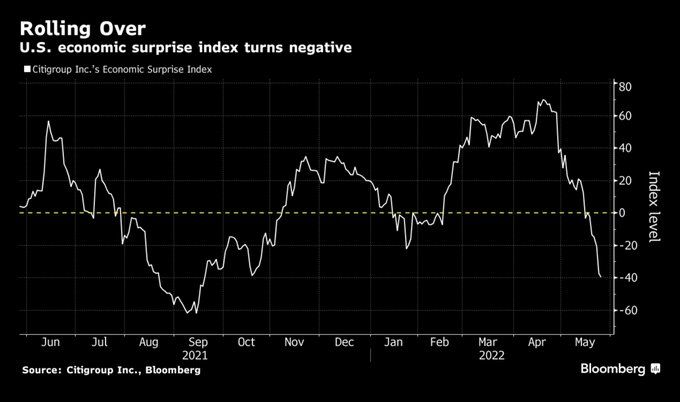
And the US economic surprise index has turned negative.
Here is Fed Chair Jerome Powell wielding his monetary bat called “Lucille.”
I have never seen two Federal entities make such a mess in my life. The Federal Reserve and The Federal government.
The good news? The 10-year Treasury yield is down -12.9 BPS this morning generally resulting in lower 30-year mortgage rates. Of course, the reason why the 10-yield is falling is generally bad news.
The bad news? US New Home Sales fell -16.6% MoM in April as mortgage rates skyrocketed.
Since the installation of Joe Biden as President, new home sales have plunged -31.2%, mortgage rates are up 88.9%, and framing lumber prices are up 29.2%.
Biden is out there bragging about rising energy prices which he views as a necessity to force the conversion of America to electric cars and trucks. Biden is the first President in history to gloat over the suffering of American households.
Under Biden, regular gasoline prices are up 92%, diesel prices are up 111%, and CRB Foodstuffs are up 61%.
Say, framing lumber for housing is cheaper than food. Maybe Biden will suggest Americans transform to being beavers and gnaw on wood.
As The Federal Reserve tries to fight inflation (it can’t thanks to Federal energy policies and bottlenecks), it is causing a disconnect between mortgage current coupon rate and the MBS index coupon. The disconnect is so bad that it is back to 1985 levels.
The Fed can certainly try to cool inflation, but Biden is intent on raising energy prices (leading to food price increases, and everything else) to shift us to electric cars. So, Biden is unlikely to back off.
So, The Fed is left trying to fight a war against inflation that only Biden can fight.
Meanwhile, the US mortgage market is getting pulverized


You must be logged in to post a comment.