The US housing market continues to struggle as The Federal Reserve continues to fight inflation. Today’s pending home sales are another nail in housing casket.
Pending home sales declined -34.4% year-over-year (YoY) as M2 Money growth went negative (-1.3% YoY).
At least UMich buying conditions for housing increased … to 44, well below 100.
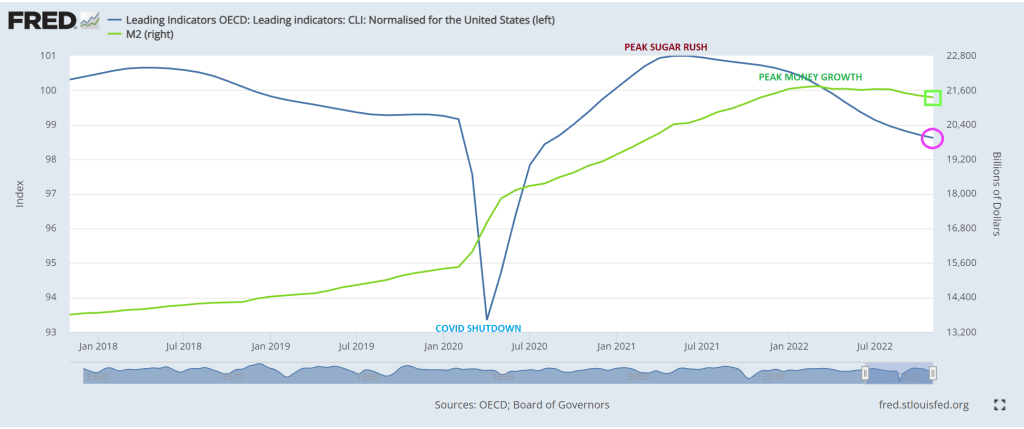
The Conference Board’s Leading Indicator should be called The Bleeding Indicator given that the leading index has declined to 10 straight months. This is happening as The Fed tightens monetary policy to combat inflation.
Leading indicators include economic variables that tend to move before changes in the overall economy. These indicators give a sense of the future state of an economy.
The Thrill Is Gone from the US housing market as M2 Money growth fells to 0%.
US Existing Home Sales fell -1.5% from November to December (MoM) to 4.02 SAAR units sold. That translates to a depressing -34% decline since December 2021 (YoY).
On the positive side, these numbers are better than expected (-3.4% MoM expected). Still, these numbers are pretty dismal.
Existing home sales MEDIAN PRICE fell to $366.9k as M2 Money growth vanishes. And inventory of existing homes for sale remains lower than pre-Covid levels.
Let’s see what Powell and the Gang (aka, The Federal Reserve Board of Governors) does with interest rates going forward.
Today, the 10-year Treasury yield is up 7.1 basis points, but the real action is in Europe where sovereign yields are up 11.5 bps in France, 9.8 bps in Germany and 18.6 bps in Italy.
I watched Biden’s Press Secretary Karine Jean Pierre giving Biden credit for the lowest unemployment rate in US history thanks to his economic policies. And Biden mentioned that he inherited a terrible economy from Trump.
Hmmm.
Let’s let the data talk.
Covid was horrific (I almost died from it), but it was the government response to Covid there was disastorous. Government shutdowns (and the masking of the populace) killed off numerous small businesses and sent jobless claims soaring in 2020 (white line) and U-3 unemployment rate rose to the highest level since The Great Depression.
The response from The Federal Reserve was a massive printing of money (green line). And after governments stopped their economic shutdowns (coupled with massive money printing), we saw jobless claims and unemployment shrink rapidly BEFORE Biden took office as President.
The 1981 recession begat an epic borrowing of money by The Federal government (under House Speaker Tio O’Neill D-MA) and we saw another explosion in Federal debt under House Speaker Nancy Pelosi D-CA TWICE, once in 2009 following the financial meltdown and again in 2020 following the Covid economic lockdowns.
So does Trump get any thanks for the rapidly improving labor market before his ouster by Biden? Of course not. But who gets the blame for the staggering growth in Federal debt? House Speaker Nancy Pelosi.
The US did get positive wage growth under Biden, but due to inflation, American workers have experienced 21 straight months of NEGATIVE wage growth.
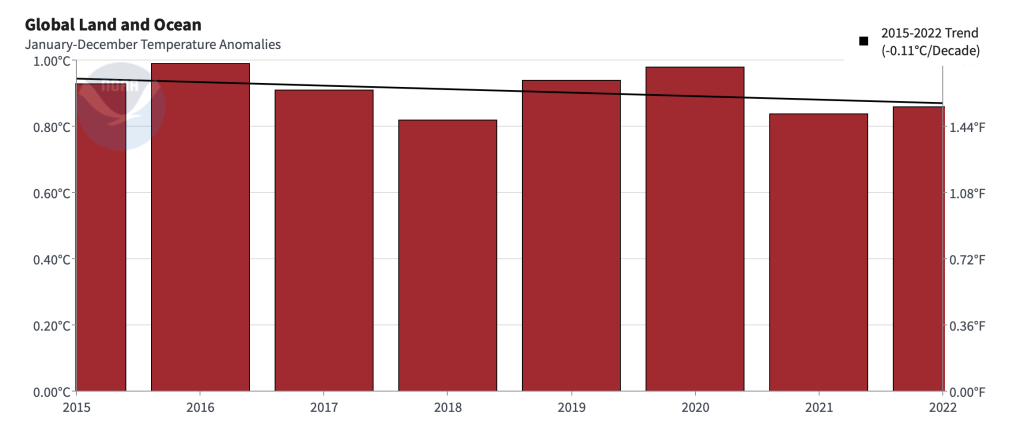
While Trump tried deregulation to free-up the US economy, Biden has consistently used regulation as a weapon of obidience. His slavish obidience to activist groups on the environment, which is a shame since temperatures have actually been coming down since 2016.
When you look at the data, Trump actually set in motion the jobs recovery, not Biden. Other than helping to create inflation, I can’t think of one positive thing Biden has done for the economy.
On an unrelated note, why is US FBI Director Chris Wray at the World Economic Forum in Davos Switzerland when there is a top secret document fiasco going on in DC and Delaware?
Mortgage applications increased 27.9 percent from one week earlier, according to data from the Mortgage Bankers Association’s (MBA) Weekly Mortgage Applications Survey for the week ending January 13, 2023. But mortgage applications are 60% lower than the same week last year.
The Refinance Index increased 34 percent from the previous week and was 81 percent lower than the same week one year ago. The seasonally adjusted Purchase Index increased 25 percent from one week earlier. The unadjusted Purchase Index increased 32 percent compared with the previous week and was 35 percent lower than the same week one year ago.
Here are the stats.
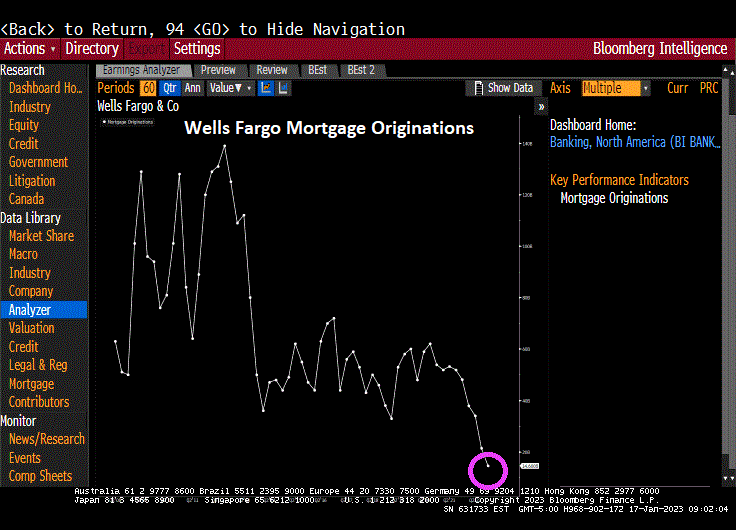
One lender in particular, Wells Fargo, smells blood in the economic waters, and has cut back mortgage originations.
Just remember, mortgage applications generally rise in the first part of the year until May, then start slowing until the last week of the year. This is called seasonality. But despite the fast growth this year, purchase applications are still down -35% compared to last year at this time.
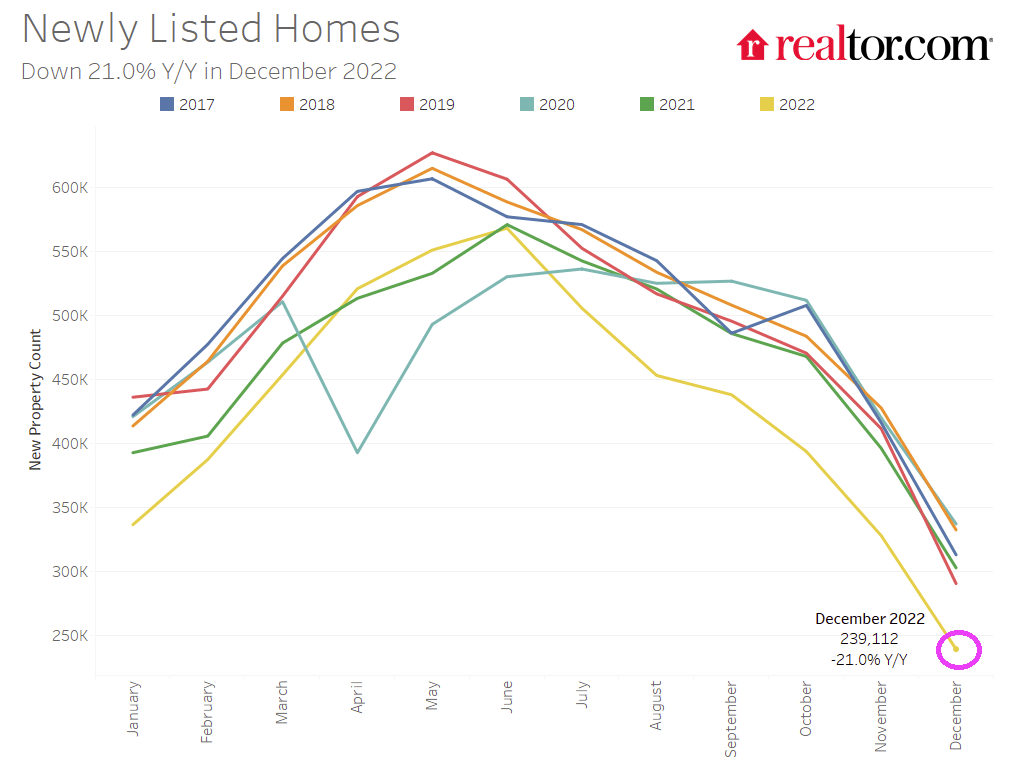
As The Federal Reserves attempts to combat inflation, the withdrawal of monetary stimulus is creating problems in the housing market. For one, as mortgage rates have risen, newly listed homes declined -21% YoY in December.
And yes, the 2022 vintage is the worst in 6 years as The Fed counterattacks inflation. And mortgage rates rose to over 7% before calming down to around 6.50%.
And with it, ISM Manufacturing Report for December is showing weakness. New orders (orange line) is down to 45.2 (below 50 is contraction) and the prices paid is down to 39.4 (white line). All this is happening as The Fed raises its target rate (yellow line) and removes monetary stimulus (green line).
This gives us “The Devil’s Tower” looking economic spike after massive Covid-related monetary stimulus and Federal government repeated stimulus.
Speaking of Already Gone, look at the US Treasury 10Y-2Y yield curve with slowing M2 Money growth. Yield curve inversion is more about vanishing M2 Money growth than it is a forecast of recession.
Today is all quiet of the financial market front since the US stock
Today is all quiet of the financial market front since the US stock and bond markets are closed. But as the new year starts, we have to ask the following question: is the US already in a recession?
A simple measure of IMPENDING recession is the US yield curve which is currently inverted. Typically, a recession occurs within months of the yield curve inverting. But if we look at real GDP growth, the Atlanta Fed GDP tracker is at 3.7%, so no recession there (two consecutive quarters of negative GDP growth is often used as a measure of recession).
But another indicator of “all is not well” is the CBOE Put/Call Ratio. Typically, the Put/Call Ratio spikes during a recession. But on December 28, 2022, the Put/Call Ratio spiked to its highest level since 1996. Although it has calmed down to 0.84 on December 30, 2022. Suffice it to say that there is enormous uncertainty in markets.
Covid begat massive Fed monetary stimulus and an excuse for the Federal government to go on a series of spending sprees (Covid “relief”, Instrastructure, Inflation Reduction, and now the $1.7 Trillion pork-laden Omnibus bill). Now that historic big spender Nancy Pelosi (CA-D) is no longer Speaker, will her successor have such a voracious spending appetite? The US economy is still benefitting from Covid-related stimulus which also helped generate 40-year highs in inflation.
Thanks to inflation, US workers have had 20 consecutive months of negative wage growth. But as M2 Money growth slows to a halt, so will real average hourly earnings.
The traditional measures of recession (unemployment and Real GDP growth) are NOT pointing to recession, but 20 straight months of negative wage growth points to bad news for workers. Throw in an inverted yield curve and massive volatility in the CBOE Put-Call Ratio and we have a party … that I don’t want to attend.
As we begin 2023 (and I am still bummed-out over Ohio State University losing a nail-bitter to Georgia in the Peach Bowl), we need to look at the condition of one of the most important sectors of the US economy.\, housing.
If we look at the US Housing Leading Growth index (courtesy of RecessionAlert.com) has slumped to its worst reading since the recessions of 1982 and 2008.
And then we have the OCED leading indicators for the US falling as M2 Money growth slows.
My favorite chart shows US home price growth falling faster than University of Michigan football team’s national championship home hopes.
Will this prompt The Federal Reserve to pivot? Only time will tell.
2022 is one of the record books and not in a Tiger Woods way. Call it a year of pain.
First, the US enacted policies that drove up energy prices (goin’ green) that reverberated through the entire economy in the form of higher prices. Second, The Federal Reserve, in attempt to combat runaway inflation, started removing the excessive monetary stimulus that had been around since Fed Chair Bernanke initiated QE, the seemingly unlimited purchase of Treasury and Agency MBS securities. Janet Yellen continued the massive asset purchases and zero interest rate policies or ZIRP. Now that inflation has struck the American middle class hard, we are seeing Fed Chair Powell doing what Bernanke and Yellen wouldn’t do — remove the monetary punchbowl.
Using Robert Shiller’s on line data, US stocks and bonds have had an awful year, the worst combined year since 1871.
US equity returns have been demolished under the NEW dual mandate (goin’ green = rising prices = Fed tightening).
Let’s see how two of the most famous investment gurus did in 2022, Warren Buffet and Cathie Wood. Buffet’s Bershire Hathaway Class A equity was UP 4% in 2022, while Cathie Wood’s ARK Innovation ETF collapsed by -67% in 2022.
Here is the clinker. The US economy (as well as the global economy) seem dependent on “cheap money” from Central Banks like The Federal Reserve. So the question is … will The Fed pivot? Fed talking heads are saying no, but Fed Funds investors are saying yes to a pivot after June 2023.
Ulysses S Grant was the President the last time the combined stock and bond market was this bad.


You must be logged in to post a comment.