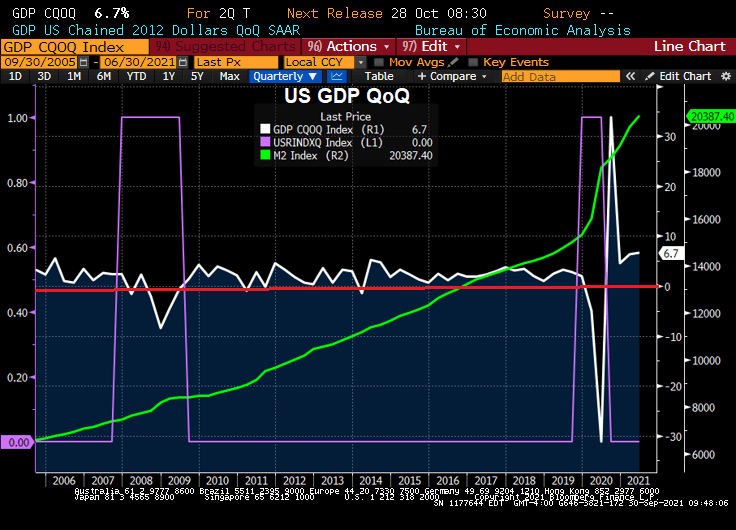
So much for the transitory inflation that The Federal Reserve keeps spouting on about.
(Bloomberg) — The pace of rent increases is heating up in the U.S.
Rent data for the past two months show no sign yet of the usual seasonal dip at this time of year, following peaks early in the summer, when many lease renewals come due.
A Zillow Group Inc. index based on the mean of listed rents rose 11.5% in August from a year earlier, with some cities in Florida, Georgia and Washington state seeing increases of more than 25%.
Since the start of the pandemic, the median rent for a two-bedroom apartment has soared 13.1% to $1,663, Zumper data show.
But rent on newly-signed leases rose 17% from the previous tenant’s lease.
For the New York market, landlords are raising rent prices as much as 70% now that people are flooding back into the city as offices and entertainment venues open up. In July, the median asking rent in New York City surged to $3,000, compared with the pandemic low of $2,750 in January 2021, data from StreetEasy showed.
Of course, rent surge is not surprising given that home prices have surged since Covid given limited inventory and massive Fed stimulus.
Perhaps if The Fed and Federales (Federal government) start reducing their apocalyptic-level stimulus, THEN we will see inflation as transitory.
A national mortgage lender has just introduced a 105 Loan-to-value (LTV) ratio loan and a lowering of FICO scores from 660 to 620.
Now, the loan still requires 97% LTV with downpayment assistance and gift funds permitted to boost CLTV to 105%.
With The Fed helping to raise home prices at a whopping 20% YoY, …
lenders are trying to find loan products for lower-income households so they can get in on the bubble! Hence, a 105% CLTV mortgage product with reduced credit requirements and increased Debt-to-income requirement rising from 43% to 45%. Also, borrowers can avoid the 3% downpayment requirement and put down only $500.
This is lending into the storm: softening of underwriting requirements as the house price bubble surges. Sound like 2005. This was not supposed to happen. After the housing bubble burst and the financial crisis, The Fed was supposed to encourage counter-cyclical lending (tighten credit standards as a housing bubble worsens). Instead, lenders are lowering credit standards, feeding the house price bubble.
If this was just one lender, I would have barely noticed. But this mortgage is being offered by most banks. And then sold to our GSEs: Fannie Mae and Freddie Mac.
Speaking of lending into a storm, as part of the raft of new legislation designed to spur first-time homeownership in America, a remarkable bill has joined the fray: its sponsors propose creating a new subsdizied 20-year-fixed-rate mortgage program through Ginnie Mae, HousingWire reports.
According to the bill, Ginnie Mae in tandem with the Department of the Treasury would subsidize the interest rate and origination fees associated with these 20-year mortgages, so that the monthly payment would be in line with a new 30-year FHA-insured mortgage. The move – which is an explicit subsidy of one share of the population by another – could, in theory, “allow qualified homebuyers to build equity-and wealth- at twice the rate of a conventional 30-year mortgage.” Instead, what it will do is lead to is an even bigger housing bubble.
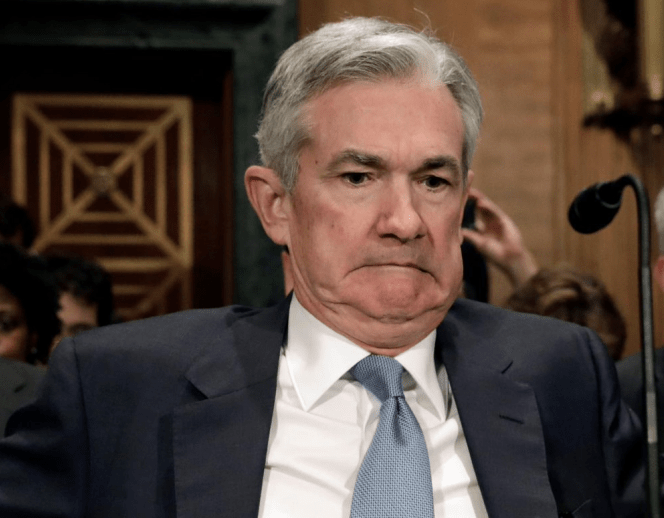
The Federal Reserve is dominating the news today as two Fed regional Presidents have resigned (Rosengren [Boston] and Kaplan [Dallas]) for trading irregularities.
Now, it is September 28, so this is a report of happenings two months ago. Well, now you know why The Fed ignores housing despite being the largest asset is most household’s portfolio.
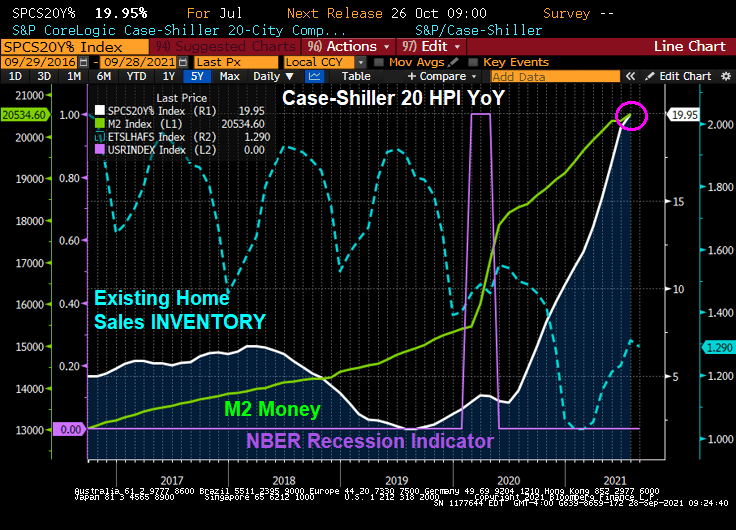
A measure of prices in 20 U.S. cities gained 19.9% in July. Phoenix led the way with a 32.4% surge. New York (17.8%), Boston (18.7%), Dallas (23.7%), Seattle (25.5%) and Denver (21.3%) were among the cities that posted record year-over-year increases.
The housing market is over, under, sideways, down thanks to The Fed pumping trillions into a market with limited available inventory.
Phil Hall of Benzinga wrote a series of excellent articles in four parts for MortgageOrb (although “The Orb” has removed his name). Here are the links to his stories.
After re-reading these excellent articles on the housing bubble and crash, I thought I would take the opportunity to present a few charts to highlight the housing bubble, pre-crash and post-crash.
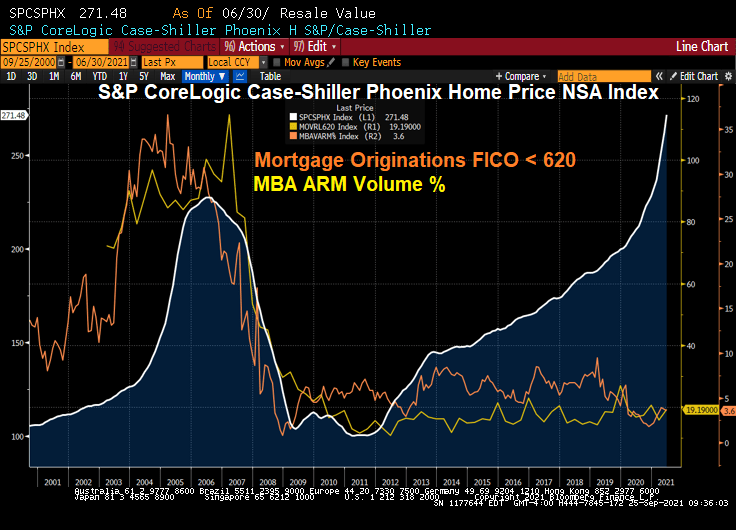
Here is a graph of Phoenix AZ home prices. Note the bubble that peaked in mid 2006. The Phoenix bubble correlates with the large volume of sub-620 FICO lending and Adjustable-rate mortgage (ARM) lending. Bear in mind, many of the ARMs prior to 2010 were NINJA (no income, no job) ARM loans.
What happened? Serious delinquenices at the national levels spiked as The Great Recession set in and unemployment spiked.
Since the housing bubble burst and surge in serious mortgage delinquencies, The Federal Reserve entered the economy with a vengeance. And have never left, and increased their drowning of markets with liquidity.
The Fed whip-sawing of interest rates in response to the 2001 recession was certainly a problem. They dropped The Fed Funds Target rate like a rock, then homebuilding went wild nationally and home prices soared thanks to Alt-A (NINJA) and ARM lending. But now The Fed is dominating markets like a gigantic T-Rex.
Oddly, then Fed Chair Ben Bernanke never saw the bubble coming. Or the burst.
Speaking of pizza, Donato’s from Columbus Ohio is my favorite. Founder’s Favorite is my favorite, but they do offer the dreaded Hawaiian pizza (ham, pineapple, almonds and … cinnamon?)
Since Q2 2020, US homeowners have been big winners in terms of home price gains and equity in their homes. Unfortunately, this means that renters are big losers. Once again, The Federal Reserve is benefiting once segment of the population while punishing the other segment.
*Homeownership mortgage source: 2016 American Community Survey.
National Homeowner Equity
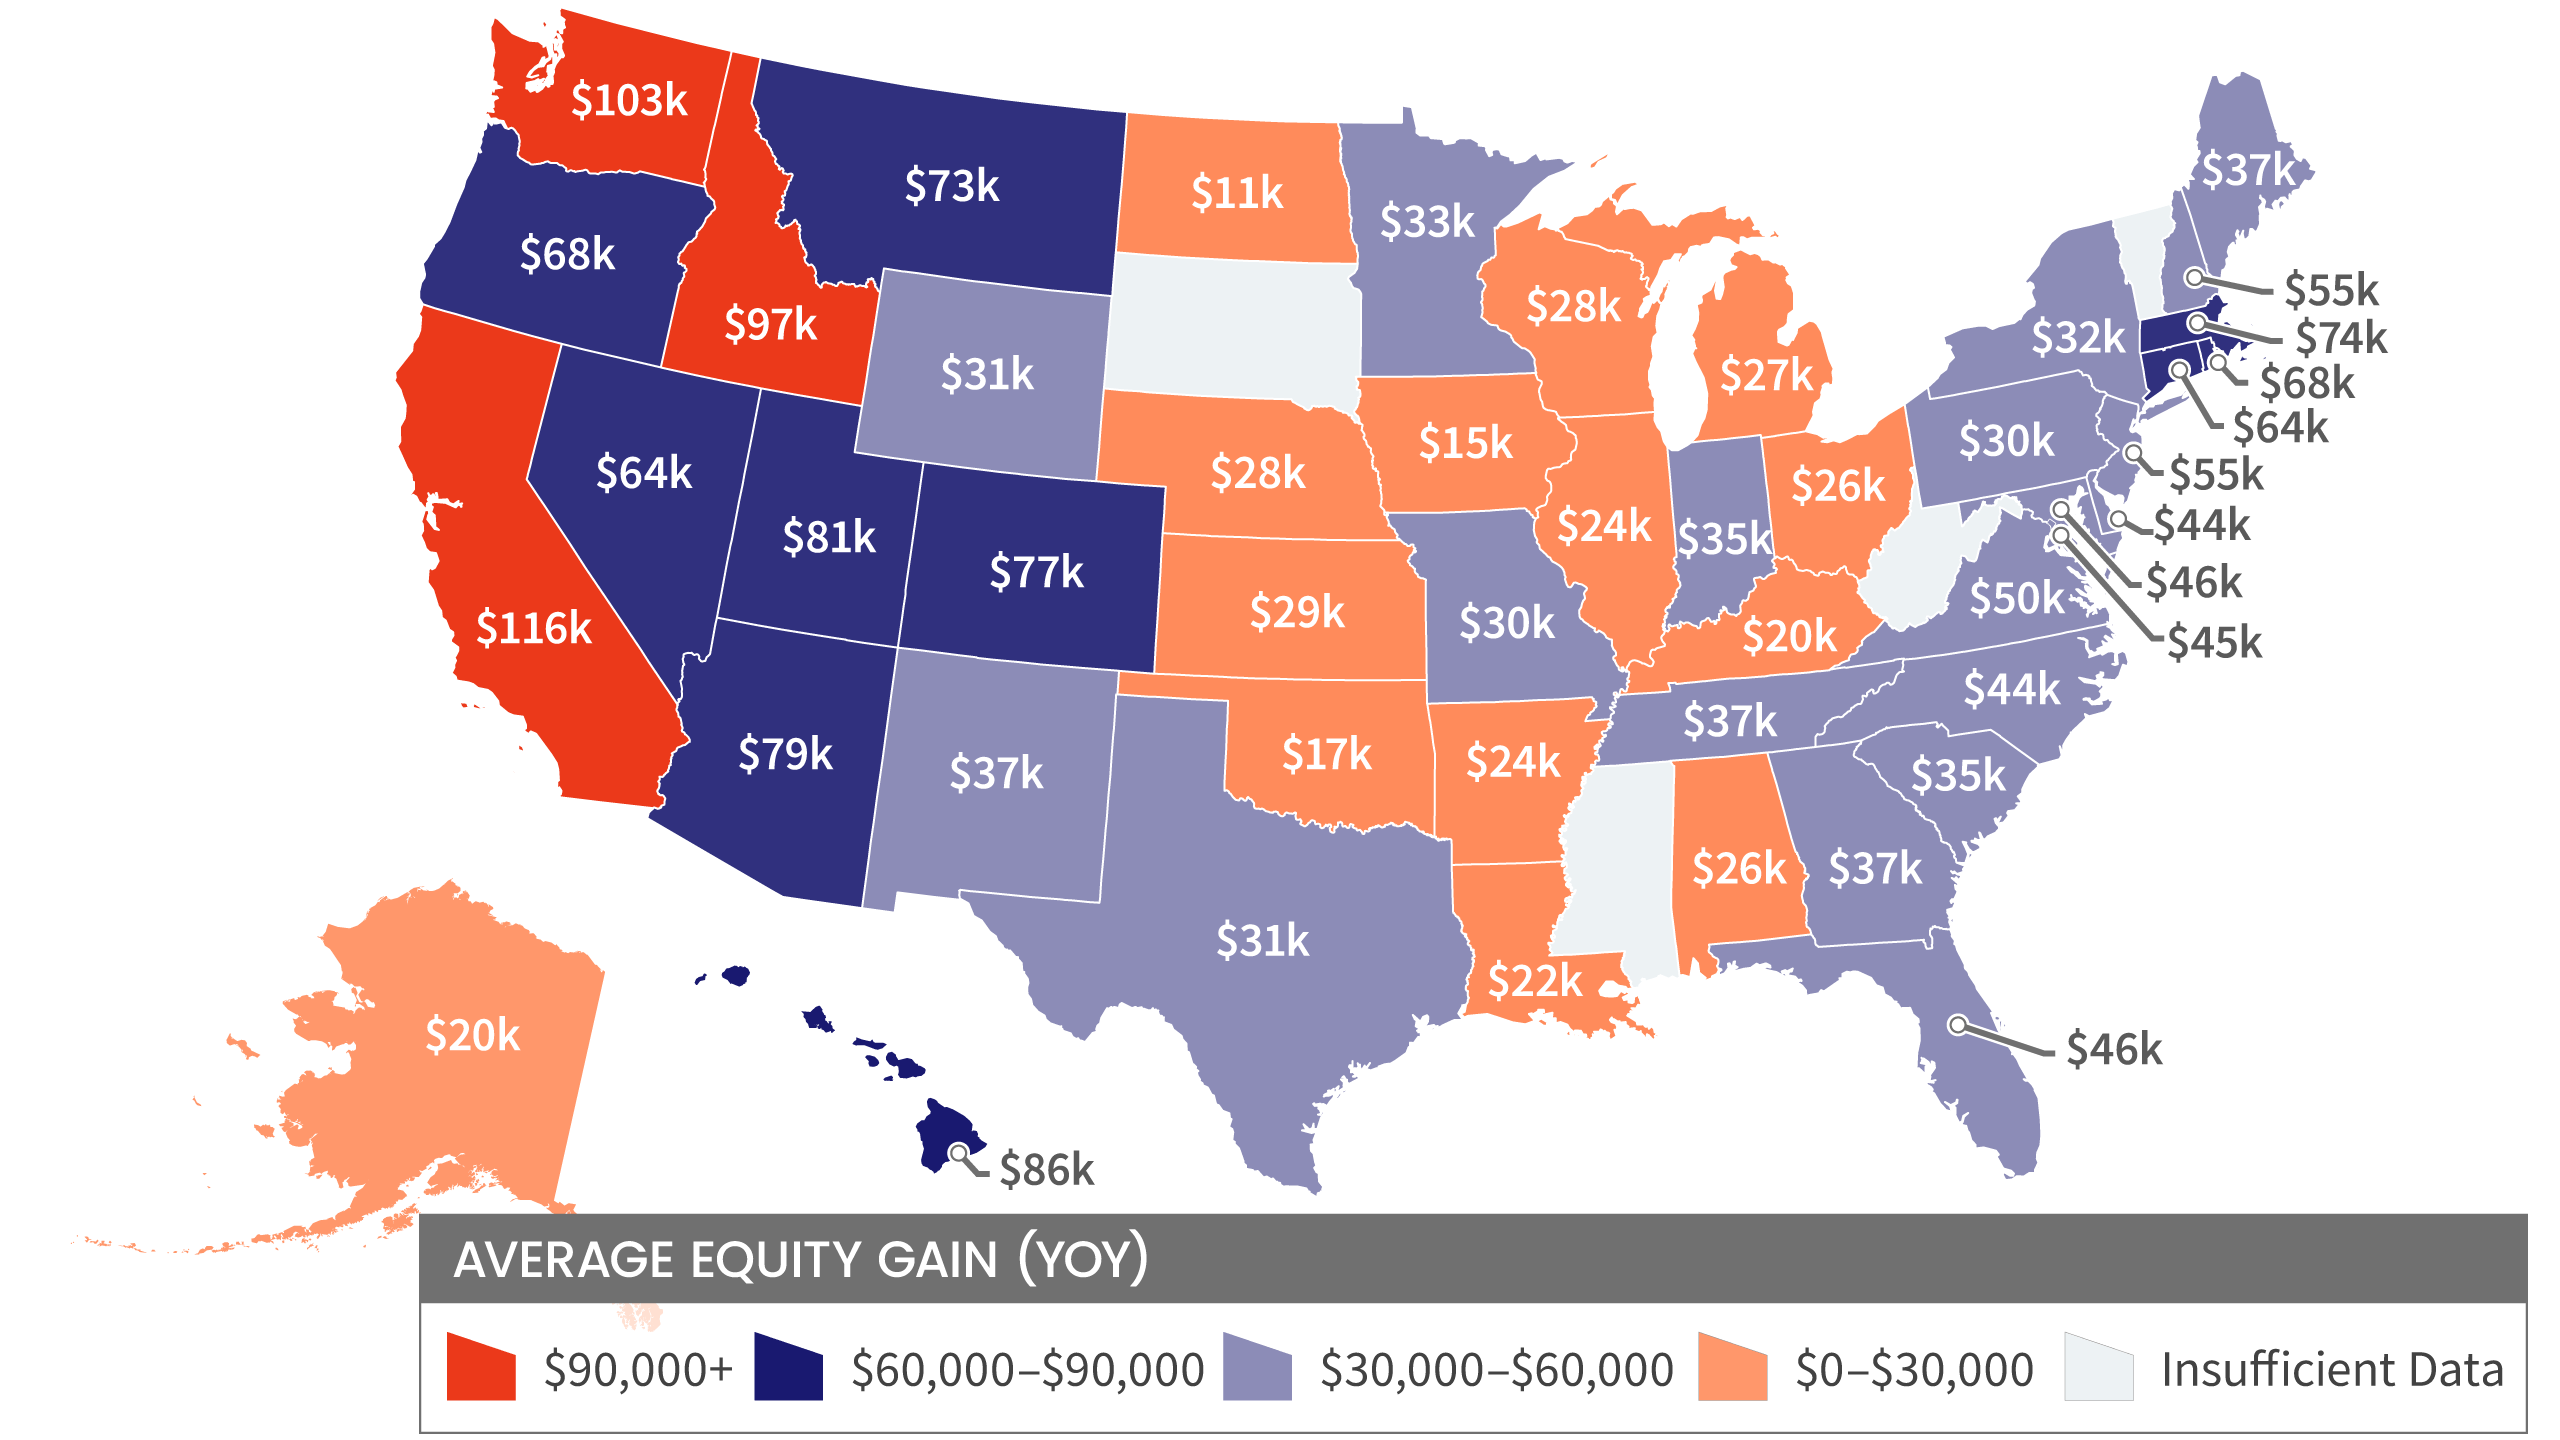
In the second quarter of 2021, the average homeowner gained approximately $51,500 in equity during the past year.
California, Washington, and Idaho experienced the largest average equity gains at $116,300, $102,900 and $97,000 respectively. Meanwhile, North Dakota experienced the lowest average equity gain in the second quarter of 2021 at $10,600.
10 Select Metros Change
CoreLogic provides homeowner equity data at the metropolitan level, in this graphic 10 of the largest cities, by housing stock are depicted.
Negative equity has seen a recent decrease across the country. San Francisco-Redwood City-South San Francisco, CA, is the least challenged, with Negative Equity Share of all mortgages at 0.6%.
Loan-to-Value Ratio (LTV)
The graph represents National Homeowner Equity Distribution across multiple LTV Segments.
Since growing home equity lead to lower default risk (or at least losses to the mortgage holder), we are seeing mortgage delinquencies fall after the Covid surge.
I certainly hope The Federal Reserve starts normalizing interest rates. Hold that Fed tiger!
(Bloomberg) — Sales of previously owned U.S. homes fell in August, suggesting that demand is moderating as lean inventory and high prices squeezed out some buyers.
Contract closings decreased 2% from the prior month to an annualized 5.88 million, in line with economists’ estimates, figures from the National Association of Realtors showed Wednesday. “Clearly the home sales are settling down but above pre-pandemic conditions,” Lawrence Yun, NAR’s chief economist, said on a call with reporters.
Lawrence Yun is correct. There was a huge spike in existing home sales (EHS) following the Covid outbreak and the overreaction by The Federal Reserve (aka, when the ain’ts went marching in). Despite continuing stimulus, but EHS has simmered down.
At least the median price of EHS YoY slowed to 12.1% YoY as The Fed slows M2 Money growth.
Inventory remains relatively low compared to historic levels while price zooms with Fed stimulus.
Want home price growth to slow its insane growth? Hold that tiger! That is, The Fed has to start normalizing interest rates.
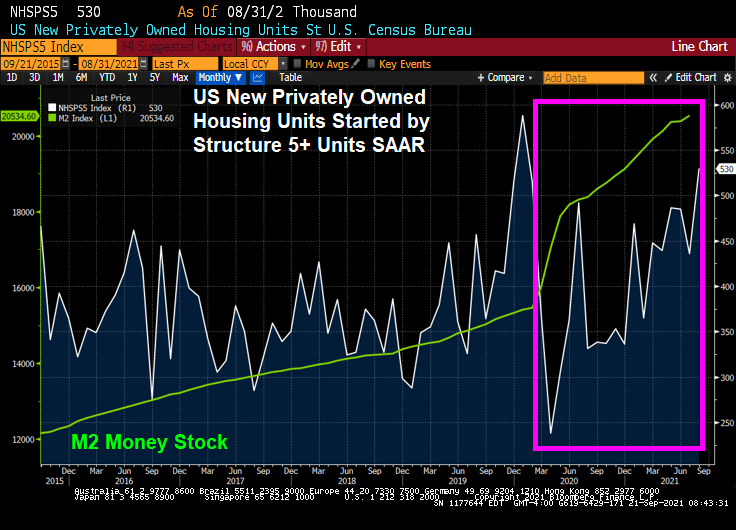
The unorthodox monetary stimulus from The Federal Reserve and stimulypto-level spending by the Federal government has resulted in a surge in US housing starts. But that thrill may be gone if the stimulypto is removed.
(Bloomberg) -By Olivia Rockeman- U.S. housing starts rose by more than expected in August, suggesting that the supply and labor constraints that have been holding back construction eased in the month.
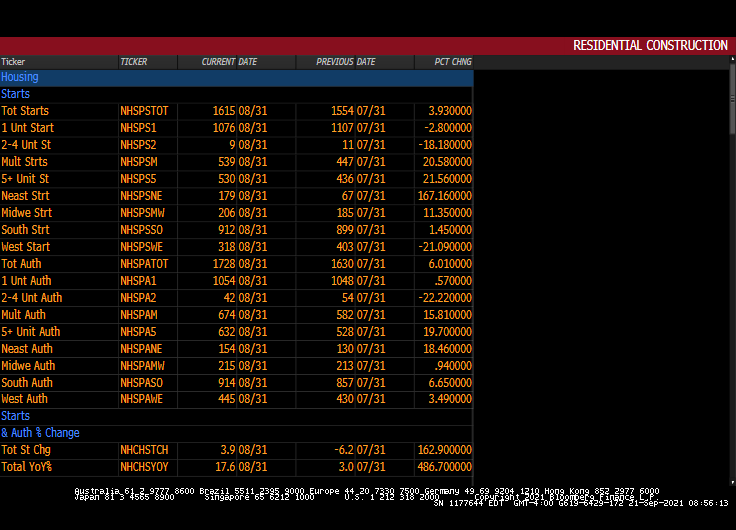
Residential starts rose 3.9% last month to a 1.62 million annualized rate after an upwardly revised July print, according to government data released Tuesday. The median estimate in a Bloomberg survey called for a 1.55 million pace.
Building permits, meanwhile, increased 6% in August, the biggest gain since January, reflecting a sizable jump in multi-family units. Permit applications for single-family homes also edged higher.
The data suggest that builders are making some construction headway despite limited availability of land, labor and materials, which has slowed residential starts from a 15-year high in March. Despite the bottlenecks, housing starts remain mostly above pre-pandemic levels, which is expected keep construction activity elevated for some time.
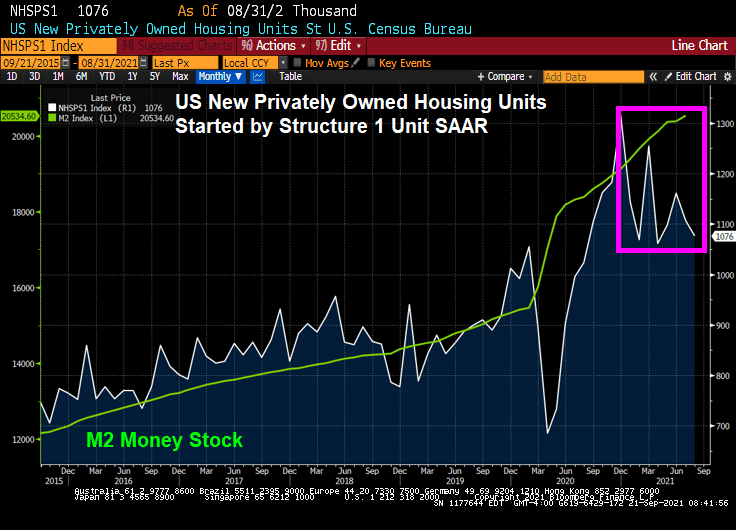
1-unit (single family detached) starts got a tremendous jolt from The Fed’s monetary stimulus and Federal governments fiscal stimulus. But government stimulus wears out.
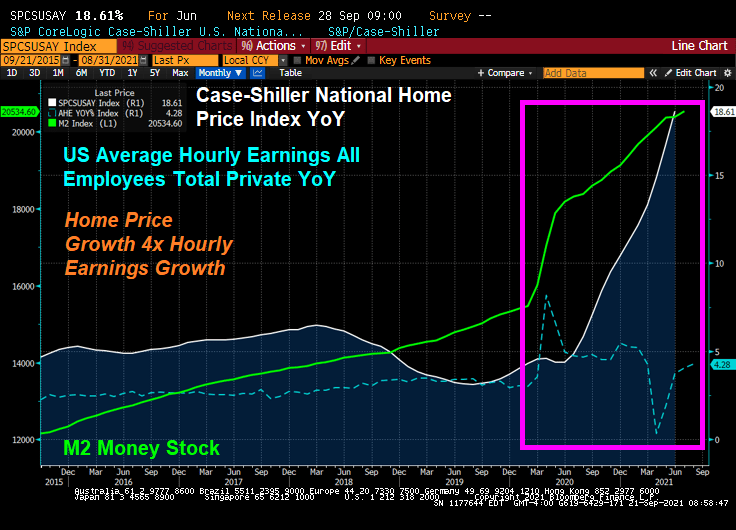
Given the high cost of housing in the USA, particularly in coastal metro areas, we see home price growth raging at over 4 times hourly earnings growth.
As a result, we are seeing a burst of 5+ unit (multifamily) housing starts. Note the burst of 5+ housing starts prior to Covid striking in early 2020.
Permits for 1-unit housing are up only slightly but 5+ unit permits are up 19.7%.
Remember, the withdrawal of fiscal stimulus will lead to a big fiscal cliff.
This is the Steve Urkel economy where The Federal Reserve and Federal government screw everything up with their policies (or follicies) and say “Whoops! Did I do that?”
(Bloomberg) — U.S. consumer sentiment rose slightly in early September but remained close to a near-decade low, while buying conditions deteriorated to their worst since 1980 because of high prices.
The University of Michigan’s preliminary sentiment index edged up to 71 from 70.3 in August, data released Friday showed. The figure trailed the median estimate of 72 in a Bloomberg survey of economists.
Buying conditions for household durables, homes and motor vehicles all fell to the lowest in decades. The report said the declines were due to complaints about high prices. Consumers expect inflation to rise 4.7% over the coming year, matching the highest since 2008.
September’s UMich Buying Conditions for Houses fell to 60 … thanks to superheated house prices.
I can just picture Fed Chair Jerome Powell channeling Steve Urkel and saying “Whoops!! Did I do that?”
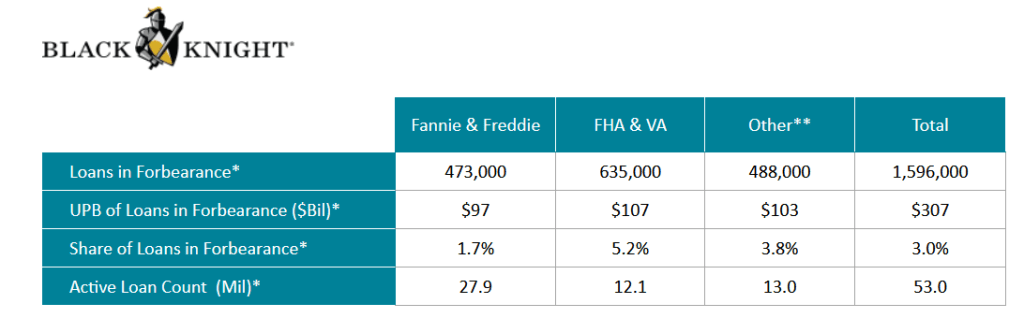
The Covid epidemic hit the single-family mortgage market hard in early 2020, leading mortgage lenders and servicers to offer FORBEARANCE to borrowers who were having trouble making their mortgage payments due to loss of hours or a loss of job.
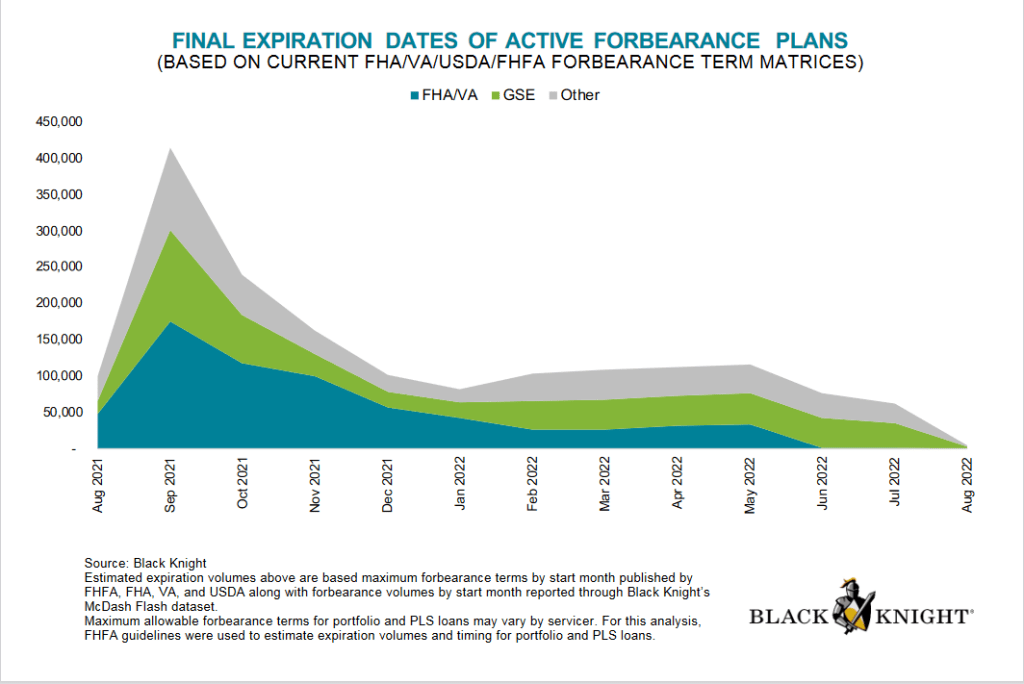
The good news? Active forbearance plans are much lower today than at their peak after the Covid epidemic struck in early 2020 with active forbearance plans peaking in May 2020.
Forbearance plans are due to expire in
What is forbearance, you ask? Forbearance is when a mortgage servicer or lender allows a borrower to temporarily pay their mortgage at a lower payment or pause paying your mortgage. The borrower will have to pay the payment reduction or the paused payments back later.
Despite forbearance, Fannie Mae still reported $7.2 billion in net income in Q2 2021. Notice the difference between single-family SDQ and the SDQ rate without forbearance. Freddie Mac reported $3.7 billion in Q2 2021 net income.
Here is a look at Fannie Mae’s net income over the past year and SDQ rates.
Under the existing seller/servicer eligibility requirements, the Agency SDQ Rate is defined as 100 multiplied by (the UPB of mortgage loans 90 days or more delinquent or in foreclosure for Fannie Mae, Freddie Mac, and Ginnie Mae/Total UPB of mortgage loans serviced for Fannie Mae, Freddie Mac, and Ginnie Mae). Beginning with the financial quarter ending Jun. 30, 2020, the Agency SDQ Rate will include an adjustment for mortgage loans in a COVID-19-related forbearance plan that are 90 days or more delinquent and were current at the inception of the COVID-19-related forbearance plan. The UPB of such mortgage loans shall be multiplied by .30 and added to the UPB for SDQ mortgage loans for the purposes of determining the numerator in the calculation of the Agency SDQ Rate.


You must be logged in to post a comment.