Trump has been President for 1 year and fighting against Biden and the Democrats economic misery.
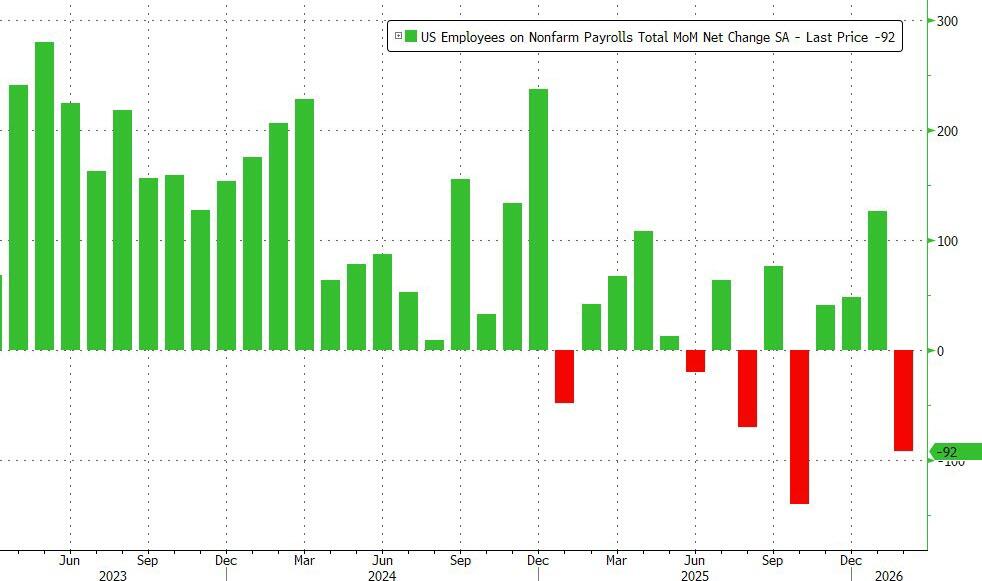
In February, the US lost 92,000 jobs, a huge drop from the downward revised 126K in January, and the second worst print since 2020 (only October’s shock -140K was worse), and this time, the massive drop can’t be dismissed as a one-time drop in government payrolls. The number of private payrolls dropped by 86K, also a huge miss to estimates of a 60K increase.
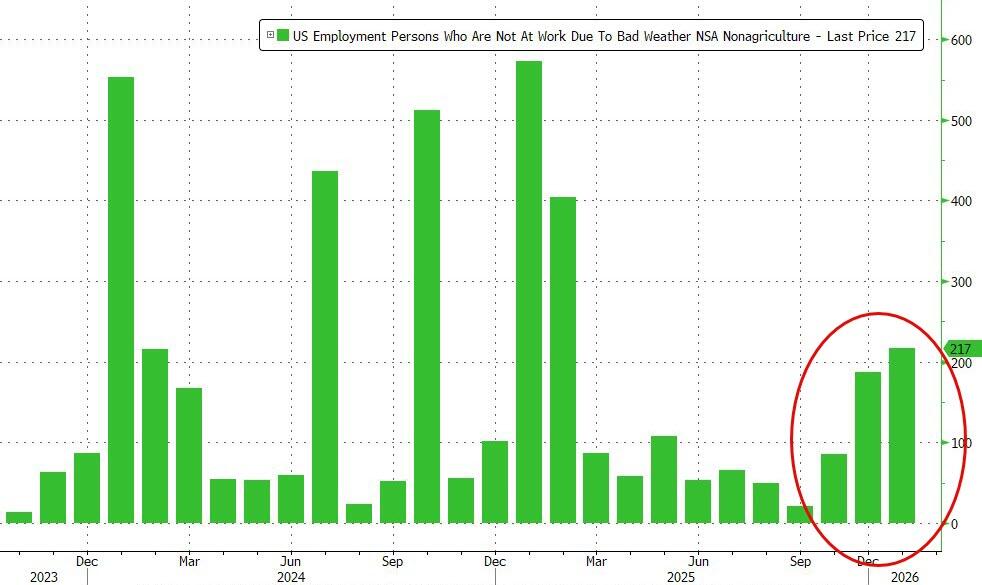
One potential mitigating factor: the number of people who were unable to work due to weather surged to 228K in February, well above last year’s level 167K, due to the powerful winter storms hitting the US.
The number of long-term unemployed (those jobless for 27 weeks or more) changed little at 1.9 million in February but is up from 1.5 million a year earlier. The long-term unemployed accounted for 25.3 percent of all unemployed people in February.
The number of people employed part time for economic reasons decreased by 477,000 to 4.4 million in February. These individuals would have preferred full-time employment but were working part time because their hours had been reduced or they were unable to find full-time jobs.
The number of people not in the labor force who currently want a job changed little in February at 6.0 million. These individuals were not counted as unemployed because they were not actively looking for work during the 4 weeks preceding the survey or were unavailable to take a job.
Among those not in the labor force who wanted a job, the number of people marginally attached to the labor force changed little at 1.6 million in February. These individuals wanted and were available for work and had looked for a job sometime in the prior 12 months but had not looked for work in the 4 weeks preceding the survey. The number of discouraged workers, a subset of the marginally attached who believed that no jobs were available for them, decreased by 109,000 in February to 366,000.
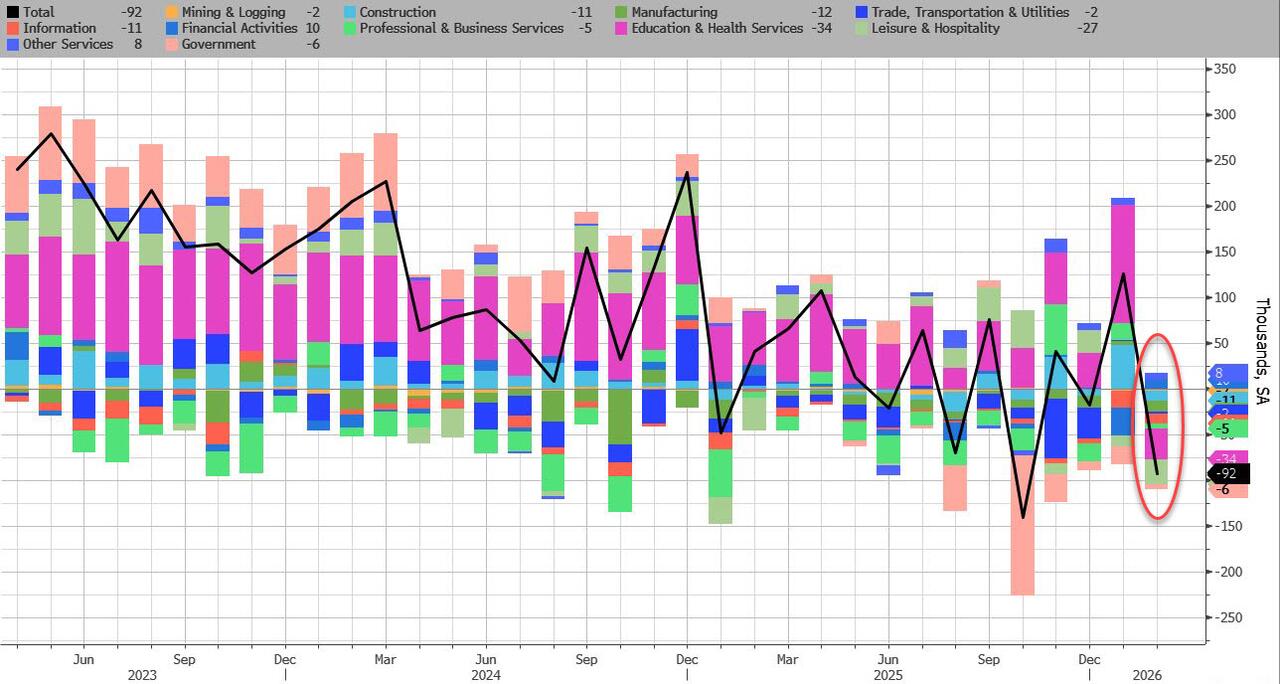
Turning to the establishment survey, which unveiled the shocking February drop, the BLS reported a broad-based decline, driven by striking employment workers:
Employment in health care decreased in February, reflecting strike activity. Employment in information and federal government continued to trend down. Payroll employment changed little on net in 2025.
Health care employment declined by 28,000 in February, following a large increase in January (+77,000). Offices of physicians lost 37,000 jobs in February, primarily due to strike activity. Hospitals added 12,000 jobs. Over the prior 12 months, health care had added an average of 36,000 jobs per month.
Employment in information continued to trend down in February (-11,000). The industry had lost an average of 5,000 jobs per month over the prior 12 months.
In February, federal government employment continued to decline (-10,000). Since reaching a peak in October 2024, federal government employment is down by 330,000, or 11.0 percent.
Employment in social assistance continued its upward trend in February (+9,000), driven by individual and family services (+12,000).
Transportation and warehousing employment changed little in February (-11,000). A job loss in couriers and messengers (-17,000) was partially offset by a gain in air transportation (+5,000). Employment in transportation and warehousing has declined by 157,000, or 2.4 percent, since reaching a peak in February 2025.
Employment showed little change over the month in other major industries, including mining, quarrying, and oil and gas extraction; construction; manufacturing; wholesale trade; retail trade; financial activities; professional and business services; leisure and hospitality; and other services.
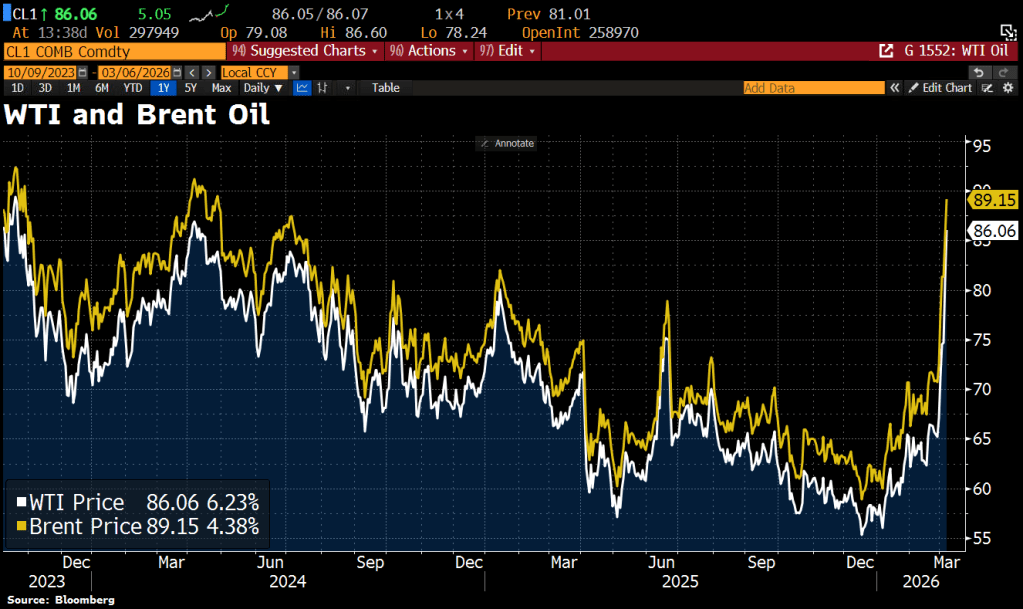
Switching to oil, we see the West Texas Intermediate and Brent Oil prices soaring on the attacks on Iran.
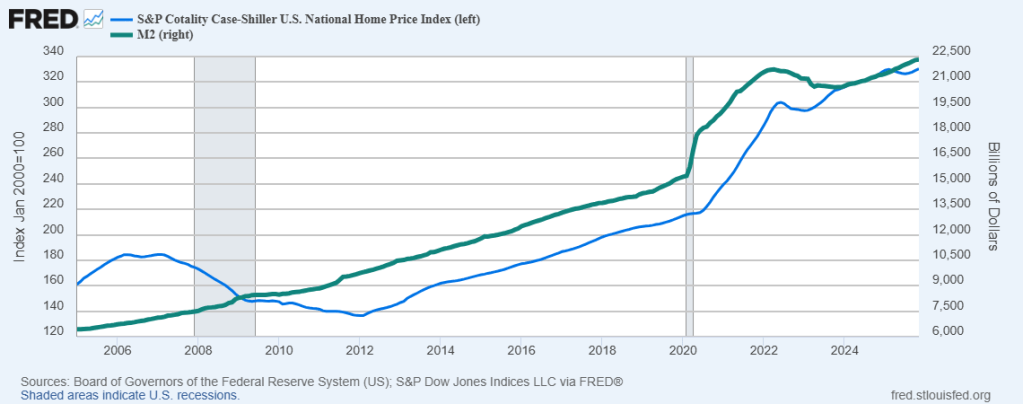
Keep on printing money. It seems that home price growth requires The Fed to keep printing money.
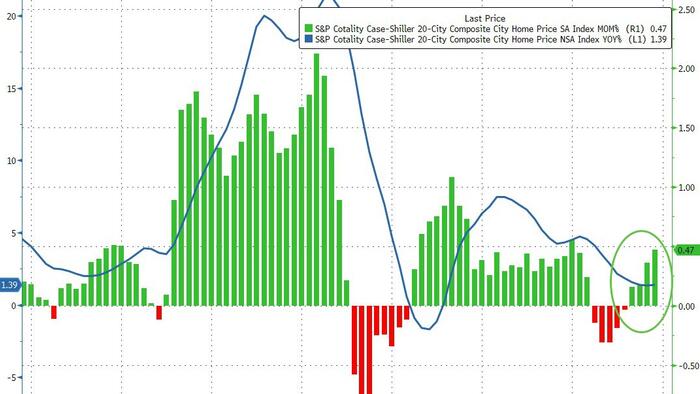
S&P/Case-Shiller released the monthly Home Price Indices for November (“November” is a 3-month average of September, October and November closing prices). September closing prices include some contracts signed in July, so there is a significant lag to this data. Here is a graph of the month-over-month (MoM) change in the Case-Shiller National Index Seasonally Adjusted (SA).
The S&P Cotality Case-Shiller U.S. National Home Price NSA Index posted a 1.4% annual gain for November, in line with the previous month.
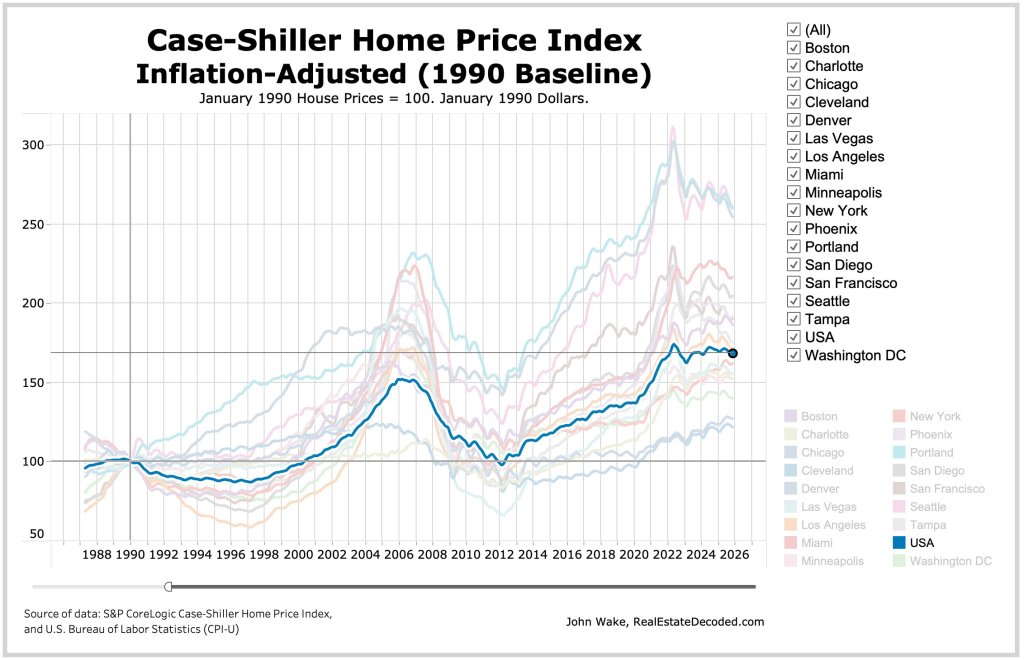
Real home values declined as consumer inflation (2.7%) outpaced the National Index gain (1.4%) by 1.3 percentage points.
Regional divergence persisted: Midwestern and Northeastern markets led by Chicago (+5.7%) and New York (+5.0%) posted gains, while Sun Belt cities including Tampa (–3.9%), Phoenix (–1.4%), Dallas (–1.4%), and Miami (–1.0%) saw declines. … “Regional patterns continue to illustrate a stark divergence. Chicago leads all cities for a second consecutive month with a 5.7% year-over-year price increase, followed by New York at 5.0% and Cleveland at 3.4%. These historically steady Midwestern and Northeastern markets have maintained respectable gains even as overall conditions cool. By contrast, Tampa home prices are 3.9% lower than a year ago – the steepest decline among the 20 cities, extending that market’s 13-month streak of annual drops. Other Sun Belt boomtowns remain under pressure as well: Phoenix (-1.4%), Dallas (-1.4%), and Miami (-1.0%) each continue to see year-over-year declines, a dramatic turnaround from their pandemic-era strength.
“Monthly price changes were mixed but leaned negative in November, underscoring persistent softness. On a non-seasonally adjusted basis, 15 of the 20 major metro areas saw prices decline from October (versus 16 declines in the previous month). Only a handful of markets – including Los Angeles, San Diego, Miami, New York, and Phoenix – eked out slight gains before seasonal adjustment. After accounting for typical seasonal slowing, the National Index inched up just 0.4% for the month, indicating that price momentum remains muted. … The S&P Cotality Case-Shiller U.S. National Home Price NSA Index, covering all nine U.S. census divisions, reported a 1.4% annual gain for November. The 10-City Composite showed an annual increase of 2.0%, up from a 1.9% increase in the previous month. The 20-City Composite posted a year-over-year increase of 1.4%, up from a 1.3% increase in the previous month. … The pre-seasonally adjusted U.S. National Index saw a drop of 0.1% and the 20-City Composite Index fell 0.03%, while the 10-City Composite Index increased 0.1%.
After seasonal adjustment, the U.S. National Index reported a monthly increase of 0.4%, and both the 10-City Composite and 20-City Composite Indices posted month-over-month gains of 0.5%.
Hallelujah, I love this economy so! Of course, former First Lady Jill Biden is on the national tour trashing the economy saying it was “perfect” under Joe Biden.
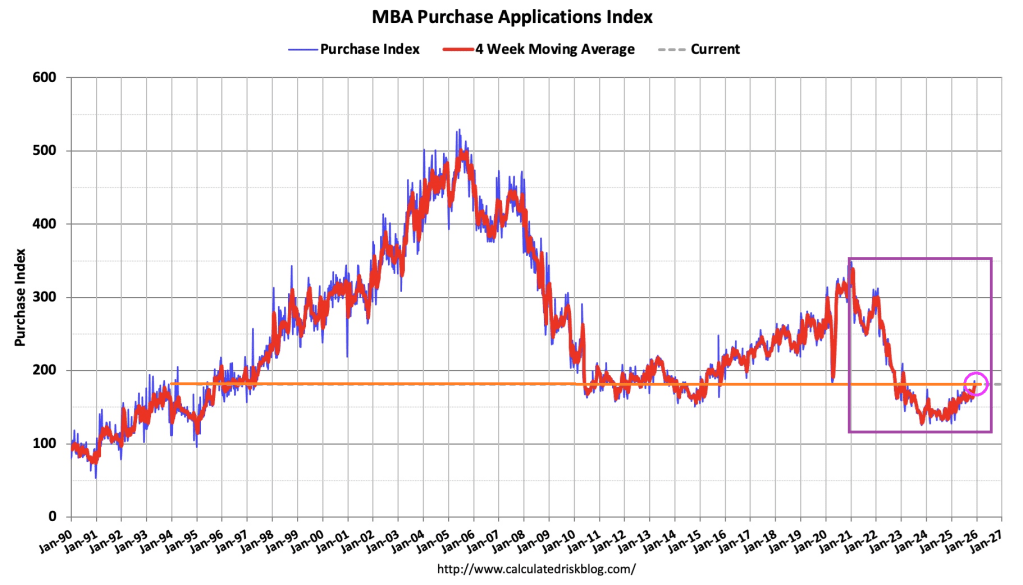
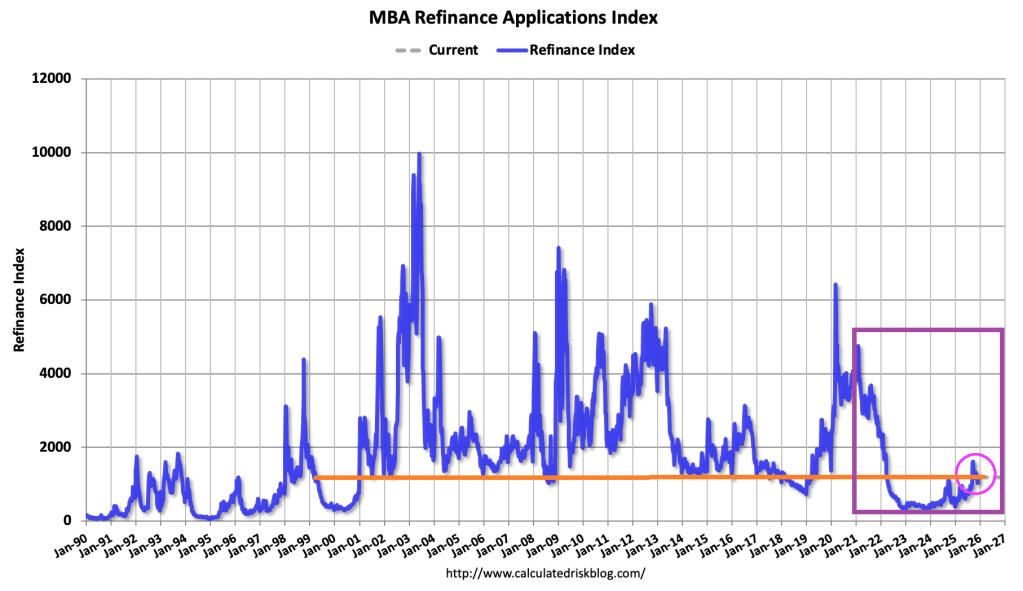
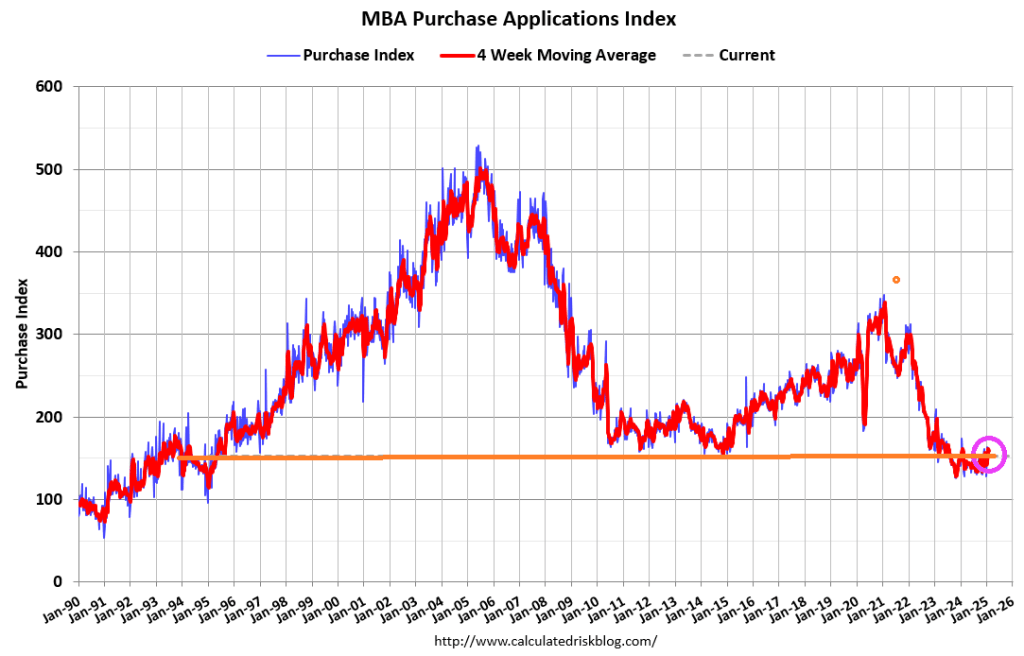
The Market Composite Index, a measure of mortgage loan application volume, increased 4.8 percent on a seasonally adjusted basis from one week earlier. On an unadjusted basis, the Index increased 49 percent compared with the previous week. The seasonally adjusted Purchase Index decreased 2 percent from one week earlier. The unadjusted Purchase Index increased 32 percent compared with the previous week and was 19 percent higher than the same week one year ago.
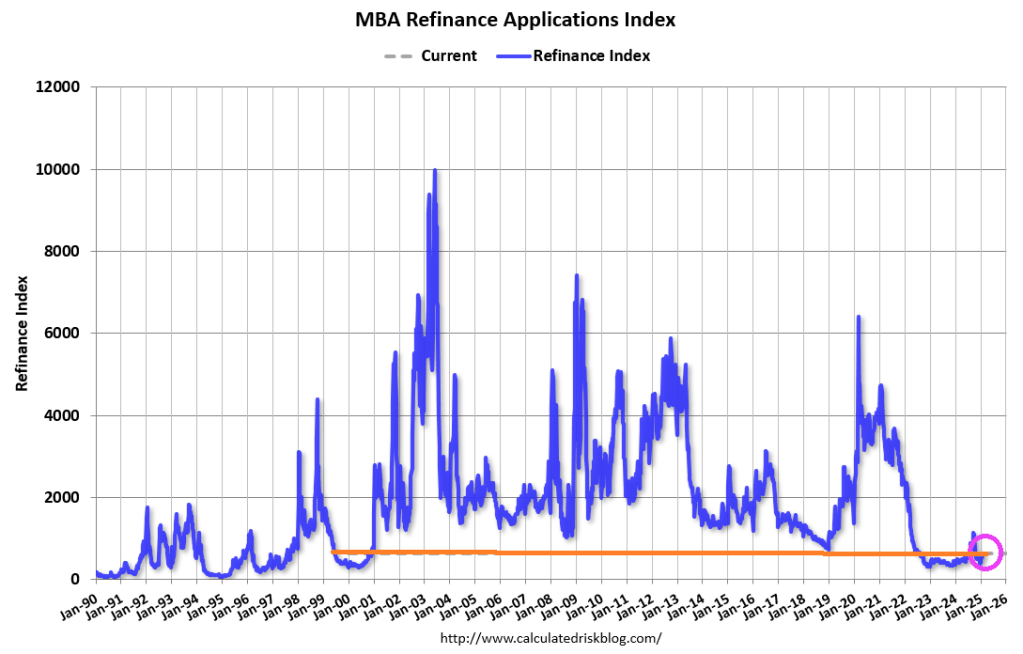
The Refinance Index increased 14 percent from the previous week and was 88 percent higher than the same week one year ago.
Compared to the prior week’s data, which included an adjustment for the Thanksgiving holiday, mortgage application activity increased last week, driven by an uptick in refinance applications,” said Joel Kan, MBA’s Vice President and Deputy Chief Economist. “Conventional refinance applications were up almost 8 percent and government refinances were up 24 percent as the FHA rate dipped to its lowest level since September 2024. Conventional purchase applications were down for the week, but there was a 5 percent increase in FHA purchase applications as prospective homebuyers continue to seek lower downpayment loans. Overall purchase applications continued to run ahead of 2024’s pace as broader housing inventory and affordability conditions improve gradually.
The average contract interest rate for 30-year fixed-rate mortgages with conforming loan balances ($806,500 or less) increased to 6.33 percent from 6.32 percent, with points increasing to 0.60 from 0.58 (including the origination fee) for 80 percent loan-to-value ratio (LTV) loans.
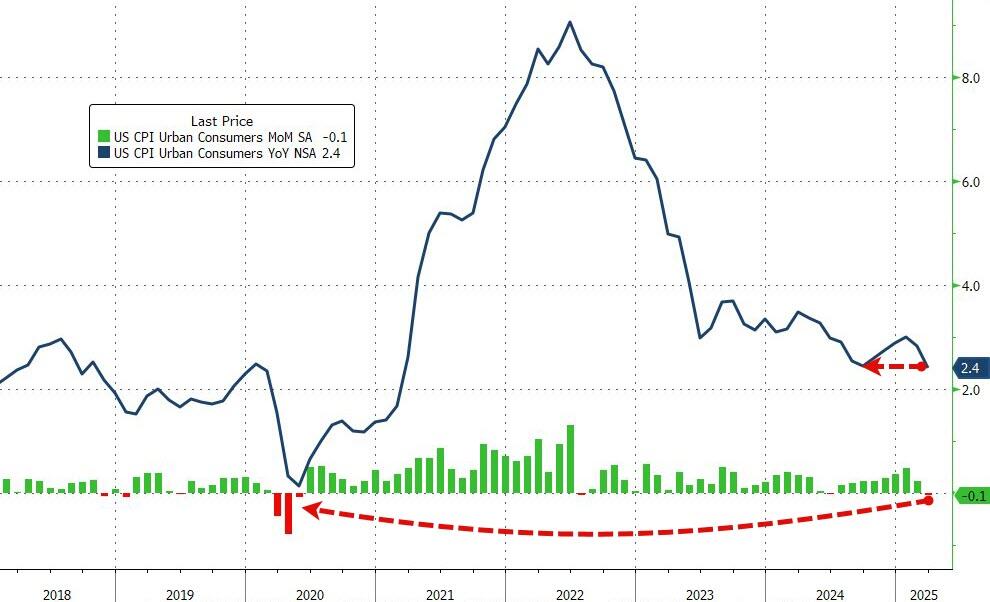
Having dipped lower in the previous month (following a few straight months of re-acceleration), expectations were for both headline and core measures to continue trending lower on a YoY basis… and they were.
Headline CPI FELL 0.1% MoM (vs +0.1% exp), which dragged the YoY CPI to +2.4%, matching the September lows…
Source: Bloomberg
That is the weakest MoM print since May 2020.
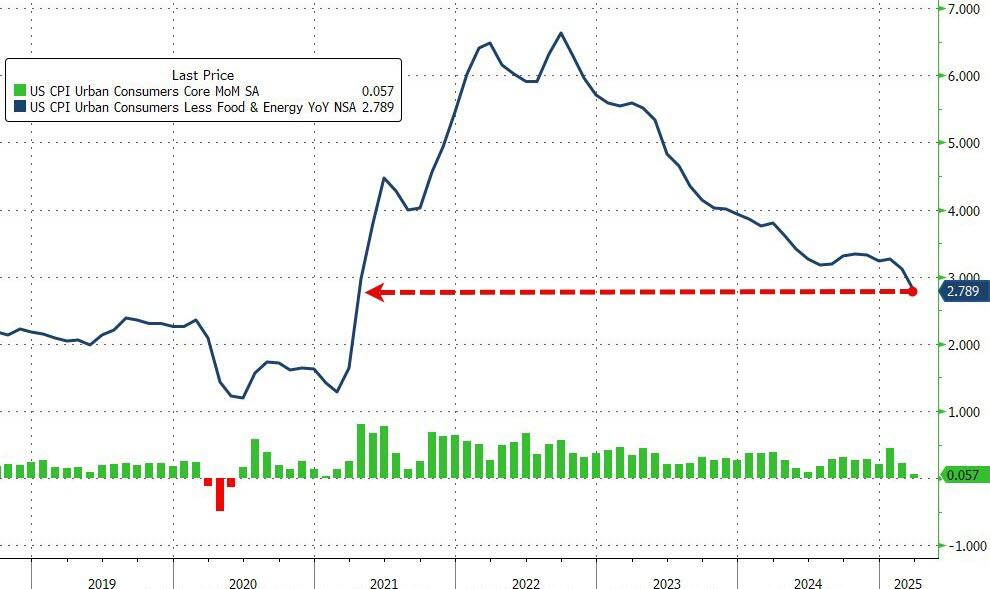
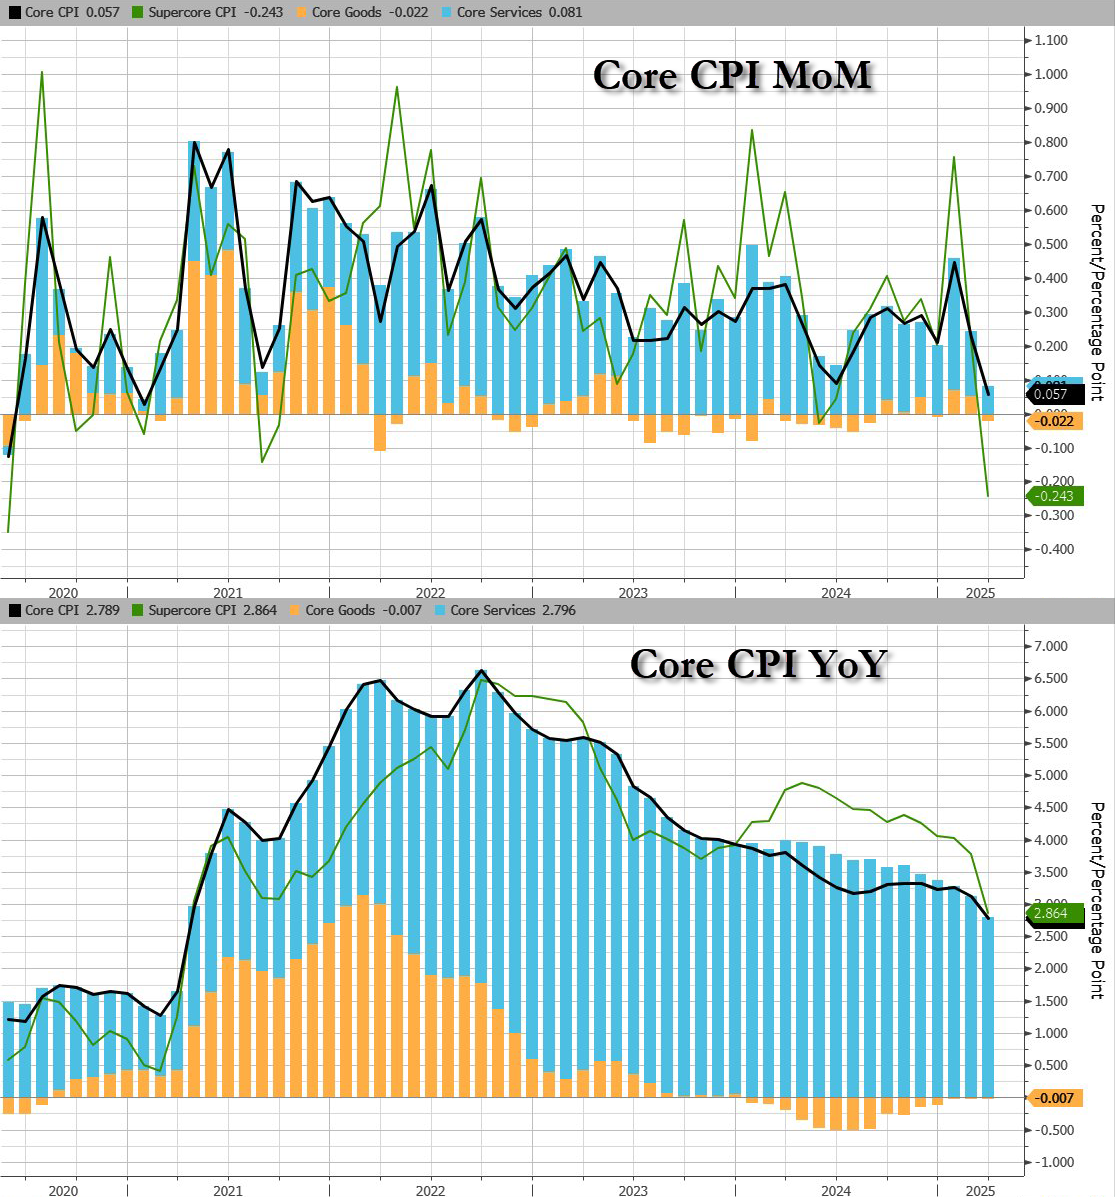
Core CPI also printed cooler than expected (+0.1% MoM vs +0.3% MoM exp), pulling the YoY print down t0 +2.8% YoY – the lowest since March 2021…
Source: Bloomberg
Services inflation tumbled…
Source: Bloomberg
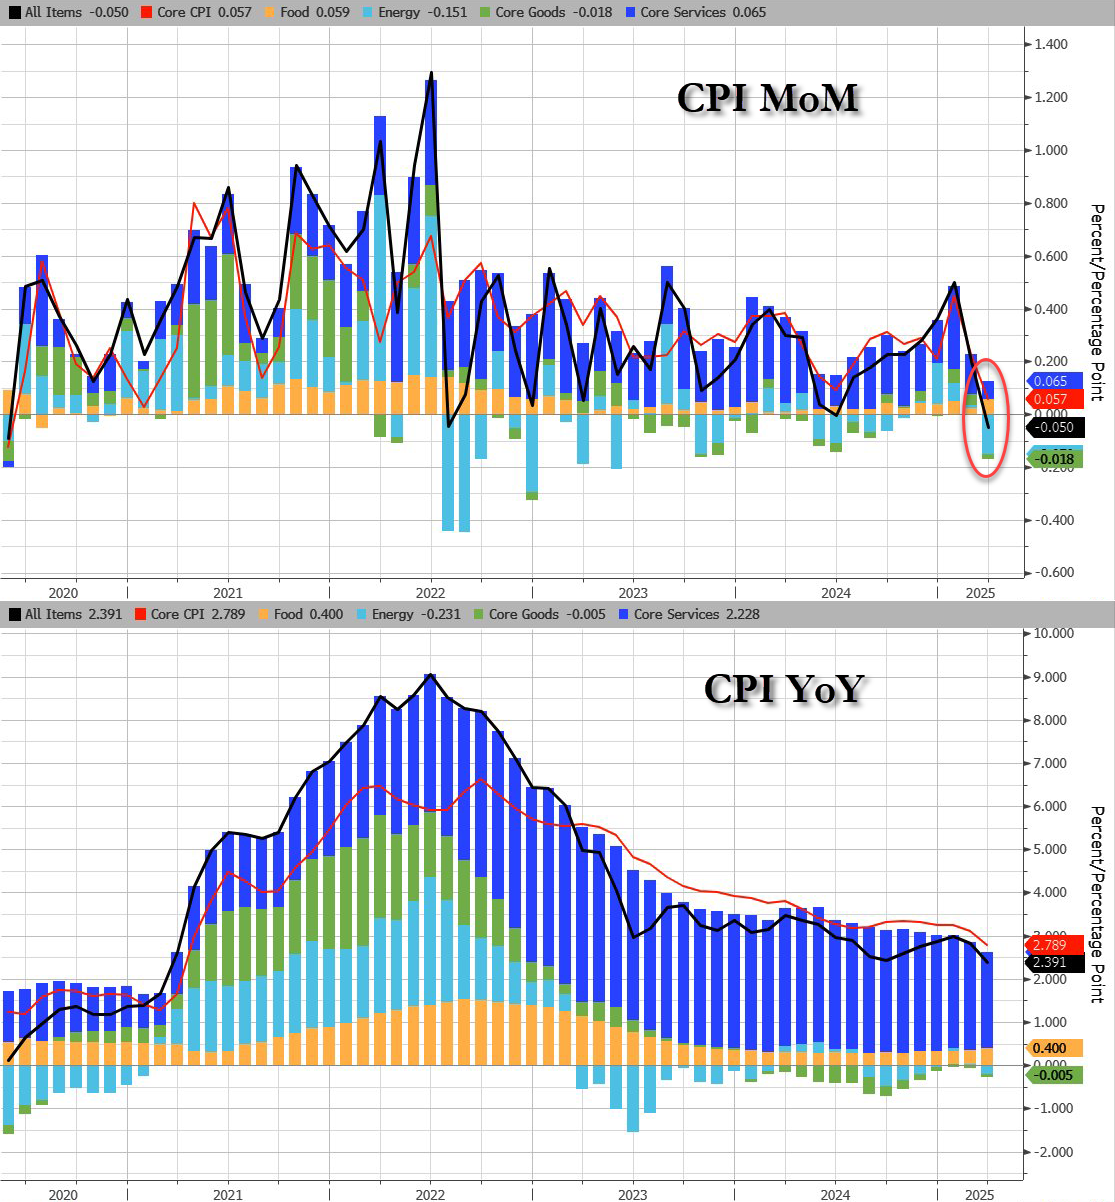
CPI breakdown:
Headline:
CPI decreased 0.1% after rising 0.2% in February, and below the +0.1% estimate. Over the last 12 months, CPI rose 2.4%, below the 2.5% estimate.
Energy CPI fell 2.4% in March, as a 6.3% decline in the index for gasoline more than offset increases in the indexes for electricity and natural gas.
Food CPI rose 0.4% in March as the food at home index increased 0.5% and the food away from home index rose 0.4 percent over the month.
Core CPI:
The index for all items less food and energy rose 0.1% in March, following a 0.2% increase in February.
Indexes that increased over the month include personal care, medical care, education, apparel, and new vehicles.
The indexes for airline fares, motor vehicle insurance, used cars and trucks, and recreation were among the major indexes that decreased in March.
Core CPI details (MoM increase):
The shelter index increased 0.2% over the month.
The index for owners’ equivalent rent rose 0.% in March and the index for rent increased 0.3%.
The lodging away from home index fell 3.5 percent in March.
The personal care index rose 1.0%in March.
The index for education rose 0.4% over the month, as did the index for apparel.
The new vehicles index also increased over the month, rising 0.1%.
The index for airline fares fell 5.3% in March, after declining 4.0% in February.
The indexes for motor vehicle insurance, used cars and trucks, and recreation also fell over the month.
The household furnishings and operations index was unchanged in March.
The medical care index increased 0.2% over the month.
The index for hospital services increased 1.1% in March and the index for physicians’ services rose 0.3% over the month. In contrast, the prescription drugs index fell 2.0% in March.
Core CPI details (YoY increase):
The index for all items less food and energy rose 2.8 percent over the past 12 months.
The shelter index increased 4.0 percent over the last year, the smallest 12-month increase since November 2021.
Other indexes with notable increases over the last year include motor vehicle insurance (+7.5 percent), medical care (+2.6 percent), recreation (+1.9 percent), and education (+3.9 percent).
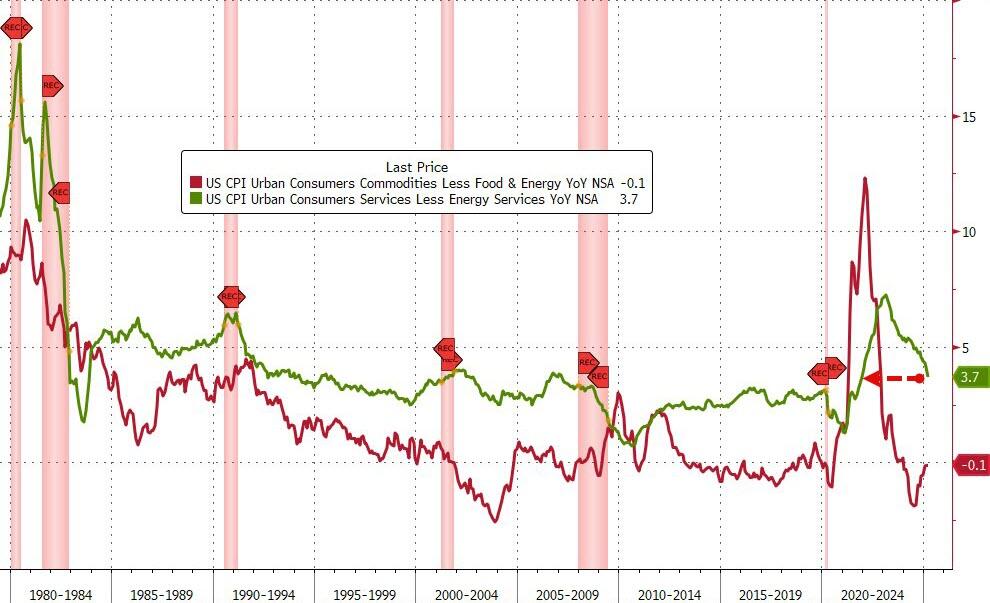
While goods inflation is flat (zero-ish), services cost inflation is fading fast…
Source: Bloomberg
Shelter and Rent inflation is slowing fast:
Shelter inflation +0.3% MoM, +3.99% YoY, down from 4.25% in February (lowest since Nov 2021)
Rent inflation +0.3% MoM, +3.99% YoY, down from 4.09% in February (lowest since Jan 2022)
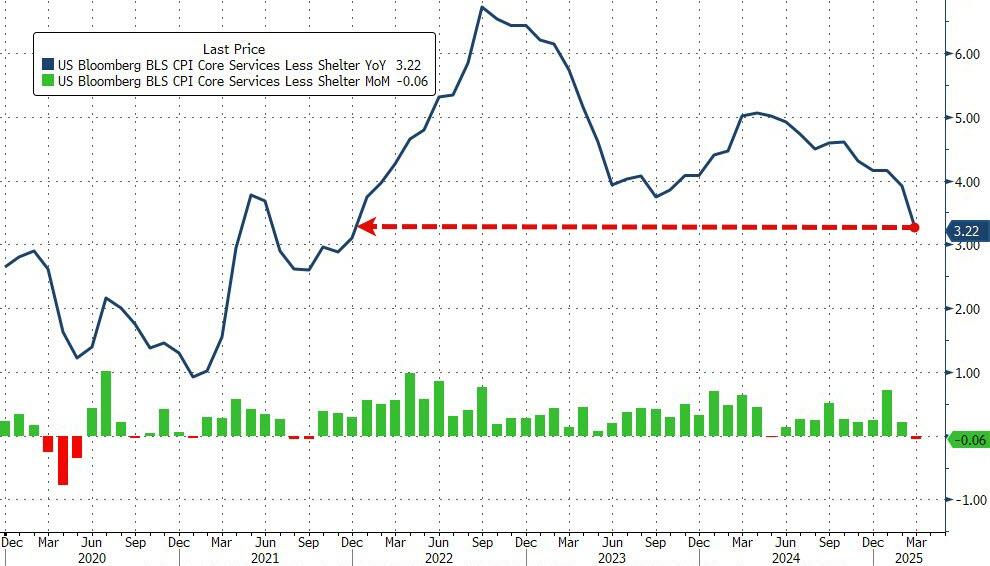
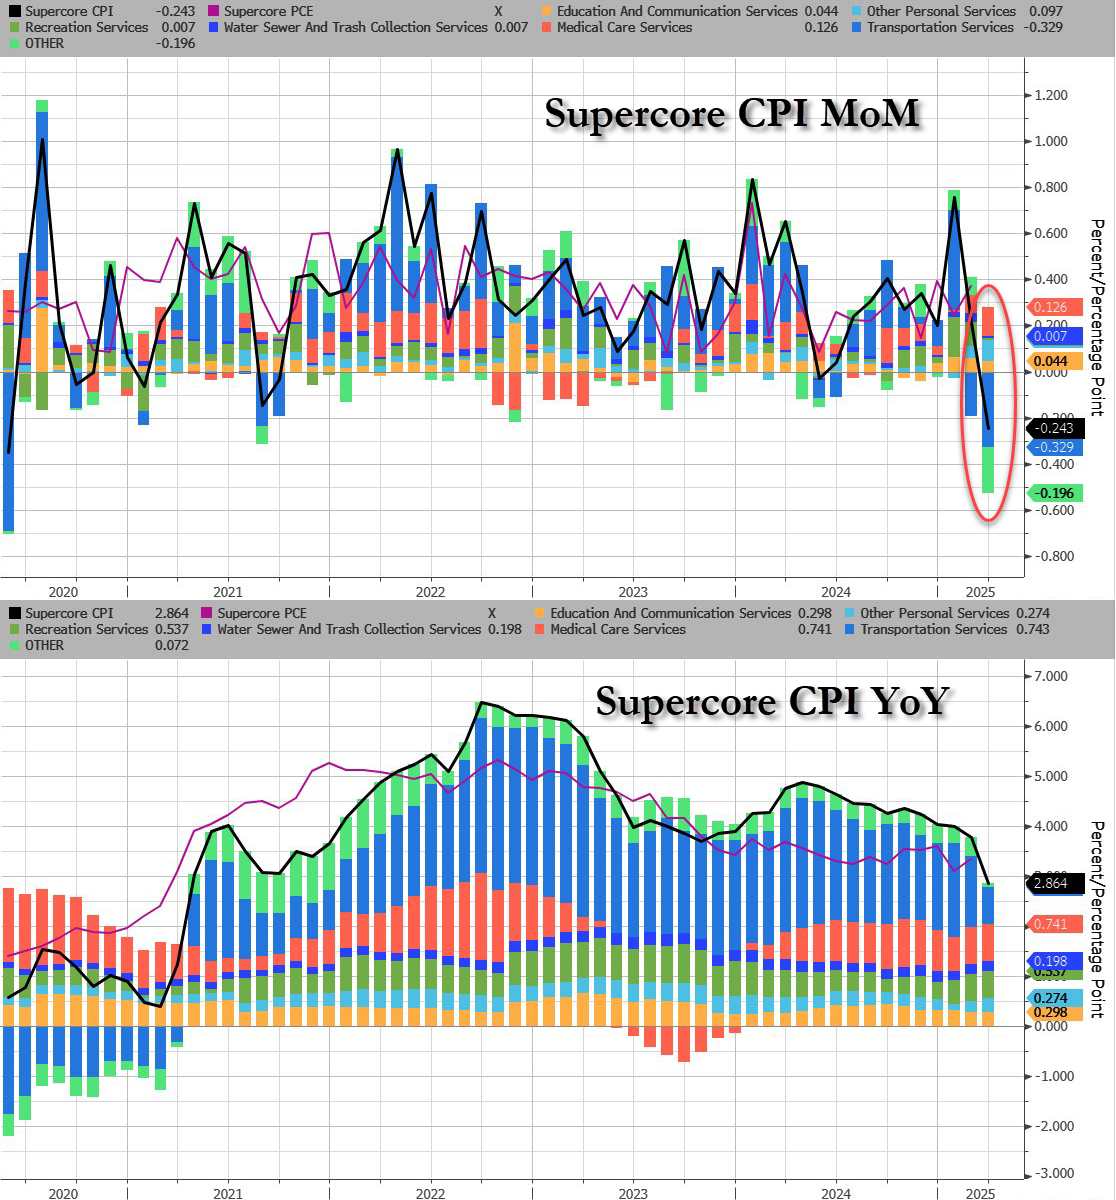
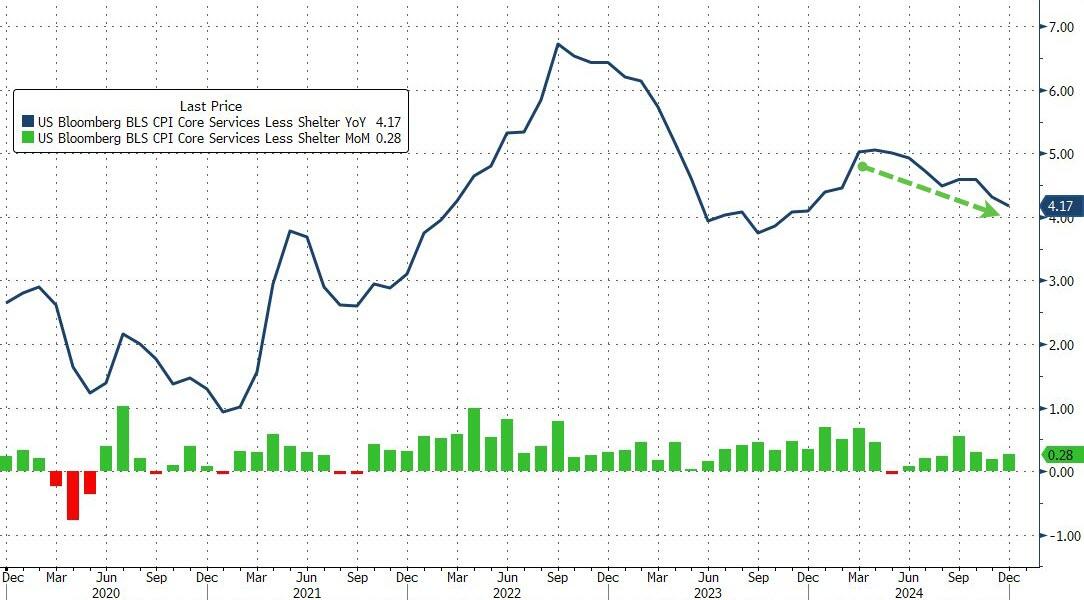
The so-called SuperCore CPI – Services Ex-Shelter – dropped 0.1% MoM dragging it down to +3.22% YoY – the lowest since Dec 2021…
Source: Bloomberg
Source: Bloomberg
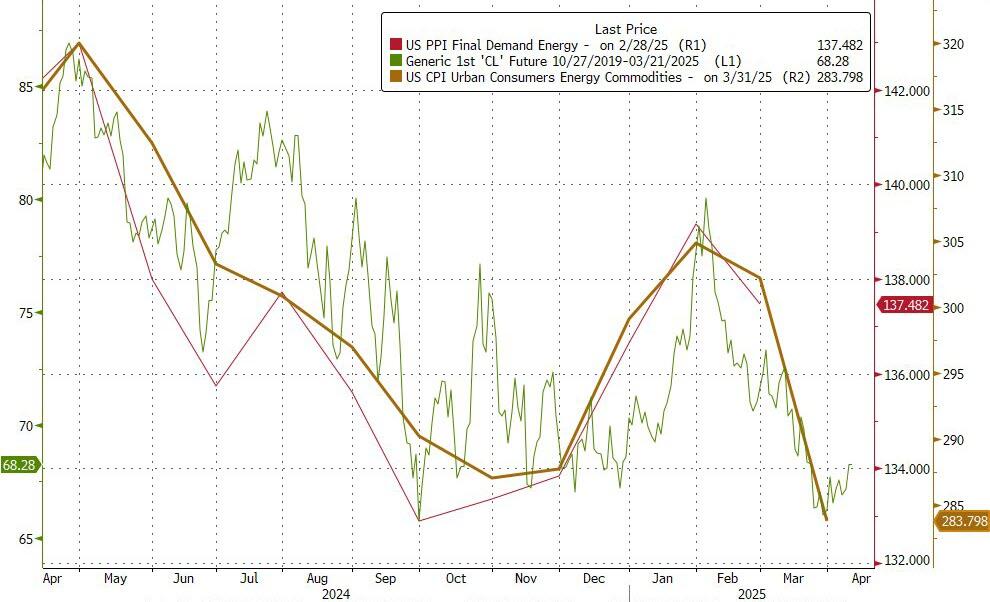
Drill Baby Drill (and tariffs recession fears) have dragged energy prices lower and pulled CPI lower with it…
Mortgage applications increased 2.3 percent from one week earlier, according to data from the Mortgage Bankers Association’s (MBA) Weekly Mortgage Applications Survey for the week ending February 7, 2025.
The Market Composite Index, a measure of mortgage loan application volume, increased 2.3 percent on a seasonally adjusted basis from one week earlier. On an unadjusted basis, the Index increased 6 percent compared with the previous week. The unadjusted Purchase Index increased 4 percent compared with the previous week and was2 percent higher than the same week one year ago. The seasonally adjusted Purchase Index decreased 2 percent from one week earlier.
The Refinance Index increased 10 percent from the previous week and was 33 percent higher than the same week one year ago.
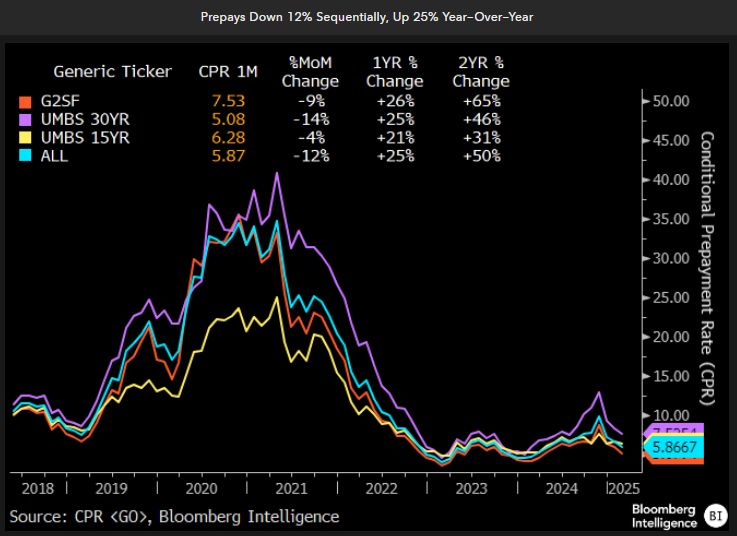
Prepays are down significantly since 2021 which marks the beginning of The Fed starting to raise rates.
Aggregate prepayments for agency mortgage-backed securities (MBS) fell 12% in January, with housing seasonals declining and mortgage rates lingering near 7%. MBS turnover speeds have bounced back considerably relative to 2023 lows, though high rates may be starting to take a toll. Even at current elevated rates, GNMA streamline refinancings are picking up as loans issued in spring of 2024 pass out of the refi lockout period.
One reason that US home prices remain high (and unaffordable for many) is The Federal Reserve (aka, The Green Slime). Former Fed Chair (and Biden’s Treasury Secretary is no Luciana Paluzzi, the Italian beauty from the James Bond film Thunderball. Yellen is just a far-left economic hack.
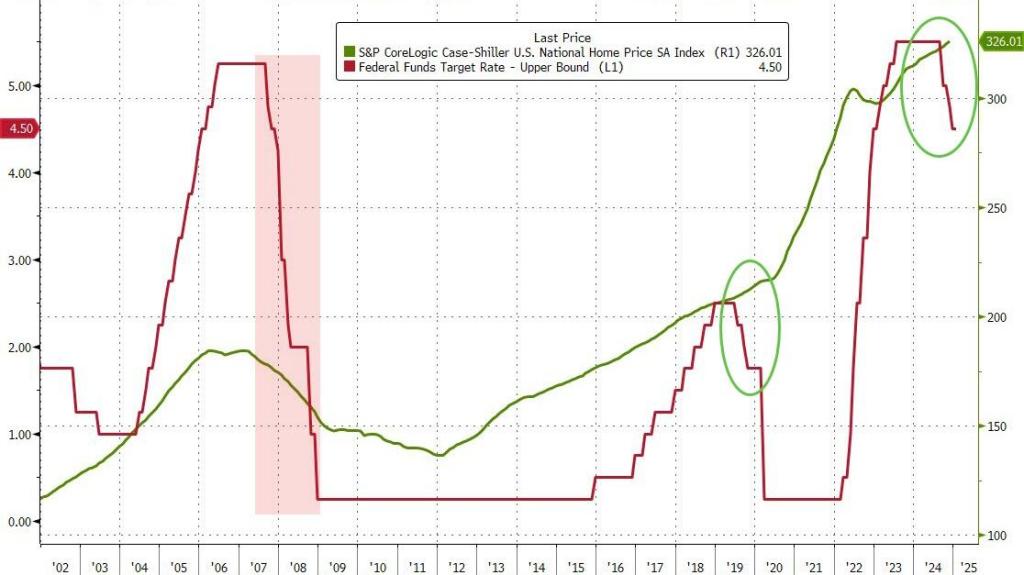
Look at the Case-Shiller national home price index compared with The Fed funds target rate.
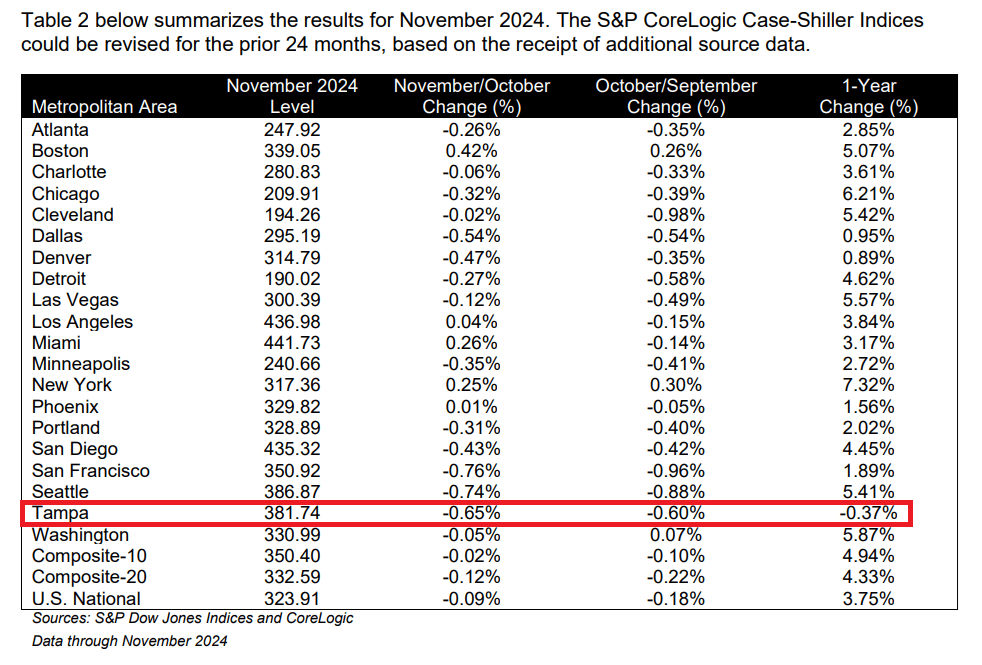
The S&P CoreLogic Case-Shiller U.S. National Home Price NSA Index, covering all nine U.S. census divisions, reported a 3.8% annual return for November, up from a 3.6% annual gain in the previous month. The 10-City Composite saw an annual increase of 4.9%, recording the same annual increase in the previous month. The 20-City Composite posted a year-over-year increase of 4.3%, up from a 4.2% increase in the previous month. New York again reported the highest annual gain among the 20 cities with a 7.3% increase in November, followed by Chicago and Washington with annual increases of 6.2% and 5.9%, respectively. Tampa posted the lowest return, falling 0.4%.
The pre-seasonally adjusted U.S. National, 20-City, and 10-City Composite Indices’ upward trends continued to reverse in November, with a -0.1% drop for the national index, while the 20-City Composite saw a -0.1% decline and the 10-City Composite was unchanged.
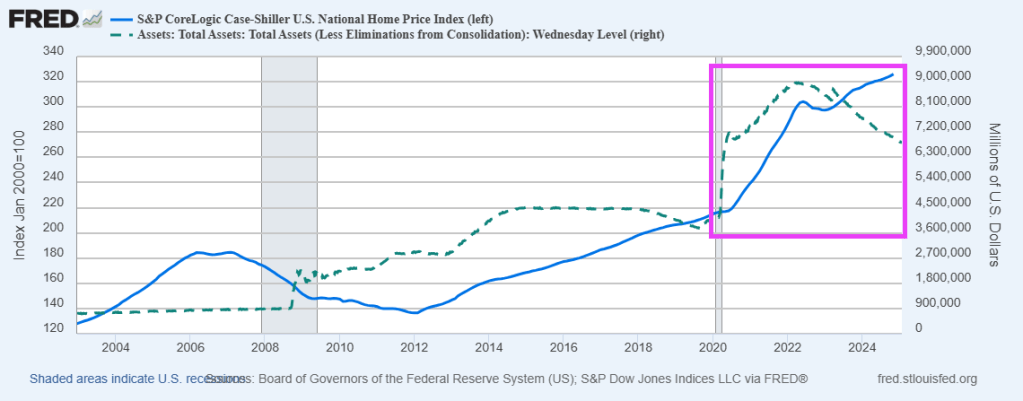
While the Fed Funds target rate gyrates, The Fed’s balance sheet remains high.
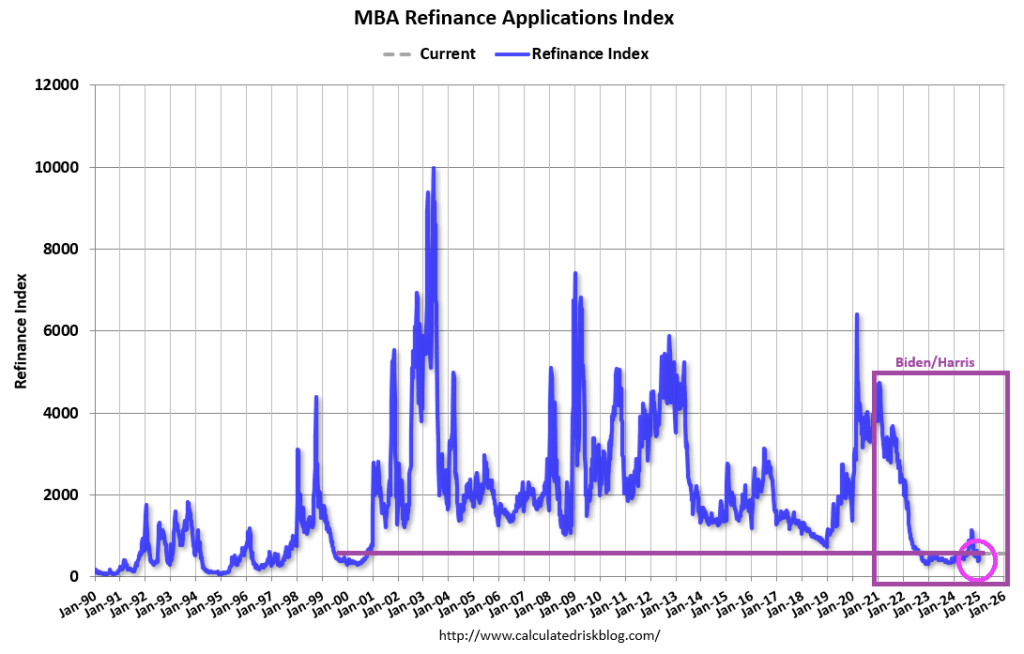
As The Pretenders sang, “My City Was Gone.” That song was about Akron, Ohio. But it applies to the US Mortgage Market under Biden/Harris. The question is whether Trump’s deregulation plans can return to its former glory.
Mortgage applications increased 0.1 percent from one week earlier, according to data from the Mortgage Bankers Association’s (MBA) Weekly Mortgage Applications Survey for the week ending January 17, 2025.
The Market Composite Index, a measure of mortgage loan application volume, increased 0.1 percent on a seasonally adjusted basis from one week earlier. On an unadjusted basis, the Index increased 3 percent compared with the previous week. The seasonally adjusted Purchase Index increased 1 percent from one week earlier. The unadjusted Purchase Index increased 7 percent compared with the previous week and was 2 percent higher than the same week one year ago.
The Refinance Index decreased 3 percent from the previous week and was 42 percent higher than the same week one year ago.
The Pretenders’ lead singer Chrissie Hynde likely would have made a better Federal Reserve Chair and Treasury Secretary than Janet Yellen.
This is the worst start to a fiscal year EVER: – Spending is up 10.9% – Receipts are down 2.2% – FYTD deficit up 39.4% at $711 billion They’re handing Trump a ticking time bomb!
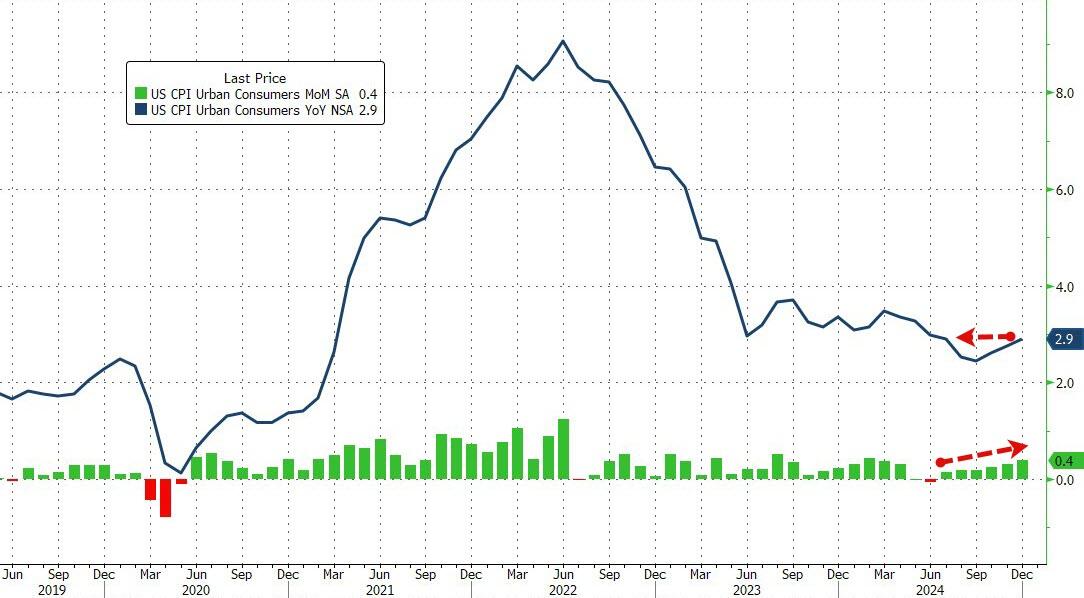
Speaking of Biden handing a ticking time bomb (according to Zero Hedge), after rising for 5 straight months, analysts expected headline consumer prices to continue accelerating in December (+0.4% MoM exp) and it did exactly that – the highest MoM print since March, leading the YoY CPI to rise 2.9% (the highest since July)…
Source: Bloomberg
CPI details:
Food
The index for food increased 0.3% in December, after rising 0.4% in November. The food at home index also rose 0.3% over the month. Four of the six major grocery store food group indexes increased in December. The index for cereals and bakery products rose 1.2% over the month, after falling 1.1% in November. The meats, poultry, fish, and eggs index increased 0.6 percent in December, as the eggs index rose 3.2 percent. The index for other food at home rose 0.3 percent over the month and the index for dairy and related products increased 0.2 percent.
Energy
The energy index increased 2.6% in December, after rising 0.2% in November. The gasoline index increased 4.4% over the month. (Before seasonal adjustment, gasoline prices decreased 1.1 percent in December.) The natural gas index rose 2.4 percent over the month and the index for electricity rose 0.3 percent in December. The energy index decreased 0.5 percent over the past 12 months. The gasoline index fell 3.4% over this 12-month span and the fuel oil index fell 13.1 percent over that period. In contrast, the index for electricity increased 2.8 percent over the last 12 months and the index for natural gas rose 4.9 percent.
All items less food and energy
The index for all items less food and energy rose 0.2 percent in December, after rising 0.3 percent in each of the 4 preceding months.
The shelter index increased 0.3 percent in December, as it did in November.
The index for owners’ equivalent rent also rose 0.3 percent over the month, as did the index for rent.
The lodging away from home index fell 1.0 percent in December, after rising 3.2 percent in November.
The medical care index increased 0.1 percent over the month, after rising 0.3 percent in October and November.
The index for physicians’ services increased 0.1 percent in December and the index for hospital services rose 0.2 percent over the month.
The airline fares index rose 3.9 percent in December, after rising 0.4 percent in the previous month.
The index for used cars and trucks rose 1.2 percent over the month and the index for new vehicles increased 0.5 percent.
Other indexes that increased in December include motor vehicle insurance, recreation, apparel, and education.
In contrast, the index for personal care fell 0.2 percent in December after rising 0.4 percent in November. The indexes for communication and alcoholic beverages also declined over the month. The household furnishings and operations index was unchanged in December
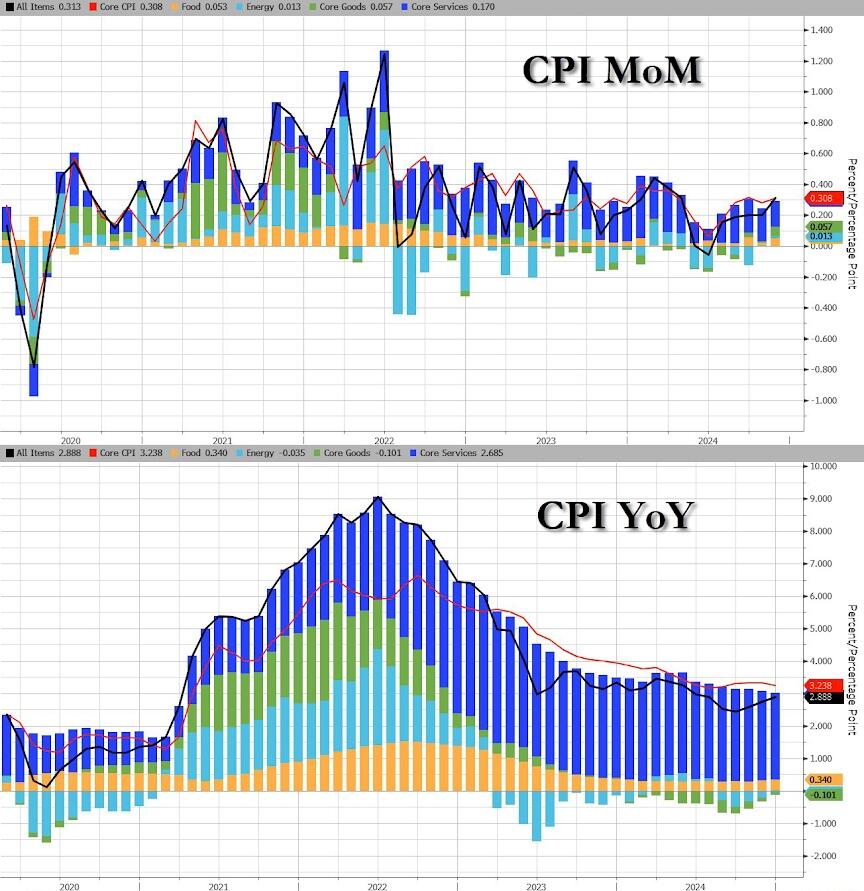
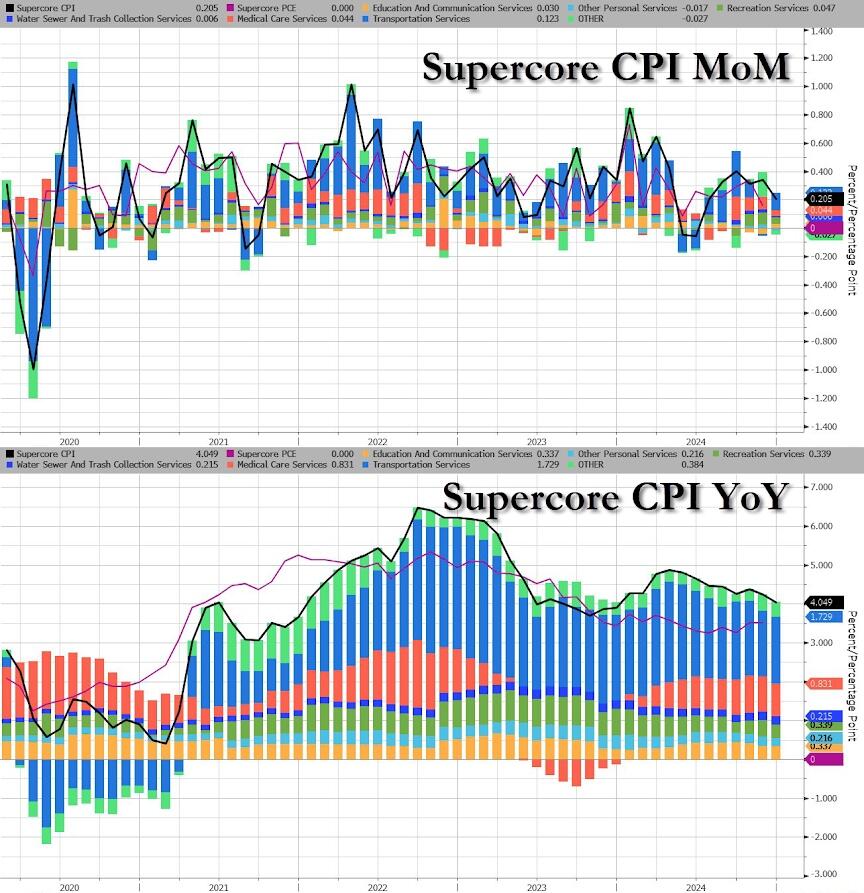
The resurgence of energy costs drove the hot headline CPI along with Core Services…
Source: Bloomberg
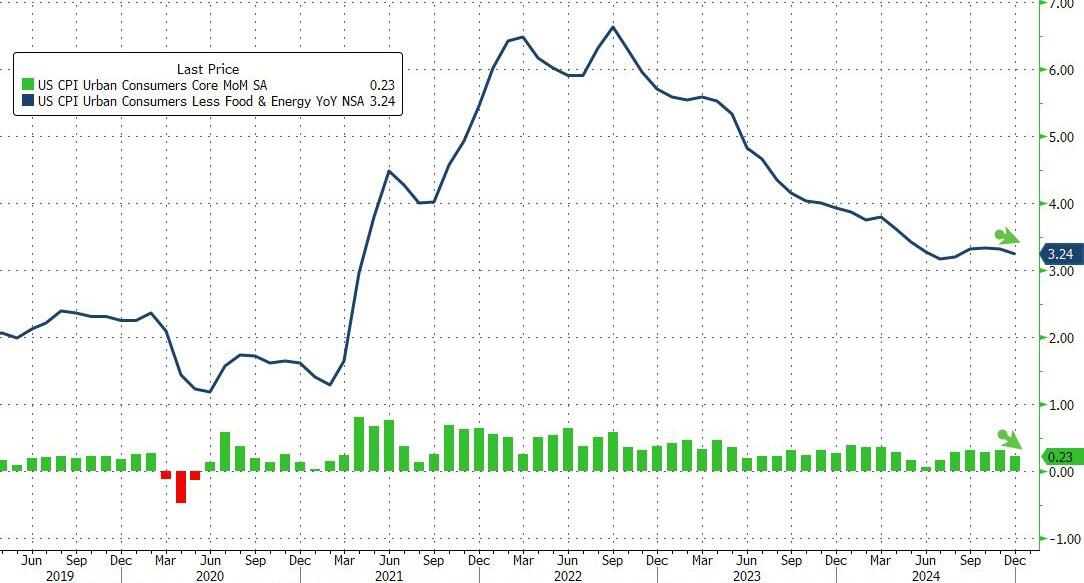
Core CPI (ex Food and Energy) dipped to +0.2% MoM (below the 0.3% exp) and the YoY pace of inflation slowed to 3.24% YoY. Core CPI rose EVERY month under Biden…
Source: Bloomberg
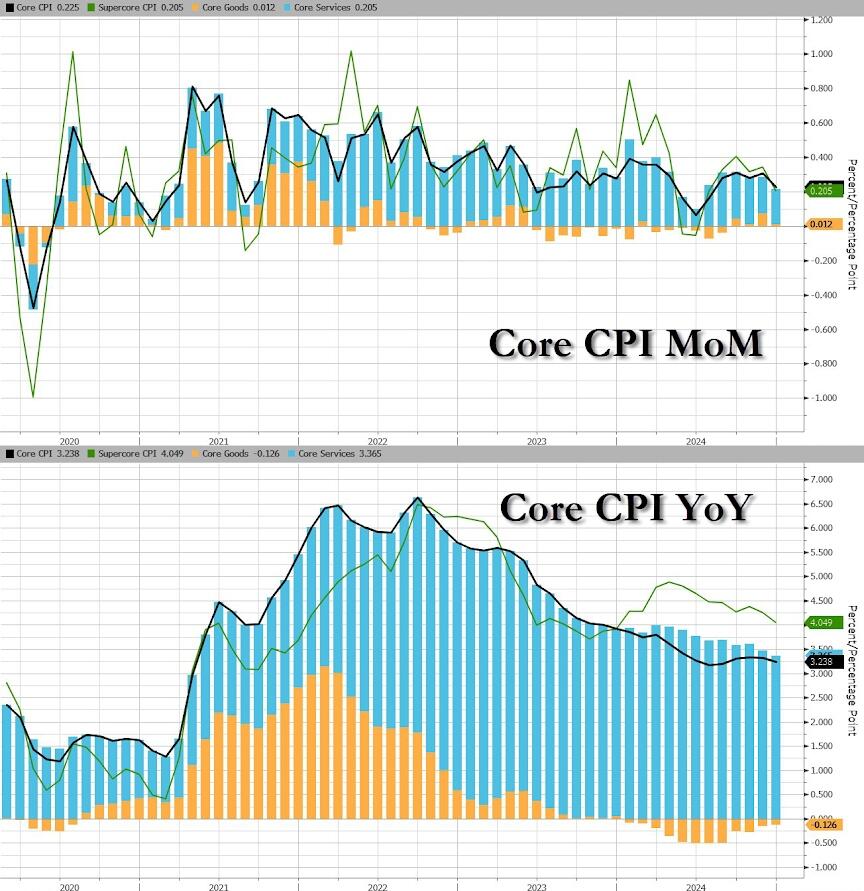
Core Goods price inflation slowed MoM (but deflation is gone on a YoY basis)…
Source: Bloomberg
The Fed’s favorite indicator of the CPI bunch – SuperCore or Services CPI ex-Shelter – rose 0.28% MoM (slowing the pace of annual inflation to +4.17%)…
Source: Bloomberg
Transportation Services were not MoM…
Source: Bloomberg
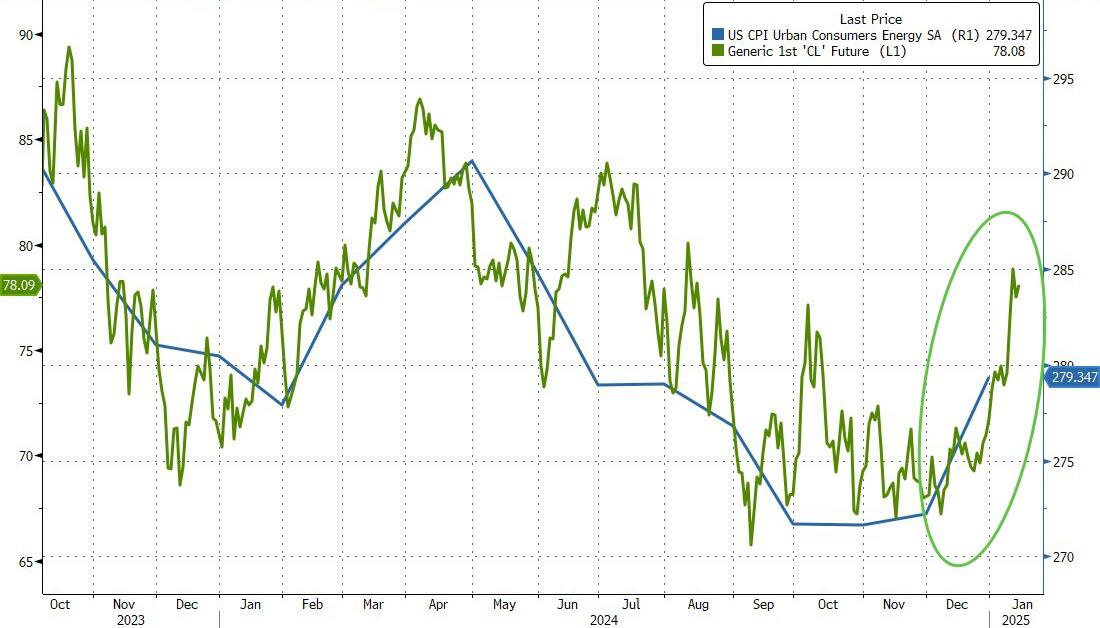
Overall, it’s energy costs that are re-emerging as a drive of inflation… thanks Joe!
Source: Bloomberg
…and Energy prices aren’t going down anytime soon in the CPI world… thanks Joe!
Source: Bloomberg
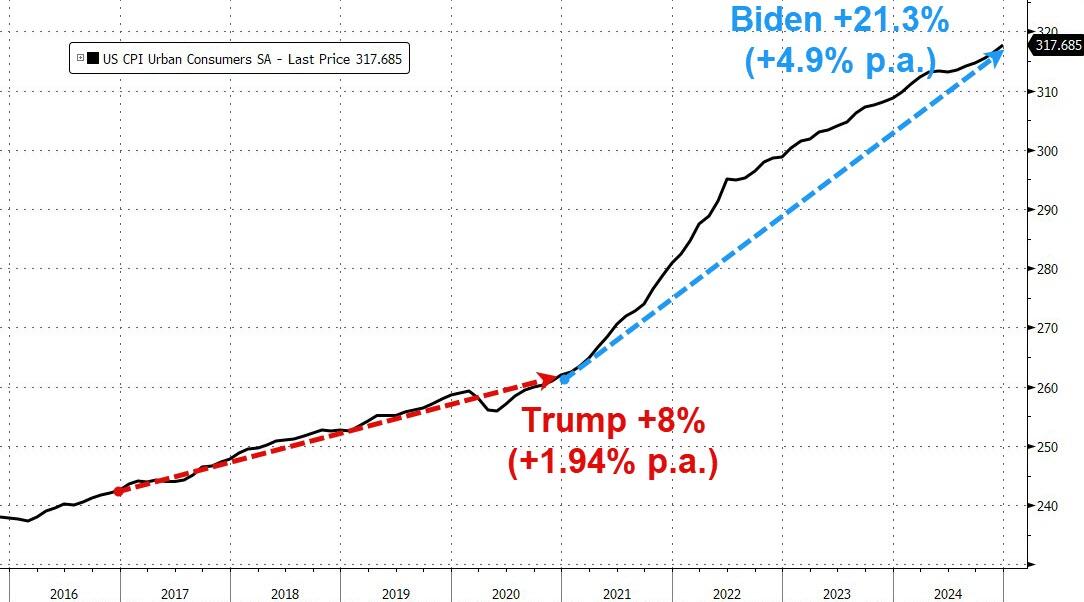
While Producer Prices under Biden rose at triple the rate they did under Trump, Consumer Prices soared 21.25% under Biden (+4.9% p.a.) vs 8%, 1.94% p.a. under Trump…
Source: Bloomberg
Finally, equity traders were braced for a volatile day ahead of the print, with options implying moves of 1.1% in either direction for the S&P 500, the most for a CPI day since March 2023.
Mortgage applications decreased 21.9 percent from two weeks earlier, according to data from the Mortgage Bankers Association’s (MBA) Weekly Mortgage Applications Survey for the week ending December 27, 2024. The results include an adjustment to account for the Christmas holiday.
The Market Composite Index, a measure of mortgage loan application volume, decreased 21.9 percent on a seasonally adjusted basis from two weeks earlier. On an unadjusted basis, the Index decreased 55 percent compared with two weeks ago. The seasonally adjusted Purchase Index decreased 13 percent compared with two weeks ago. The unadjusted Purchase Index decreased 48 percent compared with two weeks ago and was 17 percent lower than the same week one year ago.
The holiday adjusted Refinance Index decreased 36 percent from two weeks ago and was 10 percent higher than the same week one year ago. The unadjusted Refinance Index decreased 62 percent from two weeks ago and was 6 percent lower than the same week one year ago.
The fact that economic conditions are getting worse is certainly not good news, but it is better to know in advance what is coming. After four years under Joe Biden, the U.S. economy is a giant mess. We have been witnessing a slow-motion collapse right in front of our eyes, and those at the bottom levels of the economic food chain have been experiencing more pain than anyone else. Of course this is one of the biggest reasons why Donald Trump won the election.
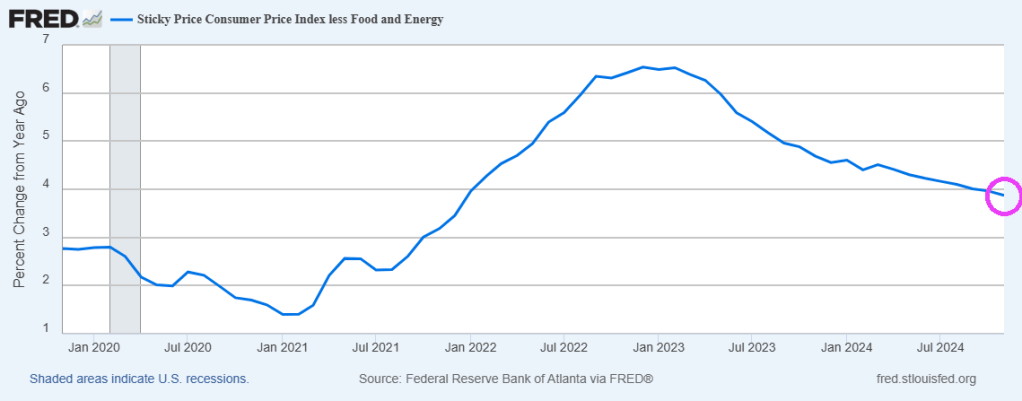
Example? Sticky inflation remains far higher under Biden/Harris than it did when Trump was President. Prices remain elevated as you will notice when Christmas shopping!
#1 When the economy is in good shape, holiday spending increases each year. In 2024, only 16 percent of Americans say that they are going to spend more than last year and 35 percent of Americans say that they are going to spend less…
Americans this holiday season say they are seeing a ghost of Christmas past: inflation.
The CNBC All-America Economic Survey finds inflation is still haunting the buying public, leading to what’s shaping up to be just an average season for retailers. Just 16% of respondents say they will spend more, down two points compared to last year. Forty-eight percent said that they’ll lay out the same amount for holiday gifts, up five points. At the same time, 35% say they’ll spend less, down two points as well.
#2 The number of job openings in the U.S. is now the lowest it has been since January 2021, but unlike January 2021 we don’t have a pandemic to blame our poor performance on…
US job openings tumbled last month to their lowest level since January 2021, a sign that the labor market is losing some momentum. Still, posted vacancies remain well above pre-pandemic levels.
The Labor Department reported Tuesday that the number of job openings dropped to 7.4 million in September from 7.9 million in August.
Economists had expected the level of openings to be virtually unchanged. Job openings fell in particular at healthcare companies and at government agencies at the federal, state and local levels.
#3 The manufacturing numbers that we are getting are extremely dismal. For example, the Philadelphia Federal Reserve Manufacturing Index just experienced an extremely sharp decline…
The Philadelphia Federal Reserve Manufacturing Index, a critical gauge of the general business conditions in Philadelphia, has reported a significant drop. The actual figure stands at -16.4, a sharp decline that suggests worsening conditions for manufacturers in the region.
This figure starkly contrasts with the forecasted number of 2.9, highlighting a more severe downturn than initially predicted. Analysts had anticipated a positive shift, indicating improving conditions, but the actual data presents a different, more concerning situation.
Moreover, when compared to the previous index value of -5.5, the current reading of -16.4 further emphasizes the severity of the decline. This continuous drop indicates a concerning trend for manufacturers within the Philadelphia Federal Reserve district.
#4 Thanks to rapidly rising mortgage rates, the average U.S. homebuyer just lost $33,250 in purchasing power in just six weeks…
Mortgage rates hit 7% on October 28, the highest level since the start of summer and up nearly one percentage point from the 18-month low they dropped to in mid-September.
A homebuyer on a $3,000 monthly budget can afford a $442,500 home with a 7% mortgage rate, the daily average 30-year fixed rate on October 28. That buyer has lost $33,250 in purchasing power over the last six weeks; they could have purchased a $475,750 home with the 6.11% average rate on September 17. That was the lowest level since February 2023.
#5 Our cost of living crisis is officially out of control. According to Bank of America, almost a third of all households “spend more than 95% of their disposable income on necessities such as housing costs, groceries and utility bills”…
Many Americans are still in a tough spot: Nearly 30% of all US households this year said they spend more than 95% of their disposable income on necessities such as housing costs, groceries and utility bills, according to a Bank of America Institute report, up from 2019 levels.
#6 A recent Lending Tree survey discovered that nearly a quarter of all households couldn’t pay their entire power bill at some point within the past year…
LendingTree’s findings about electricity bill costs comes as it reported 23.4% of Americans experienced an inability to cover their entire energy bill or portions of it in the last year, based on Census Bureau Household Pulse Survey data.
#7 The same Lending Tree survey found that about a third of all households had to reduce spending “on necessary things” within the past year in order to pay utility costs…
Needing to cover utility bills prompted 34.3% of Americans to curb their spending on necessary things – or eliminate some altogether – in at least one instance in the prior year, LendingTree said.
#8 As I discussed last week, demand is at record levels at food banks all over the nation…
Why is demand at food banks all over the country higher than it has ever been before? The media keeps insisting that economic conditions are just fine, but it has become quite obvious to everyone that this is not true. In particular, the rising cost of living has been absolutely crushing households from coast to coast. In the old days, most of the people that would show up at food banks were unemployed. But now food banks are serving large numbers of people that actually do have jobs but that don’t make enough to pay for all of the basics. The ranks of the “working poor” are growing very rapidly, and this is creating an unprecedented crisis all over America.
#9 During normal times, troubled retailers would at least wait until after the holiday season to throw in the towel. But we haven’t even reached Christmas and Party City has already announced that it will be closing all stores…
Party City is closing down all of its stores, ending nearly 40 years in business, CNN has learned.
CEO Barry Litwin told corporate employees Friday in a meeting viewed by CNN that Party City is “winding down” operations immediately and that today will be their last day of employment. Staff were told they will not receive severance pay, and they were told their benefits would end as the company goes out of business.
Big Lots is beginning ‘going out of business’ sales at all its stores across the US, as it prepares to close its remaining locations.
The discount retail chain filed for Chapter 11 bankruptcy in September, and has already shut hundreds of stores nationwide.
In a press release Thursday, the company said it would begin the sales at its 963 remaining locations, after a sale to a private equity firm fell through.
#11 As of the end of November, more than 7,000 store closings had been announced in the United States. That is a 69 percent increase from last year…
According to a report from CoreSight Research, U.S. retailers had announced more than 7,100 store closures through the end of November 2024, which represents a 69% increase compared to the same time in 2023. These closures are spread across numerous different sectors of retail from auto parts to restaurants to pharmacies, leaving many consumers wondering which companies will survive. This brings us to GameStop, the beloved retail gaming store, which has not only been closing hundreds of retail store locations since 2020, but also appears to be on track to close hundreds more of its locations in the very near future.
Look at all of these beautiful Christmas decorations at the Crocker Galleria mall in San Francisco. It’s 4:47 PM and everybody should be shopping and buying Christmas presents for their family, but nobody is in this mall.
There are only three stores left that are open here. The escalators hum on inside this beautiful but empty decorated mall.
Outside on Market Street the fentanyl addicts lay folded over while a street performer sings Last Christmas to an empty Street.
Of course the lack of shoppers at that particular mall is just the tip of the iceberg.
California’s biggest downtown areas are crumbling under the weight of homelessness and drug addiction, causing a vital part of its economy to dry out.
Cities like Los Angeles and San Francisco have made countless headlines since the pandemic about their drug-infested streets where businesses are quickly pulling out due to high crime rates and low consumer passage.
The number of drug addicts in America is at the highest level ever.
The number of homeless people in America is at the highest level ever.
They are victims of our slow-motion economic collapse, and the holidays will not be very happy for them.
So if you still have food on the table and a warm home to sleep in, you should consider yourself to be incredibly blessed.
Sadly, more Americans are being forced out into the streets with each passing day as the slow-motion collapse of our economy accelerates.


You must be logged in to post a comment.