US Mortgage Demand Declines 1.2% From Last Week, Purchase Demand Still Down -32% From Same Week Last Year While Refi Demand Down -51% YoY

This is last data dump for mortgage demand (applications) before Biden’s idiotic woke mortgage policies go into effect (taxing those with good credit to subsidize those with lousy credit) take effect. I call this Bolshevik Biden’s Mortgage Market.

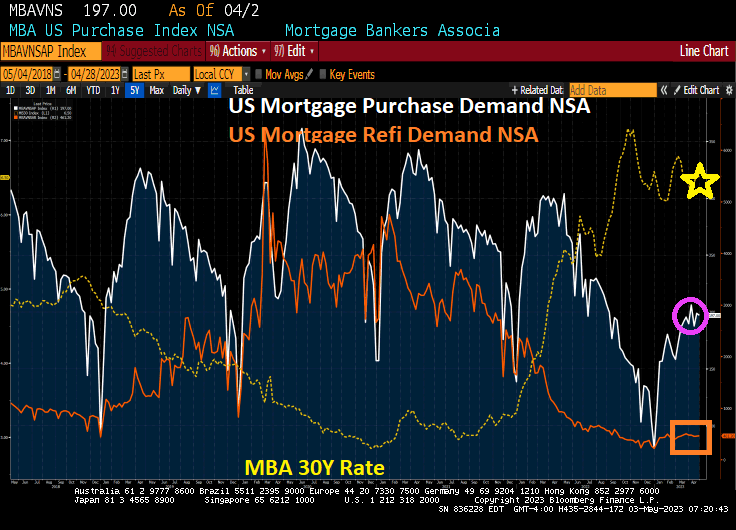
Mortgage applications decreased 1.2 percent from one week earlier, according to data from the Mortgage Bankers Association’s (MBA) Weekly Mortgage Applications Survey for the week ending April 28, 2023.

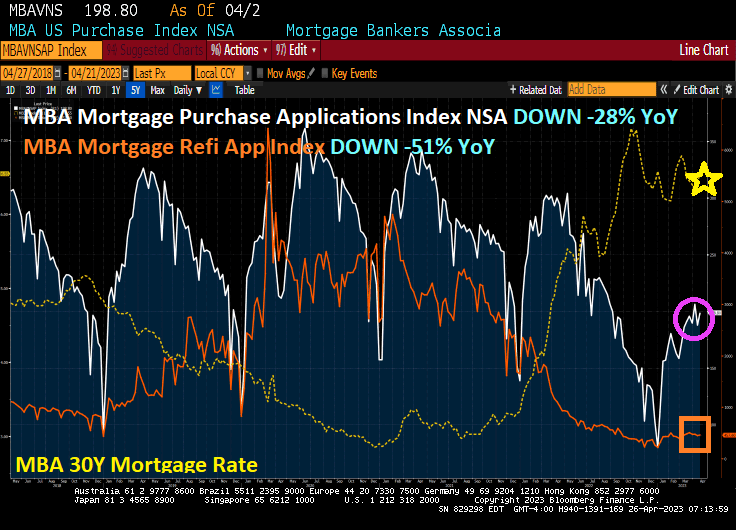
The Market Composite Index, a measure of mortgage loan application volume, decreased 1.2 percent on a seasonally adjusted basis from one week earlier. On an unadjusted basis, the Index decreased 0.4 percent compared with the previous week. The Refinance Index increased 1 percent from the previous week and was 51 percent lower than the same week one year ago. The seasonally adjusted Purchase Index decreased 2 percent from one week earlier. The unadjusted Purchase Index decreased 1 percent compared with the previous week and was 32 percent lower than the same week one year ago.

Bolshevik Biden.

US March Pending Home Sales Crash By -23.3% Since Last Year (YoY) And -5.2% Since Last Month (MoM) As Fed Retreats (16th Straight Month Of Negative Growth)

So much for the hopium spread by the Biden Administration and Realtors in general.

US Pending Home Sales crashed -23.3% YoY and -5.2% MoM for the 16th straight month of negative growth in pending home sales.

Wasting again in Bidenville, looking for my lost economy. Biden says Maga Republicans are to blame, but we know its Biden’s and Congress’s fault.

Wasting Away In Bidenville! US Mortgage Demand Rises 3.7% Since Last Week (WoW), But Mortgage Purchase Demand Remains -28% Lower Than Last Year (YoY) While Mortage Refi Demand Is -51% Lower

Wasting away again in Bidenville. Nibblin’ on ice cream. Watching the economy boil. Particularly mortgage demand.

Mortgage applications increased 3.7 percent from one week earlier, according to data from the Mortgage Bankers Association’s (MBA) Weekly Mortgage Applications Survey for the week ending April 21, 2023.

The Market Composite Index, a measure of mortgage loan application volume, increased 3.7 percent on a seasonally adjusted basis from one week earlier. On an unadjusted basis, the Index increased 5 percent compared with the previous week. The Refinance Index increased 2 percent from the previous week and was 51 percent lower than the same week one year ago. The seasonally adjusted Purchase Index increased 5 percent from one week earlier. The unadjusted Purchase Index increased 6 percent compared with the previous week and was 28 percent lower than the same week one year ago.

Slowdown! Case-Shiller Home Price Index Slows To Almost 0% YoY As Fed Pulls Out (SF Down -10% YoY, Seattle Down -9.3%, Miami Up +10.8%)

The US housing market is experiencing a slowdown as The Fed withdraws it outragous monetary stimlus.

The Case-Shiller 20 metro house price index grew at a rate of 036% year-over-year (YoY) in February.

Drifting into darkness, we have the West getting battered with my old hometown of San Francisco leading the pack at -10% YoY with Seattle down -9.3% YoY.

You know things are bad out west when Cleveland, Detroit and Chicago are gaining ground in prices. And Miami was up 10.8% YoY.

Crazy Train! US Existing Home Sales Crash To -22% YoY, Median Price Growth Goes Negative As Inventory For Sale Remains MIA (20 Straight Months Of Negative Home Sales)

We are on the Biden/Fed crazy train!

According to the National Association of Realtors, existing home sales fell -2.4% in March from February. And fell -21.97% since the same time last year (YoY).

And the median price of existing home sales fell -0.9% in March, the first negative growth since 2012.

This is like a Hardy Boys novel.

US Mortgage Demand Declines -8.8% Since Last Week As Mortgage Rates Rise 2.06% WoW, Purchase Mortgage Demand Down -36% YoY, Refi Mortgage Demand Down -56% YoY

It’s only mid April and mortgage demand should be approaching it’s yearly high. But under Biden and The Fed, mortgage demand seems to have peaked earlier than normal. It’s already late in mortgage cycle.

Mortgage applications decreased 8.8 percent from one week earlier, according to data from the Mortgage Bankers Association’s (MBA) Weekly Mortgage Applications Survey for the week ending April 14, 2023.

The Market Composite Index, a measure of mortgage loan application volume, decreased 8.8 percent on a seasonally adjusted basis from one week earlier. On an unadjusted basis, the Index decreased 8 percent compared with the previous week. The Refinance Index decreased 6 percent from the previous week and was 56 percent lower than the same week one year ago. The seasonally adjusted Purchase Index decreased 10 percent from one week earlier. The unadjusted Purchase Index decreased 9 percent compared with the previous week and was 36 percent lower than the same week one year ago.

Here are the numbers. And lousy they are.

Give me an F. Give me an E. Give me a D. What’s that spell? FED!

Jerome, are you kidding?

US Housing Starts Decline -17.2% YoY (11th Straight Month Of Negative Growth), But 1-unit Starts Up 2.74% MoM In March As Fed Removes Covid Stimulus

It’s springtime for housing! But winter for the mortgage market.

US housing starts have declined in March by -17.2% since the same time last year (YoY) as The Fed rapidly removes Covid-related monetary stimulus (green line).

On the positive side, 1-unit detached housing actually rose by 2.74% from February to March (MoM). However, 5+ unit (multifamily) starts decline -6.71% MoM. Permits are similar: 1-unit permits were up 4.07% in March from February while 5+ unit permits were down -24.27%.

Housing starts out west were down -28.13% MoM as people are escaping “Gruesome Newsom Land” (aka, California). Starts are up by 6.8% MoM in The South.

“Hey Aunt Nancy, do you think American voters will vote for me for President after I helped destroy California? Can I be President and spend like a mad man like you did as Speaker of the House??”

US Mortgage Purchase Demand Rises 8% From Last Week, But Still Down 31% From Last Year (Mortgage Rates Down -1.56% WoW)

Mortgage applications increased 5.3 percent from one week earlier, according to data from the Mortgage Bankers Association’s (MBA) Weekly Mortgage Applications Survey for the week ending April 7, 2023.

The Market Composite Index, a measure of mortgage loan application volume, increased 5.3 percent on a seasonally adjusted basis from one week earlier. On an unadjusted basis, the Index increased 6 percent compared with the previous week. The Refinance Index increased 0.1 percent from the previous week and was 57 percent lower than the same week one year ago. The seasonally adjusted Purchase Index increased 8 percent from one week earlier. The unadjusted Purchase Index increased 9 percent compared with the previous week and was 31 percent lower than the same week one year ago.

The rest of the story.

Mortgage Demand Decreased -4.1% From One Week Earlier As Rates Decline, Purchase Demand Down -35% Since Last Year, Refi Demand Down -59% (REAL Weekly Wage Growth = -1.9% YoY, REAL Home Price Growth = -3.86% YoY)

My friend Phill Hall asked me about the state of the US housing market yesterday. My answer? “Chaos.” Why chaos? Here is why: 23 consecutive months of NEGATIVE real wage growth, declining availability of homes for sale, still expensive home prices following the Covid spending surge, and rising mortgage rates as The Fed fights inflation.

And now we have mortgage demand shrinking 4.1% from the previous week according to the Mortgage Bankers Association’s (MBA) Weekly Mortgage Applications Survey for the week ending March 31, 2023.

The Market Composite Index, a measure of mortgage loan application volume, decreased 4.1 percent on a seasonally adjusted basis from one week earlier. On an unadjusted basis, the Index decreased 4 percent compared with the previous week. The Refinance Index decreased 5 percent from the previous week and was 59 percent lower than the same week one year ago. The seasonally adjusted Purchase Index decreased 4 percent from one week earlier. The unadjusted Purchase Index decreased 3 percent compared with the previous week and was 35 percent lower than the same week one year ago.

Throw in the declining inventory of homes for sales, and we have chaos.

Not to mention 23 consecutive months of negative REAL wage growth.

Well, at least REAL home prices are growing more slowly (-3.86% YoY) than REAL weekly wage growth -1.9% YoY). So much for housing as a hedge against inflation!

But it’s transitory! /sarc

US Pending Home Sales Increased 0.8% in February But Down 21.1% Year-over-year As Fed Retreats (Negative YoY Growth For 20 Of Last 21 Months)

Pending home sales grew in February for the third consecutive month, according to the National Association of REALTORS®. Three U.S. regions posted monthly gains, while the West declined. All four regions saw year-over-year decreases in transactions.

The Pending Home Sales Index (PHSI)* — a forward-looking indicator of home sales based on contract signings — improved 0.8% to 83.2 in February. Year-over-year, pending transactions dropped by 21.1%. An index of 100 is equal to the level of contract activity in 2001.

More notably, the YoY growth rate has been NEGATIVE for 20 of the last 21 months. And 15 straight months.

Biden’s energy policies + insane Federal spending = inflation = Fed slowing M2 Money growth. Hence, pending home sales YoY is down -21.1%.