The US Q1 GDP report is due out tomorrow morning. The forecast is for -1.3% decline in GDP.
The Atlanta Fed GDPNow real-time GDP tracker is for 1.806% for Q2. If this holds, then recession fears will diminish.
Even though the US may avoid consecutive negative GDP quarters, M2 Money Velocity (GDP/M2 Money) got crushed by The Fed’s reaction to Covid back in 2020.
Mortgage rates have increased dramatically under “Middle Class Joe” as The Federal Reserve attempts to choke-off inflation caused by … The Fed coupled with Biden’s energy policies (hope you are enjoying those high gasoline and diesel prices!) and the Federal government’s staggering spending spree under Pelosi, Schumer and McConnell.
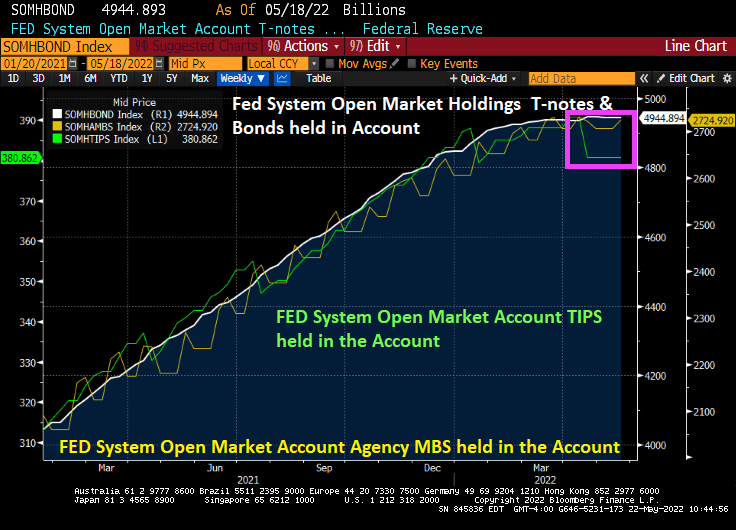
Thus far, The Federal Reserve has leveled-out out their Treasury Note and Bond purchases, increased their Agency Mortgage-backed Securities (AgMBS) holdings, but strangely have reduced their holding of Treasury Inflation-Protected Securities (TIPS) in the face of rising inflation.
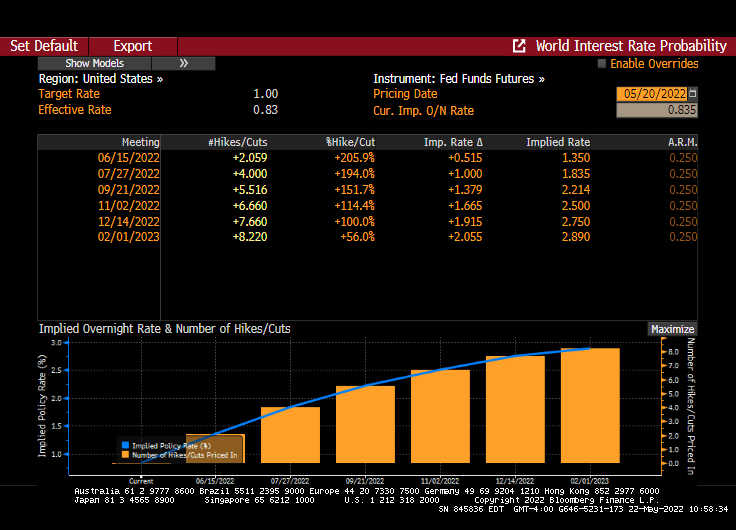
And while The Fed Funds Target rate is a lowly 1%, it is projected to rise to 2.890% by the February 1, 2023 FOMC meeting. That should send mortgage rates up.
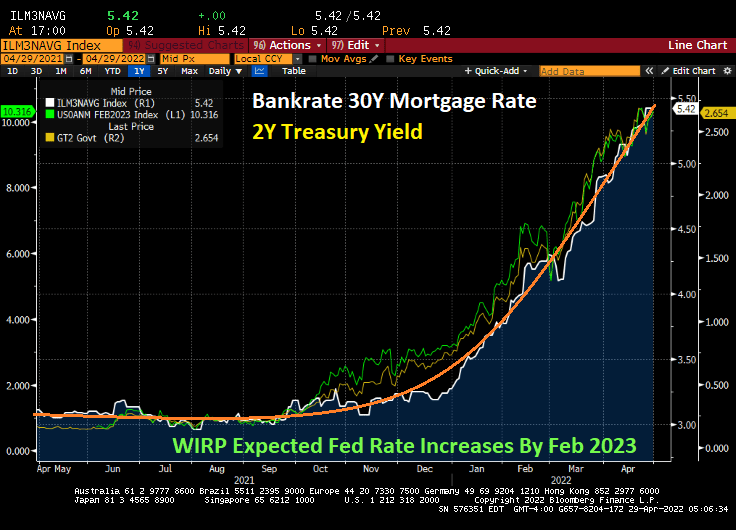
As if mortgage rates haven’t skyrocketed already, thanks to The Fed’s jawboning about having to raise rates and extinguish inflation.
With sizzling mortgage rates (cooling a bit as the global economy slows), home mortgage payments have risen +43.4% YoY.
Now we have President Biden trying to scare us about the Monkey Pox, yet leaves the southern border wide open. One would think that Biden would shut the borders (as if the surge in Fentanyl, sex trafficking and other diseases aren’t reason enough. But I do predict another massive spending bill from Biden/Congress to combat Monkey Pox and the resurgence of Covid variants.
Meanwhile The Fed jawbones fighting inflation with monetary tightening in the future, even if they jawboning causes mortgage rates to soar and mortgage payments to spiral.
M2 Money Velocity (GDP/M2 Money) peaked in Q3 1997, but after several bouts of Fed money printing, M2 Money Velocity is near the all-time low at 1.1216 In Q1 2022. And M2 Money stock is still growing at a torrid pace of 9.9% YoY. But the massive overreaction of The Federal Reserve in response to the Covid outbreak has led to near zero money velocity.
Now with The Federal Reserve considering removing the monetary stimulus, what will happen to US GDP left to survive on its own?
An example of how The Fed’s expected tightening of monetary policy can be seen in the meteoric rise in mortgage rates.
So, the US has hit terminal money velocity. I wish The Fed lots of luck going forward.
Is Charlie Sheen the Chairman of The Federal Reserve Board of Governors?? That must be Lael Brainard falling out of the sky with Charlie Sheen (aka, Jerome Powell).
As we are painfully aware, The Fed’s exaggerated monetary flood combined with Federal stimulus spending has led to horrible inflation.
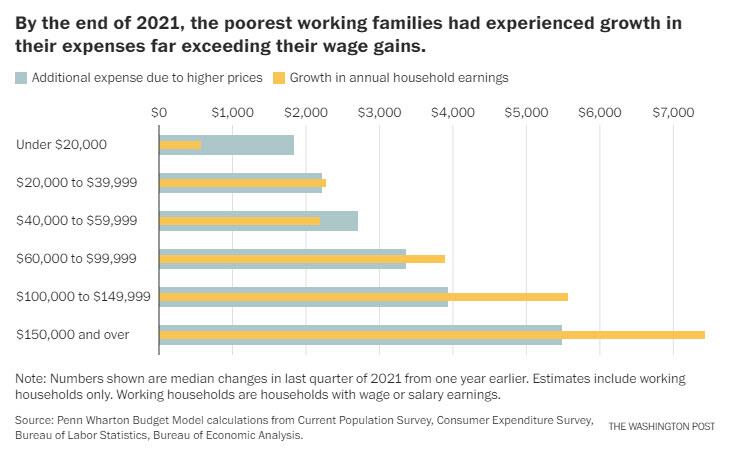
Yes, despite what government talking heads say, Federal stimulus increases demand for goods, the supply is generally slow to respond resulting in rising prices. Then government policies driving up energy prices also leads to highers prices. Throw in Federal Reserve monetary stimulypto and we have this chart from hell from Penn-Wharton. The chart shows that households earning less that $60,000 experience higher expenses due to rising prices than their gain in earnings.
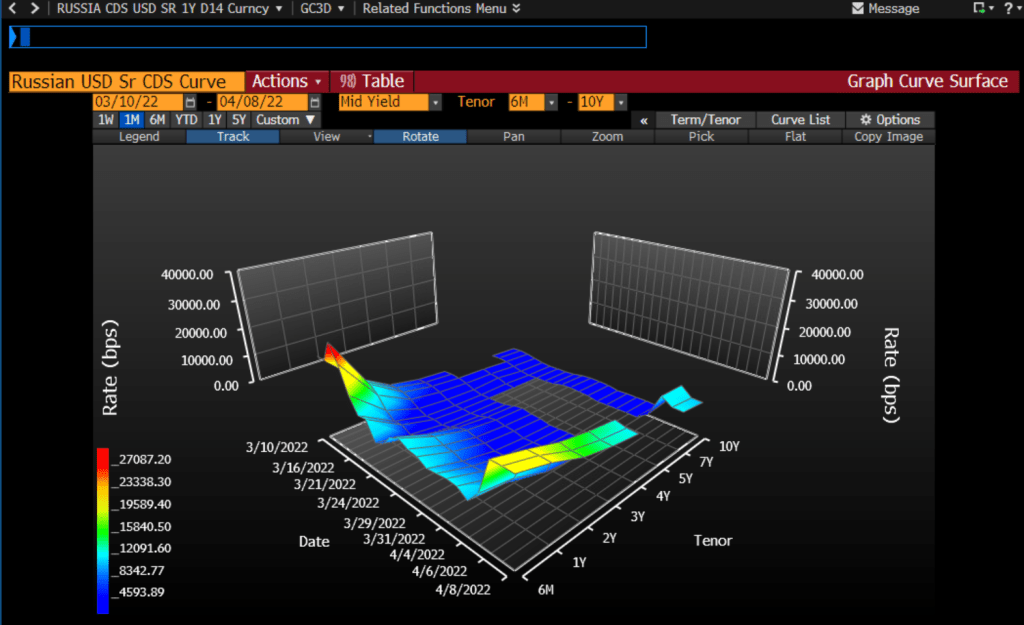
Another chart from hell is the Russian USD Credit Default Swap (CDS) curve. It is spiking at over 20,000.
The one-year Russian CDS is currently at a whopping 20,336 indicating that there is about a 99% of a Russian default over the coming year. As someone who lived through the 1998 Russian credit default scare on Wall Street, this will send a shock wave through credit and Treasury markets.
On the US Treasury front, this chart shows how steeply sloped the US Treasury actives curve has become. Steep until 3 years, then flat. I call this chart “T-Dazzle!” T-Dazzle because I can’t believe how badly the Biden Administration and The Federal Reserve are screwing up the country.
Crude oil? WTI Crude is back to almost $100 per barrel while Brent Crude is at $102.78 per barrel. Wheat is up 3.22% thanks largely to problems related to Russia invading Ukraine (Europe’s bread basket) and a dismal Chinese wheat harvest.
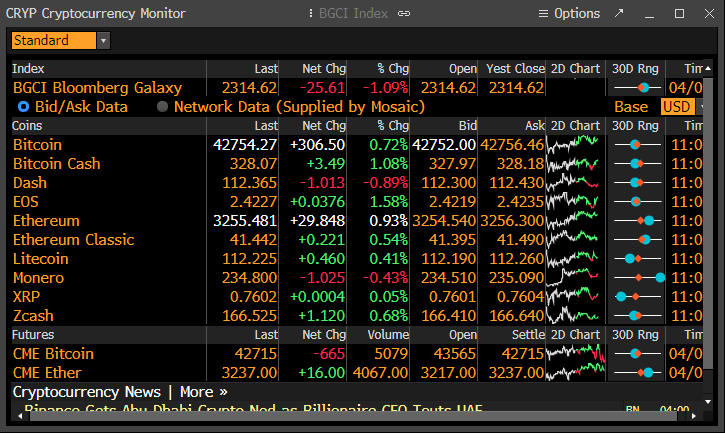
Cryptocurrencies, the alternatives to the US fiat dollar, are rising (in particular, Bitcoin and Ethereum).
Of course, I have to finish up with the soaring 30-year mortgage rate.
The US Producer Price Index (PPI) final demand rose 10% YoY in February, further evidence of spiraling inflation under Biden/Pelosi/Schumer’s reign of error.
And speaking of Senate Majority Leader Chuck Schumer (D-NY), the Empire State Manufacturing Survey (General Business Conditions) crashed to -11.8.
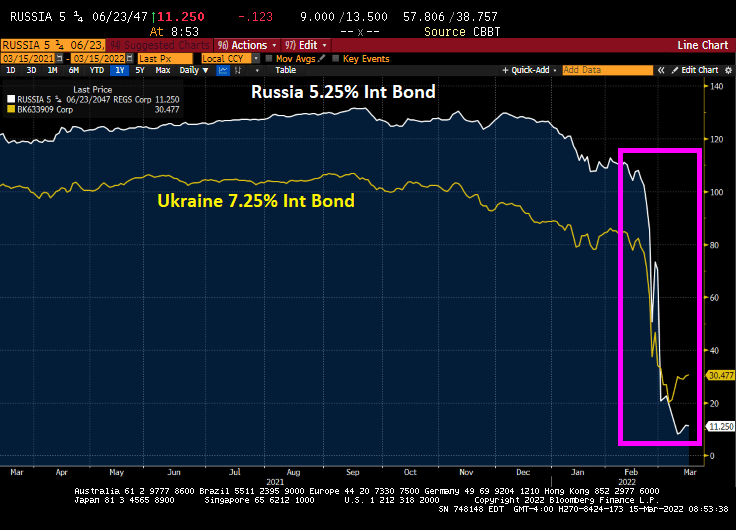
And Russia is losing the economic demolition derby with Ukraine (at least for sovereign debt).
I am still trying to figure out what House Speaker Nancy Pelosi (D-San Francisco) meant by “When we’re having this discussion, it’s important to dispel some of those who say, well it’s the government spending. No, it isn’t. The government spending is doing the exact reverse, reducing the national debt. It is not inflationary.”
Really Nancy?
Here is a chart of Federal government outlays and inflation. Massive expenditures and growth in Federal debt and the resulting inflation. Nancy?
Inflation is the highest in 40 years. There used to be a lot of discussion about hedging against inflation in the 1970s and 1980s, but discussion subsided as inflation cooled in the US. But now it is roaring back as Fed monetary stimulus continues unabated and The Federal government continues to spends like crazy.
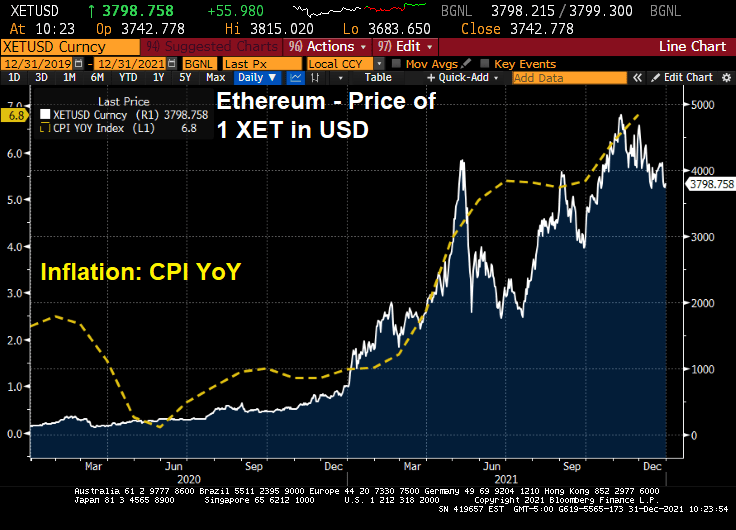
So, how do we protect ourselves against inflation caused by Federal government policies (or follicies)? How about cryptocurrencies like Ethereum?
Ethereum really started to take off as US inflation took off. Not a perfect fit (or hedge), but on average Ethereum has kept up with inflation.
If you believe in technical analysis, Ethereum is in the 3rd wave on the downside.
But if you believe the Ichimoku Cloud, Ethereum lies BELOW the cloud indicating that Ethereum is likely to rise.
Bear in mind that Biden’s energy policies have created large increases in energy prices which lead to large increases in other products such as food prices. Again, not all inflation is due to Federal policies. Arabica coffee prices are driven by droughts and excessive rainfall, etc. But inflation causes a rise in agriculture prices due to transportation cost increases, increases in fertilizer prices (thank to natural gas price increases), and panic buying by consumers.
Despite what Federal officials jawbone about, inflation has momentum and is unlikely to swiftly subside, particularly if the Build Back (Inflation) Better Act passes in 2022.
Remember, consumer purchasing power of the US Dollar has declined dramatically since the creation of The Federal Reserve System in 1913. The Fed isn’t going away and neither is wasteful Federal spending, like BBB.
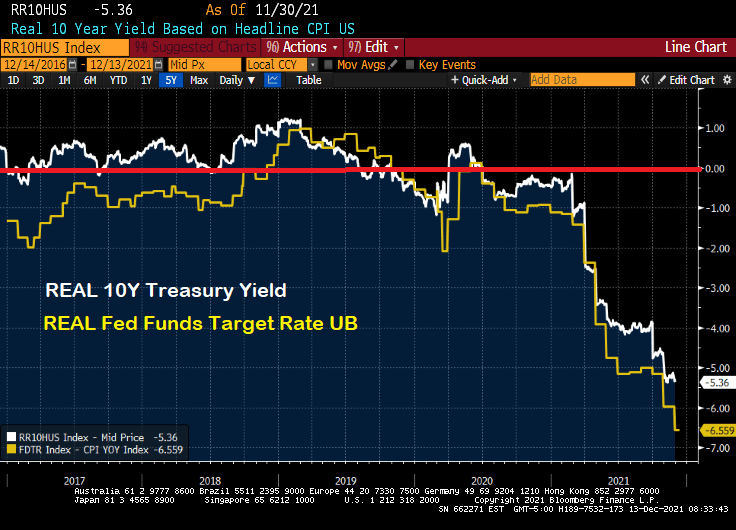
Inflation-adjusted return of Treasuries fell to lowest since the 1980s. For bond investors, this is their version of Kevin’s Famous Chili from The Office! Or The Fed’s Famous Chili!
(Bloomberg) — Treasury investors are losing more money than they have in four decades, once inflation is taken into account. And if markets are right, they’re unlikely to come out ahead for years.
The federal government’s debt has already lost about 2% outright over the past year as the Federal Reserve started removing pandemic-era stimulus from the economy and inched closer toward raising interest rates. But on top of that, the consumer price index has surged 6.8%, putting investors even deeper in the hole.
Taken together, that’s resulting in the worst real returns — or those adjusted for inflation — since the early 1980s, when then Fed Chair Paul Volcker was in the midst of fighting a wage-price spiral. What’s more, the dynamic isn’t expected to change: The bond market is projecting that 10-year Treasury yields will hold below the inflation rate for the next decade, meaning any investment income will be more than wiped out by the rising cost of living.
If we look at the REAL 10-year Treasury yield and REAL Fed Funds Target Rate, they are both negative.
Let’s see if Powell spills his famous chili on Wednesday at 2:00PM EST. The Fed keeps saying they are serious about controlling inflation, just like Kevin Malone.
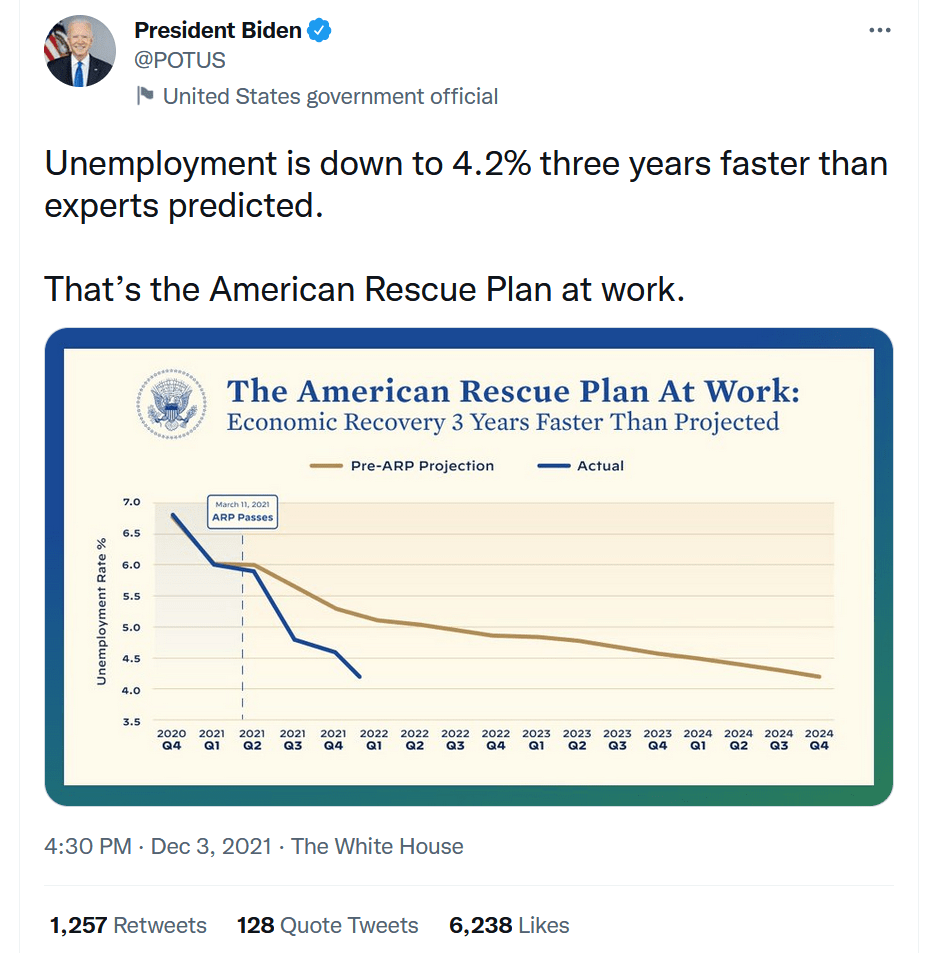
President Joe Biden took to Twitter yesterday to celebrate how well his economic policies are working, particularly the American Rescue Plan. Between Congress and The Fed pumping trillions of dollars of stimulus in the economy, how is this surprising? Or a reason for celebration?
While declining unemployment is great, there is more to the story that President Biden failed to mention. Like … the number of people NOT in the labor force remains near 100 million (99,997,000 to be exact). Thanks to Covid-related policies (like job loss due to resisting vaccinations), increasing retirement, etc.), NOT in labor force remains elevated compared to pre-Covid levels. And, of course, Biden doesn’t want to mention that inflation is growing faster than hourly wage growth resulting in REAL hourly wage growth being -1.4% YoY.
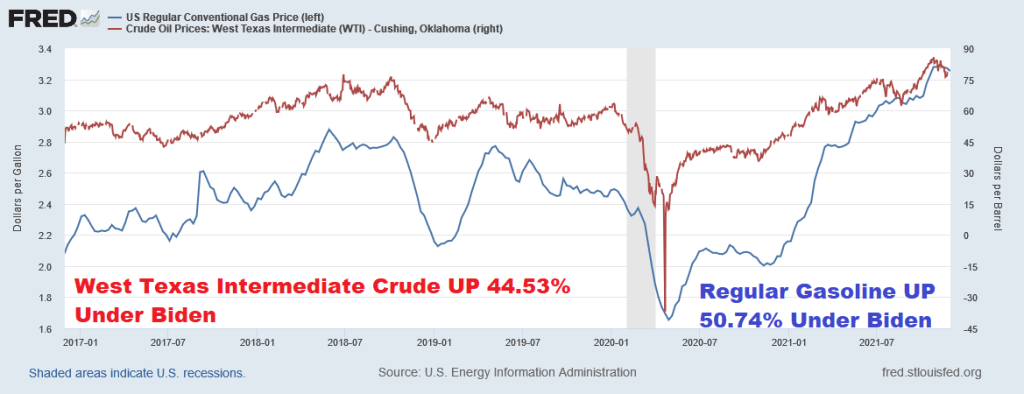
And President Biden took credit (he is a politician, after all) for a small decline in gasoline prices. Of course, after helping send gasoline prices up over 50% since he took office.
So, is Biden going to take credit for increasing gasoline prices by 50%? And declining REAL average hourly earnings? Or over 100 million people NOT in the labor force? I doubt it. But he is focusing on the POSITIVES of his American Rescue Plan.


You must be logged in to post a comment.